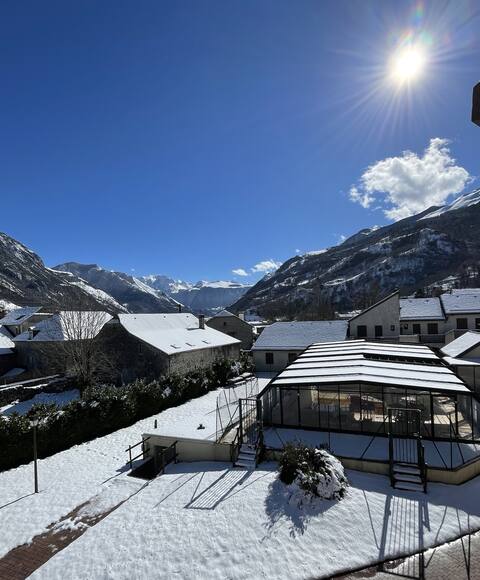
Bielle Airbnb Market Analysis 2025: Short Term Rental Data & Vacation Rental Statistics in Nouvelle-Aquitaine, France
Is Airbnb profitable in Bielle in 2025? Explore comprehensive Airbnb analytics for Bielle, Nouvelle-Aquitaine, France to uncover income potential. This 2025 STR market report for Bielle, based on AirROI data from April 2024 to March 2025, reveals key trends in the niche market of 25 active listings.
Whether you're considering an Airbnb investment in Bielle, optimizing your existing vacation rental, or exploring rental arbitrage opportunities, understanding the Bielle Airbnb data is crucial. Leveraging the low regulation environment is key to maximizing your short term rental income potential. Let's dive into the specifics.
Key Bielle Airbnb Performance Metrics Overview
Monthly Airbnb Revenue Variations & Income Potential in Bielle (2025)
Understanding the monthly revenue variations for Airbnb listings in Bielle is key to maximizing your short term rental income potential. Seasonality significantly impacts earnings. Our analysis, based on data from the past 12 months, shows that the peak revenue month for STRs in Bielle is typically August, while November often presents the lowest earnings, highlighting opportunities for strategic pricing adjustments during shoulder and low seasons. Explore the typical Airbnb income in Bielle across different performance tiers:
- Best-in-class properties (Top 10%) achieve $2,034+ monthly, often utilizing dynamic pricing and superior guest experiences.
- Strong performing properties (Top 25%) earn $1,529 or more, indicating effective management and desirable locations/amenities.
- Typical properties (Median) generate around $1,157 per month, representing the average market performance.
- Entry-level properties (Bottom 25%) see earnings around $718, often with potential for optimization.
Average Monthly Airbnb Earnings Trend in Bielle
Bielle Airbnb Occupancy Rate Trends (2025)
Maximize your bookings by understanding the Bielle STR occupancy trends. Seasonal demand shifts significantly influence how often properties are booked. Typically, Augustsees the highest demand (peak season occupancy), while April experiences the lowest (low season). Effective strategies, like adjusting minimum stays or offering promotions, can boost occupancy during slower periods. Here's how different property tiers perform in Bielle:
- Best-in-class properties (Top 10%) achieve 68%+ occupancy, indicating high desirability and potentially optimized availability.
- Strong performing properties (Top 25%) maintain 58% or higher occupancy, suggesting good market fit and guest satisfaction.
- Typical properties (Median) have an occupancy rate around 37%.
- Entry-level properties (Bottom 25%) average 21% occupancy, potentially facing higher vacancy.
Average Monthly Occupancy Rate Trend in Bielle
Average Daily Rate (ADR) Airbnb Trends in Bielle (2025)
Effective short term rental pricing strategy in Bielle involves understanding monthly ADR fluctuations. The Average Daily Rate (ADR) for Airbnb in Bielle typically peaks in July and dips lowest during March. Leveraging Airbnb dynamic pricing tools or strategies based on this seasonality can significantly boost revenue. Here's a look at the typical nightly rates achieved:
- Best-in-class properties (Top 10%) command rates of $159+ per night, often due to premium features or locations.
- Strong performing properties (Top 25%) achieve nightly rates of $97 or more.
- Typical properties (Median) charge around $70 per night.
- Entry-level properties (Bottom 25%) earn around $62 per night.
Average Daily Rate (ADR) Trend by Month in Bielle
Get Live Bielle Market Intelligence 👇

Explore Real-time Analytics
Airbnb Seasonality Analysis & Trends in Bielle (2025)
Peak Season (August, June, July)
- Revenue averages $1,794 per month
- Occupancy rates average 56.3%
- Daily rates average $100
Shoulder Season
- Revenue averages $1,188 per month
- Occupancy maintains around 37.8%
- Daily rates hold near $97
Low Season (January, March, November)
- Revenue drops to average $694 per month
- Occupancy decreases to average 27.5%
- Daily rates adjust to average $96
Seasonality Insights for Bielle
- The Airbnb seasonality in Bielle shows highly seasonal trends requiring careful strategy. While the sections above show seasonal averages, it's also insightful to look at the extremes:
- During the high season, the absolute peak month showcases Bielle's highest earning potential, with monthly revenues capable of climbing to $2,247, occupancy reaching a high of 74.2%, and ADRs peaking at $101.
- Conversely, the slowest single month of the year, typically falling within the low season, marks the market's lowest point. In this month, revenue might dip to $571, occupancy could drop to 24.2%, and ADRs may adjust down to $94.
- Understanding both the seasonal averages and these monthly peaks and troughs in revenue, occupancy, and ADR is crucial for maximizing your Airbnb profit potential in Bielle.
Seasonal Strategies for Maximizing Profit
- Peak Season: Maximize revenue through premium pricing and potentially longer minimum stays. Ensure high availability.
- Low Season: Offer competitive pricing, special promotions (e.g., extended stay discounts), and flexible cancellation policies. Target off-season travelers like remote workers or budget-conscious guests.
- Shoulder Seasons: Implement dynamic pricing that balances peak and low rates. Target weekend travelers or specific events. Offer slightly more flexible terms than peak season.
- Regularly analyze your own performance against these Bielle seasonality benchmarks and adjust your pricing and availability strategy accordingly.
Best Areas for Airbnb Investment in Bielle (2025)
Exploring the top neighborhoods for short-term rentals in Bielle? This section highlights key areas, outlining why they are attractive for hosts and guests, along with notable local attractions. Consider these locations based on your target guest profile and investment strategy.
| Neighborhood / Area | Why Host Here? (Target Guests & Appeal) | Key Attractions & Landmarks |
|---|---|---|
| City Center | The heart of Bielle, offering easy access to local shops, restaurants, and cultural attractions. Ideal for tourists looking to experience the vibrant local lifestyle. | Bielle Market, Local eateries, Cultural festivals, Art galleries, Historical sites |
| Parc de la Mairie | A picturesque park area that's perfect for families and nature lovers, attracting visitors for its green spaces and community events. | Children's playgrounds, Picnic areas, Walking trails, Community events |
| Cultural District | Home to several museums and theaters, this area attracts art and history enthusiasts, making it a prime spot for cultural tourism. | Musée de Bielle, Theatre Bielle, Cultural events, Art exhibitions |
| Riverside Area | The scenic riverside is perfect for outdoor activities and offers beautiful views, drawing in nature lovers and adventure seekers. | River walks, Kayaking, Fishing spots, Nature trails |
| Wine Country | Surrounded by vineyards, this area is perfect for wine tourism, attracting visitors looking for wine tastings and vineyard tours. | Vineyard tours, Wine tasting events, Local wine festivals |
| Historic Quarter | This area boasts beautiful historic architecture and charm, appealing to tourists interested in the history of Bielle and its surroundings. | Historic landmarks, Charming streets, Antique shops |
| Market Square | A vibrant area known for its local markets, food stalls, and lively atmosphere, making it a hotspot for food lovers and cultural experiences. | Weekly farmers markets, Street food, Craft fair events |
| Village of Bielle | A charming village offering a more relaxed pace of life, attracting visitors looking for tranquility and local culture. | Village festivals, Traditional architecture, Local cuisine |
Understanding Airbnb License Requirements & STR Laws in Bielle (2025)
While Bielle, Nouvelle-Aquitaine, France currently shows low STR regulations, specific Airbnb license requirements might still exist or change. Always verify the latest short term rental regulations and Airbnb license requirements directly with local government authorities for Bielle to ensure full compliance before hosting.
(Source: AirROI data, 2025, finding no licensed listings among those analyzed)
Top Performing Airbnb Properties in Bielle (2025)
Benchmark your potential! Explore examples of top-performing Airbnb properties in Biellebased on Trailing Twelve Month (TTM) revenue. Analyze their characteristics, revenue, occupancy rate, and ADR to understand what drives success in this market.

Gite de la Ferme de Maria Blanca
Entire Place • 5 bedrooms

Apartment 4 people and garden
Entire Place • 1 bedroom

Mountain house, Ossau Valley
Entire Place • 2 bedrooms
Souleih d'Ossau 202
Entire Place • 1 bedroom
La Suite Unique-Beautiful Garden View Closet Included
Entire Place • 1 bedroom

Laruns Apartment 2Chambres Vallee Ossau in Bielle
Entire Place • 2 bedrooms
Note: Performance varies based on location, size, amenities, seasonality, and management quality. Data reflects the past 12 months.
Top Performing Airbnb Hosts in Bielle (2025)
Learn from the best! This table showcases top-performing Airbnb hosts in Bielle based on the number of properties managed and estimated total revenue over the past year. Analyze their scale and performance metrics.
| Host Name | Properties | Grossing Revenue | Stay Reviews | Avg Rating |
|---|---|---|---|---|
| Kattalin | 1 | $26,570 | 14 | 4.93/5.0 |
| Antoine Et Elisa | 2 | $25,406 | 60 | 4.79/5.0 |
| Gabriel | 1 | $19,060 | 28 | 4.93/5.0 |
| Virginie | 1 | $18,683 | 51 | 4.71/5.0 |
| Xavier | 2 | $18,408 | 66 | 4.97/5.0 |
| Brigitte | 1 | $16,478 | 40 | 4.93/5.0 |
| Emmanuel | 1 | $16,420 | 7 | 5.00/5.0 |
| Marie Hélène | 1 | $14,533 | 32 | 4.88/5.0 |
| Valerie | 1 | $13,665 | 22 | 4.91/5.0 |
| Cedric | 1 | $13,646 | 10 | 4.80/5.0 |
Analyzing the strategies of top hosts, such as their property selection, pricing, and guest communication, can offer valuable lessons for optimizing your own Airbnb operations in Bielle.
Dive Deeper: Advanced Bielle STR Market Data (2025)
Ready to unlock more insights? AirROI provides access to advanced metrics and comprehensive Airbnb data for Bielle. Explore detailed analytics beyond this report to refine your investment strategy, optimize pricing, and maximize your vacation rental profits.
Explore Advanced MetricsBielle Short-Term Rental Market Composition (2025): Property & Room Types
Room Type Distribution
Property Type Distribution
Market Composition Insights for Bielle
- The Bielle Airbnb market composition is heavily skewed towards Entire Home/Apt listings, which make up 100% of the 25 active rentals. This indicates strong guest preference for privacy and space.
- Looking at the property type distribution in Bielle, Apartment/Condo properties are the most common (84%), reflecting the local real estate landscape.
- Houses represent a significant 16% portion, catering likely to families or larger groups.
Bielle Airbnb Room Capacity Analysis (2025): Bedroom Distribution
Distribution of Listings by Number of Bedrooms
Room Capacity Insights for Bielle
- The dominant room capacity in Bielle is 1 bedroom listings, making up 56% of the market. This suggests a strong demand for properties suitable for couples or solo travelers.
- Together, 1 bedroom and 2 bedrooms properties represent 80.0% of the active Airbnb listings in Bielle, indicating a high concentration in these sizes.
- With over half the market (56%) consisting of studios or 1-bedroom units, Bielle is particularly well-suited for individuals or couples.
Bielle Vacation Rental Guest Capacity Trends (2025)
Distribution of Listings by Guest Capacity
Guest Capacity Insights for Bielle
- The most common guest capacity trend in Bielle vacation rentals is listings accommodating 4 guests (60%). This suggests the primary traveler segment is likely small families or groups.
- Properties designed for 4 guests and 8+ guests dominate the Bielle STR market, accounting for 76.0% of listings.
- 20.0% of properties accommodate 6+ guests, serving the market segment for larger families or group travel in Bielle.
- On average, properties in Bielle are equipped to host 4.8 guests.
Bielle Airbnb Booking Patterns (2025): Available vs. Booked Days
Available Days Distribution
Booked Days Distribution
Booking Pattern Insights for Bielle
- The most common availability pattern in Bielle falls within the 271-366 days range, representing 44% of listings. This suggests many properties have significant open periods on their calendars.
- Approximately 68.0% of listings show high availability (181+ days open annually), indicating potential for increased bookings or specific owner usage patterns.
- For booked days, the 31-90 days range is most frequent in Bielle (36%), reflecting common guest stay durations or potential owner blocking patterns.
- A notable 32.0% of properties secure long booking periods (181+ days booked per year), highlighting successful long-term rental strategies or significant owner usage.
Bielle Airbnb Minimum Stay Requirements Analysis
Distribution of Listings by Minimum Night Requirement
1 Night
2 listings
8% of total
2 Nights
16 listings
64% of total
4-6 Nights
3 listings
12% of total
7-29 Nights
1 listings
4% of total
30+ Nights
3 listings
12% of total
Key Insights
- The most prevalent minimum stay requirement in Bielle is 2 Nights, adopted by 64% of listings. This highlights the market's preference for shorter, flexible bookings.
- A strong majority (72.0%) of the Bielle Airbnb data shows acceptance of very short stays (1-2 nights), indicating a dynamic, high-turnover market.
- A significant segment (12%) caters to monthly stays (30+ nights) in Bielle, pointing to opportunities in the extended-stay market.
Recommendations
- Align with the market by considering a 2 Nights minimum stay, as 64% of Bielle hosts use this setting.
- If feasible, allowing 1-night stays, especially midweek or during low season, could capture last-minute bookings, as only 8% currently do.
- A 2-night minimum appears standard (64%). Consider this for weekends or peak periods.
- Explore offering discounts for stays of 30+ nights to attract the 12% of the market seeking extended stays.
- Adjust minimum nights based on seasonality – potentially shorter during low season and longer during peak demand periods in Bielle.
Bielle Airbnb Cancellation Policy Trends Analysis (2025)
Flexible
6 listings
27.3% of total
Moderate
8 listings
36.4% of total
Firm
5 listings
22.7% of total
Strict
3 listings
13.6% of total
Cancellation Policy Insights for Bielle
- The prevailing Airbnb cancellation policy trend in Bielle is Moderate, used by 36.4% of listings.
- There's a relatively balanced mix between guest-friendly (63.7%) and stricter (36.3%) policies, offering choices for different guest needs.
Recommendations for Hosts
- Consider adopting a Moderate policy to align with the 36.4% market standard in Bielle.
- Using a Strict policy might deter some guests, as only 13.6% of listings use it. Evaluate if potential revenue protection outweighs possible lower booking rates.
- Regularly review your cancellation policy against competitors and market demand shifts in Bielle.
Bielle STR Booking Lead Time Analysis (2025)
Average Booking Lead Time by Month
Booking Lead Time Insights for Bielle
- The overall average booking lead time for vacation rentals in Bielle is 31 days.
- Guests book furthest in advance for stays during April (average 75 days), likely coinciding with peak travel demand or local events.
- The shortest booking windows occur for stays in February (average 17 days), indicating more last-minute travel plans during this time.
- Seasonally, Spring (55 days avg.) sees the longest lead times, while Winter (25 days avg.) has the shortest, reflecting typical travel planning cycles.
Recommendations for Hosts
- Use the overall average lead time (31 days) as a baseline for your pricing and availability strategy in Bielle.
- For April stays, consider implementing length-of-stay discounts or slightly higher rates for bookings made less than 75 days out to capitalize on advance planning.
- Target marketing efforts for the Spring season well in advance (at least 55 days) to capture early planners.
- Monitor your own booking lead times against these Bielle averages to identify opportunities for dynamic pricing adjustments.
Popular & Essential Airbnb Amenities in Bielle (2025)
Amenity Prevalence
Amenity Insights for Bielle
- Essential amenities in Bielle that guests expect include: Kitchen, Free parking on premises, Hangers, Heating, Clothing storage, Cleaning products, Hot water. Lacking these (any) could significantly impact bookings.
- Popular amenities like Dishes and silverware, Refrigerator, Hair dryer are common but not universal. Offering these can provide a competitive edge.
Recommendations for Hosts
- Ensure your listing includes all essential amenities for Bielle: Kitchen, Free parking on premises, Hangers, Heating, Clothing storage, Cleaning products, Hot water.
- Prioritize adding missing essentials: Clothing storage, Cleaning products, Hot water.
- Consider adding popular differentiators like Dishes and silverware or Refrigerator to increase appeal.
- Highlight unique or less common amenities you offer (e.g., hot tub, dedicated workspace, EV charger) in your listing description and photos.
- Regularly check competitor amenities in Bielle to stay competitive.
Bielle Airbnb Guest Demographics & Profile Analysis (2025)
Guest Profile Summary for Bielle
- The typical guest profile for Airbnb in Bielle consists of primarily domestic travelers (81%), often arriving from nearby Bordeaux, typically belonging to the Post-2000s (Gen Z/Alpha) group (50%), primarily speaking French or English.
- Domestic travelers account for 80.5% of guests.
- Key international markets include France (80.5%) and Spain (13.2%).
- Top languages spoken are French (41%) followed by English (31.1%).
- A significant demographic segment is the Post-2000s (Gen Z/Alpha) group, representing 50% of guests.
Recommendations for Hosts
- Target domestic marketing efforts towards travelers from Bordeaux and Toulouse.
- Tailor amenities and listing descriptions to appeal to the dominant Post-2000s (Gen Z/Alpha) demographic (e.g., highlight fast WiFi, smart home features, local guides).
- Highlight unique local experiences or amenities relevant to the primary guest profile.
- Consider seasonal promotions aligned with peak travel times for key origin markets.
Nearby Short-Term Rental Market Comparison
How does the Bielle Airbnb market stack up against its neighbors? Compare key performance metrics like average monthly revenue, ADR, and occupancy rates in surrounding areas to understand the broader regional STR landscape.
| Market | Active Properties | Monthly Revenue | Daily Rate | Avg. Occupancy |
|---|---|---|---|---|
| San Sebastián | 1,426 | $3,546 | $262.81 | 49% |
| Saint-Laurent-des-Combes | 11 | $3,526 | $706.18 | 23% |
| Astaffort | 10 | $3,393 | $314.20 | 35% |
| Cénac | 18 | $2,773 | $268.58 | 53% |
| Cérons | 11 | $2,635 | $196.16 | 39% |
| Galgon | 12 | $2,599 | $210.34 | 48% |
| Esteribar | 20 | $2,574 | $276.81 | 32% |
| Hernani | 11 | $2,572 | $345.16 | 40% |
| Eynesse | 14 | $2,564 | $282.87 | 36% |
| Azet | 13 | $2,500 | $245.55 | 43% |