Bidart Airbnb Market Analysis 2025: Short Term Rental Data & Vacation Rental Statistics in Nouvelle-Aquitaine, France
Is Airbnb profitable in Bidart in 2025? Explore comprehensive Airbnb analytics for Bidart, Nouvelle-Aquitaine, France to uncover income potential. This 2025 STR market report for Bidart, based on AirROI data from April 2024 to March 2025, reveals key trends in the market of 438 active listings.
Whether you're considering an Airbnb investment in Bidart, optimizing your existing vacation rental, or exploring rental arbitrage opportunities, understanding the Bidart Airbnb data is crucial. Navigating the high regulation landscape is key to maximizing your short term rental income potential. Let's dive into the specifics.
Key Bidart Airbnb Performance Metrics Overview
Monthly Airbnb Revenue Variations & Income Potential in Bidart (2025)
Understanding the monthly revenue variations for Airbnb listings in Bidart is key to maximizing your short term rental income potential. Seasonality significantly impacts earnings. Our analysis, based on data from the past 12 months, shows that the peak revenue month for STRs in Bidart is typically August, while February often presents the lowest earnings, highlighting opportunities for strategic pricing adjustments during shoulder and low seasons. Explore the typical Airbnb income in Bidart across different performance tiers:
- Best-in-class properties (Top 10%) achieve $4,992+ monthly, often utilizing dynamic pricing and superior guest experiences.
- Strong performing properties (Top 25%) earn $2,994 or more, indicating effective management and desirable locations/amenities.
- Typical properties (Median) generate around $1,756 per month, representing the average market performance.
- Entry-level properties (Bottom 25%) see earnings around $850, often with potential for optimization.
Average Monthly Airbnb Earnings Trend in Bidart
Bidart Airbnb Occupancy Rate Trends (2025)
Maximize your bookings by understanding the Bidart STR occupancy trends. Seasonal demand shifts significantly influence how often properties are booked. Typically, Augustsees the highest demand (peak season occupancy), while March experiences the lowest (low season). Effective strategies, like adjusting minimum stays or offering promotions, can boost occupancy during slower periods. Here's how different property tiers perform in Bidart:
- Best-in-class properties (Top 10%) achieve 82%+ occupancy, indicating high desirability and potentially optimized availability.
- Strong performing properties (Top 25%) maintain 62% or higher occupancy, suggesting good market fit and guest satisfaction.
- Typical properties (Median) have an occupancy rate around 39%.
- Entry-level properties (Bottom 25%) average 18% occupancy, potentially facing higher vacancy.
Average Monthly Occupancy Rate Trend in Bidart
Average Daily Rate (ADR) Airbnb Trends in Bidart (2025)
Effective short term rental pricing strategy in Bidart involves understanding monthly ADR fluctuations. The Average Daily Rate (ADR) for Airbnb in Bidart typically peaks in July and dips lowest during March. Leveraging Airbnb dynamic pricing tools or strategies based on this seasonality can significantly boost revenue. Here's a look at the typical nightly rates achieved:
- Best-in-class properties (Top 10%) command rates of $453+ per night, often due to premium features or locations.
- Strong performing properties (Top 25%) achieve nightly rates of $240 or more.
- Typical properties (Median) charge around $131 per night.
- Entry-level properties (Bottom 25%) earn around $93 per night.
Average Daily Rate (ADR) Trend by Month in Bidart
Get Live Bidart Market Intelligence 👇

Explore Real-time Analytics
Airbnb Seasonality Analysis & Trends in Bidart (2025)
Peak Season (August, July, June)
- Revenue averages $3,887 per month
- Occupancy rates average 56.6%
- Daily rates average $220
Shoulder Season
- Revenue averages $2,151 per month
- Occupancy maintains around 39.7%
- Daily rates hold near $204
Low Season (January, February, March)
- Revenue drops to average $1,266 per month
- Occupancy decreases to average 30.0%
- Daily rates adjust to average $191
Seasonality Insights for Bidart
- The Airbnb seasonality in Bidart shows highly seasonal trends requiring careful strategy. While the sections above show seasonal averages, it's also insightful to look at the extremes:
- During the high season, the absolute peak month showcases Bidart's highest earning potential, with monthly revenues capable of climbing to $4,700, occupancy reaching a high of 69.1%, and ADRs peaking at $224.
- Conversely, the slowest single month of the year, typically falling within the low season, marks the market's lowest point. In this month, revenue might dip to $1,143, occupancy could drop to 28.4%, and ADRs may adjust down to $189.
- Understanding both the seasonal averages and these monthly peaks and troughs in revenue, occupancy, and ADR is crucial for maximizing your Airbnb profit potential in Bidart.
Seasonal Strategies for Maximizing Profit
- Peak Season: Maximize revenue through premium pricing and potentially longer minimum stays. Ensure high availability.
- Low Season: Offer competitive pricing, special promotions (e.g., extended stay discounts), and flexible cancellation policies. Target off-season travelers like remote workers or budget-conscious guests.
- Shoulder Seasons: Implement dynamic pricing that balances peak and low rates. Target weekend travelers or specific events. Offer slightly more flexible terms than peak season.
- Regularly analyze your own performance against these Bidart seasonality benchmarks and adjust your pricing and availability strategy accordingly.
Best Areas for Airbnb Investment in Bidart (2025)
Exploring the top neighborhoods for short-term rentals in Bidart? This section highlights key areas, outlining why they are attractive for hosts and guests, along with notable local attractions. Consider these locations based on your target guest profile and investment strategy.
| Neighborhood / Area | Why Host Here? (Target Guests & Appeal) | Key Attractions & Landmarks |
|---|---|---|
| Central Bidart | The heart of Bidart, offering charming streets, local shops, and a traditional Basque atmosphere. It is ideally situated between the beach and the mountains, making it perfect for tourists. | Bidart Beach, Place de la mairie, Côte Basque, Château d'Ilbarritz, Basque cuisine restaurants |
| Bidart Beaches | This area features beautiful beaches that are popular for sunbathing, surfing, and enjoying the seaside. An attractive destination for families and beach lovers. | Plage de Bidart, Plage de Parlementia, Surf schools, Coastal walking paths, Beachfront cafes |
| La Plage de Erretegia | Known for its stunning views and less crowded atmosphere, it’s a great spot for those looking for a more tranquil beach experience just a short distance from the town. | Erretegia Beach, Stunning coastal views, Surfing spots, Walking trails, Nearby restaurants |
| Bidart Village | A quaint village atmosphere with picturesque streets and local markets. It offers a glimpse into traditional Basque life and is very appealing to tourists looking for authenticity. | Local artisan shops, Weekly markets, Traditional Basque architecture, Historic sites, Cultural events and festivals |
| L'Atelier du Chocolat | Ideal for food lovers, this area houses interactive chocolate workshops. It attracts tourists interested in culinary experiences and local products. | Chocolate workshops, Tasting sessions, Local sweet shops, Nearby artisanal products, Culinary events |
| Golf de Ilbarritz | A prime location for golf enthusiasts, this area features a beautiful 18-hole course with stunning views of the ocean, attracting tourists who enjoy golf and outdoor activities. | Golf course, Golf school, Stunning ocean views, Clubhouse dining, Pro shop |
| The Basque Coast Path | A scenic walking trail along the coast, ideal for nature lovers and tourists who enjoy outdoor activities and breathtaking views. | Stunning coastal views, Hiking trails, Nature observation, Access to local beaches, Historical landmarks along the path |
| Côte Basque Surf Spots | Known for its surf culture, this area attracts surfers from all over and offers a vibrant beach community vibe with plenty of surf schools and shops. | Surf schools, Rental shops, Surf competitions, Local surf culture, Vibrant beach life |
Understanding Airbnb License Requirements & STR Laws in Bidart (2025)
Yes, Bidart, Nouvelle-Aquitaine, France enforces high STR regulations. Obtaining a license and ensuring compliance is almost certainly required according to current 2025 STR laws. Always verify the latest short term rental regulations and Airbnb license requirements directly with local government authorities for Bidart to ensure full compliance before hosting.
(Source: AirROI data, 2025, based on 77% licensed listings)
Top Performing Airbnb Properties in Bidart (2025)
Benchmark your potential! Explore examples of top-performing Airbnb properties in Bidartbased on Trailing Twelve Month (TTM) revenue. Analyze their characteristics, revenue, occupancy rate, and ADR to understand what drives success in this market.

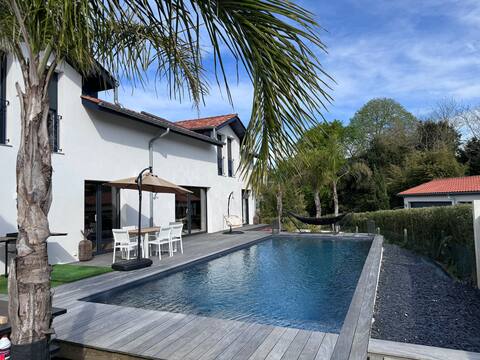
Large Basque farmhouse with pool, tennis & hot tub
Entire Place • 6 bedrooms
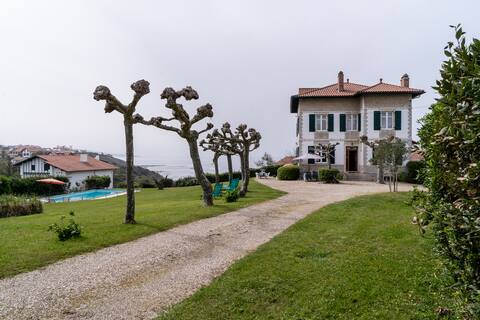
Villa Cosy Plage & Fireplace
Entire Place • 4 bedrooms
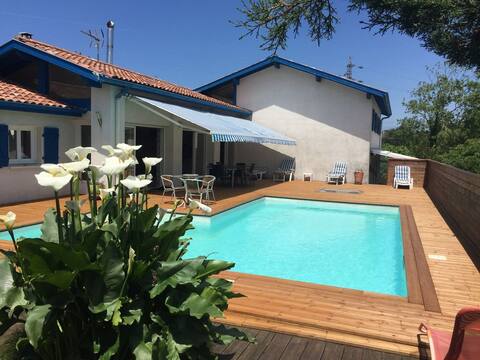
Beautiful, spacious, air conditioned home
Entire Place • 6 bedrooms
Pool Master House and Direct View Ocean -Bidart
Entire Place • 5 bedrooms

Old renovated farmhouse,pool, 900 m from the beach
Entire Place • 3 bedrooms
house for 14 personnes wtith hot pool and spa
Entire Place • 6 bedrooms
Note: Performance varies based on location, size, amenities, seasonality, and management quality. Data reflects the past 12 months.
Top Performing Airbnb Hosts in Bidart (2025)
Learn from the best! This table showcases top-performing Airbnb hosts in Bidart based on the number of properties managed and estimated total revenue over the past year. Analyze their scale and performance metrics.
| Host Name | Properties | Grossing Revenue | Stay Reviews | Avg Rating |
|---|---|---|---|---|
| Ann | 4 | $180,391 | 160 | 4.98/5.0 |
| Melanie | 3 | $164,274 | 27 | 5.00/5.0 |
| Sophie - Interhome Group | 12 | $161,486 | 96 | 3.16/5.0 |
| Jérémie | 5 | $136,166 | 61 | 4.61/5.0 |
| Benjamin | 1 | $134,207 | 20 | 5.00/5.0 |
| Raphaelle | 5 | $129,622 | 134 | 4.85/5.0 |
| Xavier | 1 | $125,963 | 33 | 5.00/5.0 |
| Marine Et Valérie | 4 | $118,196 | 60 | 4.89/5.0 |
| Miren | 2 | $103,926 | 57 | 4.96/5.0 |
| Sophie | 4 | $102,866 | 41 | 3.43/5.0 |
Analyzing the strategies of top hosts, such as their property selection, pricing, and guest communication, can offer valuable lessons for optimizing your own Airbnb operations in Bidart.
Dive Deeper: Advanced Bidart STR Market Data (2025)
Ready to unlock more insights? AirROI provides access to advanced metrics and comprehensive Airbnb data for Bidart. Explore detailed analytics beyond this report to refine your investment strategy, optimize pricing, and maximize your vacation rental profits.
Explore Advanced MetricsBidart Short-Term Rental Market Composition (2025): Property & Room Types
Room Type Distribution
Property Type Distribution
Market Composition Insights for Bidart
- The Bidart Airbnb market composition is heavily skewed towards Entire Home/Apt listings, which make up 88.8% of the 438 active rentals. This indicates strong guest preference for privacy and space.
- Looking at the property type distribution in Bidart, Apartment/Condo properties are the most common (56.6%), reflecting the local real estate landscape.
- Houses represent a significant 34.2% portion, catering likely to families or larger groups.
- The presence of 8% Hotel/Boutique listings indicates integration with traditional hospitality.
- Smaller segments like others, unique stays (combined 1.1%) offer potential for unique stay experiences.
Bidart Airbnb Room Capacity Analysis (2025): Bedroom Distribution
Distribution of Listings by Number of Bedrooms
Room Capacity Insights for Bidart
- The dominant room capacity in Bidart is 1 bedroom listings, making up 38.6% of the market. This suggests a strong demand for properties suitable for couples or solo travelers.
- Together, 1 bedroom and 2 bedrooms properties represent 58.0% of the active Airbnb listings in Bidart, indicating a high concentration in these sizes.
- A significant 29.9% of listings offer 3+ bedrooms, catering to larger groups and families seeking more space in Bidart.
Bidart Vacation Rental Guest Capacity Trends (2025)
Distribution of Listings by Guest Capacity
Guest Capacity Insights for Bidart
- The most common guest capacity trend in Bidart vacation rentals is listings accommodating 4 guests (29.5%). This suggests the primary traveler segment is likely small families or groups.
- Properties designed for 4 guests and 2 guests dominate the Bidart STR market, accounting for 52.1% of listings.
- 31.5% of properties accommodate 6+ guests, serving the market segment for larger families or group travel in Bidart.
- On average, properties in Bidart are equipped to host 4.2 guests.
Bidart Airbnb Booking Patterns (2025): Available vs. Booked Days
Available Days Distribution
Booked Days Distribution
Booking Pattern Insights for Bidart
- The most common availability pattern in Bidart falls within the 271-366 days range, representing 53.2% of listings. This suggests many properties have significant open periods on their calendars.
- Approximately 85.4% of listings show high availability (181+ days open annually), indicating potential for increased bookings or specific owner usage patterns.
- For booked days, the 91-180 days range is most frequent in Bidart (34.7%), reflecting common guest stay durations or potential owner blocking patterns.
- A notable 15.3% of properties secure long booking periods (181+ days booked per year), highlighting successful long-term rental strategies or significant owner usage.
Bidart Airbnb Minimum Stay Requirements Analysis
Distribution of Listings by Minimum Night Requirement
1 Night
47 listings
11.5% of total
2 Nights
94 listings
23% of total
3 Nights
51 listings
12.5% of total
4-6 Nights
95 listings
23.2% of total
7-29 Nights
80 listings
19.6% of total
30+ Nights
42 listings
10.3% of total
Key Insights
- The most prevalent minimum stay requirement in Bidart is 4-6 Nights, adopted by 23.2% of listings. This highlights the market's preference for longer commitments.
- A significant segment (10.3%) caters to monthly stays (30+ nights) in Bidart, pointing to opportunities in the extended-stay market.
Recommendations
- Align with the market by considering a 4-6 Nights minimum stay, as 23.2% of Bidart hosts use this setting.
- If feasible, allowing 1-night stays, especially midweek or during low season, could capture last-minute bookings, as only 11.5% currently do.
- Explore offering discounts for stays of 30+ nights to attract the 10.3% of the market seeking extended stays.
- Adjust minimum nights based on seasonality – potentially shorter during low season and longer during peak demand periods in Bidart.
Bidart Airbnb Cancellation Policy Trends Analysis (2025)
Non-refundable
3 listings
0.8% of total
Refundable
2 listings
0.5% of total
Super Strict 30 Days
7 listings
1.8% of total
Super Strict 60 Days
3 listings
0.8% of total
Flexible
63 listings
16.2% of total
Moderate
65 listings
16.7% of total
Firm
83 listings
21.3% of total
Strict
163 listings
41.9% of total
Cancellation Policy Insights for Bidart
- The prevailing Airbnb cancellation policy trend in Bidart is Strict, used by 41.9% of listings.
- A majority (63.2%) of hosts in Bidart utilize Firm or Strict policies, indicating a market where hosts prioritize booking security.
Recommendations for Hosts
- Consider adopting a Strict policy to align with the 41.9% market standard in Bidart.
- With 41.9% using Strict terms, this is a viable option in Bidart, particularly for high-value properties or during peak demand periods.
- Regularly review your cancellation policy against competitors and market demand shifts in Bidart.
Bidart STR Booking Lead Time Analysis (2025)
Average Booking Lead Time by Month
Booking Lead Time Insights for Bidart
- The overall average booking lead time for vacation rentals in Bidart is 71 days.
- Guests book furthest in advance for stays during June (average 99 days), likely coinciding with peak travel demand or local events.
- The shortest booking windows occur for stays in March (average 35 days), indicating more last-minute travel plans during this time.
- Seasonally, Summer (96 days avg.) sees the longest lead times, while Winter (42 days avg.) has the shortest, reflecting typical travel planning cycles.
Recommendations for Hosts
- Use the overall average lead time (71 days) as a baseline for your pricing and availability strategy in Bidart.
- For June stays, consider implementing length-of-stay discounts or slightly higher rates for bookings made less than 99 days out to capitalize on advance planning.
- Target marketing efforts for the Summer season well in advance (at least 96 days) to capture early planners.
- Monitor your own booking lead times against these Bidart averages to identify opportunities for dynamic pricing adjustments.
Popular & Essential Airbnb Amenities in Bidart (2025)
Amenity Prevalence
Amenity Insights for Bidart
- Popular amenities like Free parking on premises, Heating, Hot water are common but not universal. Offering these can provide a competitive edge.
- Warning: Wifi is not universally provided but is considered essential globally. Ensure reliable Wifi is offered.
Recommendations for Hosts
- Consider adding popular differentiators like Free parking on premises or Heating to increase appeal.
- Highlight unique or less common amenities you offer (e.g., hot tub, dedicated workspace, EV charger) in your listing description and photos.
- Regularly check competitor amenities in Bidart to stay competitive.
Bidart Airbnb Guest Demographics & Profile Analysis (2025)
Guest Profile Summary for Bidart
- The typical guest profile for Airbnb in Bidart consists of primarily domestic travelers (75%), often arriving from nearby Paris, typically belonging to the Post-2000s (Gen Z/Alpha) group (50%), primarily speaking French or English.
- Domestic travelers account for 75.1% of guests.
- Key international markets include France (75.1%) and Germany (4.5%).
- Top languages spoken are French (36.7%) followed by English (35%).
- A significant demographic segment is the Post-2000s (Gen Z/Alpha) group, representing 50% of guests.
Recommendations for Hosts
- Target domestic marketing efforts towards travelers from Paris and Toulouse.
- Tailor amenities and listing descriptions to appeal to the dominant Post-2000s (Gen Z/Alpha) demographic (e.g., highlight fast WiFi, smart home features, local guides).
- Highlight unique local experiences or amenities relevant to the primary guest profile.
- Consider seasonal promotions aligned with peak travel times for key origin markets.
Nearby Short-Term Rental Market Comparison
How does the Bidart Airbnb market stack up against its neighbors? Compare key performance metrics like average monthly revenue, ADR, and occupancy rates in surrounding areas to understand the broader regional STR landscape.
| Market | Active Properties | Monthly Revenue | Daily Rate | Avg. Occupancy |
|---|---|---|---|---|
| San Sebastián | 1,426 | $3,546 | $262.81 | 49% |
| Saint-Laurent-des-Combes | 11 | $3,526 | $706.18 | 23% |
| Gautegiz Arteaga | 21 | $2,865 | $293.66 | 38% |
| Cénac | 18 | $2,773 | $268.58 | 53% |
| Labastida/Bastida | 11 | $2,662 | $268.80 | 34% |
| Cérons | 11 | $2,635 | $196.16 | 39% |
| Barrika | 13 | $2,629 | $314.61 | 41% |
| Galgon | 12 | $2,599 | $210.34 | 48% |
| Esteribar | 20 | $2,574 | $276.81 | 32% |
| Hernani | 11 | $2,572 | $345.16 | 40% |