Beynac-et-Cazenac Airbnb Market Analysis 2025: Short Term Rental Data & Vacation Rental Statistics in Nouvelle-Aquitaine, France
Is Airbnb profitable in Beynac-et-Cazenac in 2025? Explore comprehensive Airbnb analytics for Beynac-et-Cazenac, Nouvelle-Aquitaine, France to uncover income potential. This 2025 STR market report for Beynac-et-Cazenac, based on AirROI data from April 2024 to March 2025, reveals key trends in the niche market of 68 active listings.
Whether you're considering an Airbnb investment in Beynac-et-Cazenac, optimizing your existing vacation rental, or exploring rental arbitrage opportunities, understanding the Beynac-et-Cazenac Airbnb data is crucial. Understanding the local regulations is key to maximizing your short term rental income potential. Let's dive into the specifics.
Key Beynac-et-Cazenac Airbnb Performance Metrics Overview
Monthly Airbnb Revenue Variations & Income Potential in Beynac-et-Cazenac (2025)
Understanding the monthly revenue variations for Airbnb listings in Beynac-et-Cazenac is key to maximizing your short term rental income potential. Seasonality significantly impacts earnings. Our analysis, based on data from the past 12 months, shows that the peak revenue month for STRs in Beynac-et-Cazenac is typically August, while November often presents the lowest earnings, highlighting opportunities for strategic pricing adjustments during shoulder and low seasons. Explore the typical Airbnb income in Beynac-et-Cazenac across different performance tiers:
- Best-in-class properties (Top 10%) achieve $6,719+ monthly, often utilizing dynamic pricing and superior guest experiences.
- Strong performing properties (Top 25%) earn $3,536 or more, indicating effective management and desirable locations/amenities.
- Typical properties (Median) generate around $1,659 per month, representing the average market performance.
- Entry-level properties (Bottom 25%) see earnings around $782, often with potential for optimization.
Average Monthly Airbnb Earnings Trend in Beynac-et-Cazenac
Beynac-et-Cazenac Airbnb Occupancy Rate Trends (2025)
Maximize your bookings by understanding the Beynac-et-Cazenac STR occupancy trends. Seasonal demand shifts significantly influence how often properties are booked. Typically, Augustsees the highest demand (peak season occupancy), while March experiences the lowest (low season). Effective strategies, like adjusting minimum stays or offering promotions, can boost occupancy during slower periods. Here's how different property tiers perform in Beynac-et-Cazenac:
- Best-in-class properties (Top 10%) achieve 85%+ occupancy, indicating high desirability and potentially optimized availability.
- Strong performing properties (Top 25%) maintain 57% or higher occupancy, suggesting good market fit and guest satisfaction.
- Typical properties (Median) have an occupancy rate around 34%.
- Entry-level properties (Bottom 25%) average 18% occupancy, potentially facing higher vacancy.
Average Monthly Occupancy Rate Trend in Beynac-et-Cazenac
Average Daily Rate (ADR) Airbnb Trends in Beynac-et-Cazenac (2025)
Effective short term rental pricing strategy in Beynac-et-Cazenac involves understanding monthly ADR fluctuations. The Average Daily Rate (ADR) for Airbnb in Beynac-et-Cazenac typically peaks in July and dips lowest during February. Leveraging Airbnb dynamic pricing tools or strategies based on this seasonality can significantly boost revenue. Here's a look at the typical nightly rates achieved:
- Best-in-class properties (Top 10%) command rates of $323+ per night, often due to premium features or locations.
- Strong performing properties (Top 25%) achieve nightly rates of $212 or more.
- Typical properties (Median) charge around $142 per night.
- Entry-level properties (Bottom 25%) earn around $107 per night.
Average Daily Rate (ADR) Trend by Month in Beynac-et-Cazenac
Get Live Beynac-et-Cazenac Market Intelligence 👇

Explore Real-time Analytics
Airbnb Seasonality Analysis & Trends in Beynac-et-Cazenac (2025)
Peak Season (August, July, June)
- Revenue averages $4,122 per month
- Occupancy rates average 54.9%
- Daily rates average $204
Shoulder Season
- Revenue averages $2,619 per month
- Occupancy maintains around 37.6%
- Daily rates hold near $184
Low Season (February, March, November)
- Revenue drops to average $1,717 per month
- Occupancy decreases to average 30.3%
- Daily rates adjust to average $176
Seasonality Insights for Beynac-et-Cazenac
- The Airbnb seasonality in Beynac-et-Cazenac shows highly seasonal trends requiring careful strategy. While the sections above show seasonal averages, it's also insightful to look at the extremes:
- During the high season, the absolute peak month showcases Beynac-et-Cazenac's highest earning potential, with monthly revenues capable of climbing to $4,871, occupancy reaching a high of 70.6%, and ADRs peaking at $209.
- Conversely, the slowest single month of the year, typically falling within the low season, marks the market's lowest point. In this month, revenue might dip to $1,625, occupancy could drop to 26.6%, and ADRs may adjust down to $173.
- Understanding both the seasonal averages and these monthly peaks and troughs in revenue, occupancy, and ADR is crucial for maximizing your Airbnb profit potential in Beynac-et-Cazenac.
Seasonal Strategies for Maximizing Profit
- Peak Season: Maximize revenue through premium pricing and potentially longer minimum stays. Ensure high availability.
- Low Season: Offer competitive pricing, special promotions (e.g., extended stay discounts), and flexible cancellation policies. Target off-season travelers like remote workers or budget-conscious guests.
- Shoulder Seasons: Implement dynamic pricing that balances peak and low rates. Target weekend travelers or specific events. Offer slightly more flexible terms than peak season.
- Regularly analyze your own performance against these Beynac-et-Cazenac seasonality benchmarks and adjust your pricing and availability strategy accordingly.
Best Areas for Airbnb Investment in Beynac-et-Cazenac (2025)
Exploring the top neighborhoods for short-term rentals in Beynac-et-Cazenac? This section highlights key areas, outlining why they are attractive for hosts and guests, along with notable local attractions. Consider these locations based on your target guest profile and investment strategy.
| Neighborhood / Area | Why Host Here? (Target Guests & Appeal) | Key Attractions & Landmarks |
|---|---|---|
| Beynac Castle | A historical site offering stunning views of the Dordogne River and the surrounding countryside. Popular among tourists for its medieval architecture and picturesque scenery. | Beynac Castle, Dordogne River Views, Canoeing on the Dordogne, Medieval village, Gardens of Marqueyssac |
| La Roque-Gageac | A beautiful village perched alongside the cliffs of the Dordogne River. Rich in beauty and history, making it a sought-after location for visitors. | La Roque-Gageac village, Breathtaking river views, Botanical Gardens, Château de la Malartrie, Kayaking |
| Domme | Classified as one of the 'Les Plus Beaux Villages de France', its fortified buildings and views attract many tourists, making it an ideal location for Airbnb hosting. | Domme village, Viewpoint over the Dordogne, Domme's caves, Historic architecture, Shops and restaurants |
| Sarlat-la-Canéda | Renowned for its well-preserved medieval town center, filled with markets and festivals. A hub for culture and tourism, ideal for Airbnb investment. | Sarlat Market, Sarlat Cathedral, Historical buildings, Cultural festivals, Truffles and cuisine |
| Castelnaud-la-Chapelle | Home to a famous medieval castle and picturesque views, suitable for tourists interested in history and outdoors. | Château de Castelnaud, Dordogne River views, Hiking trails, Canoeing, History museums |
| Lartigues | Friendly village atmosphere with local charm. Peaceful setting for tourists looking to escape the city, making it a favorable location for vacation rentals. | Lartigues Village, Local vineyards, Scenic countryside, Nature walks, Farmers markets |
| Vezac | Another beautiful village near Beynac, known for its serene landscapes and proximity to attractions, making it an ideal location for those looking for tranquility. | Vezac gardens, Scenery along the Dordogne, Local artisan shops, Cycling paths, Historic architecture |
| Les Eyzies-de-Tayac | Considered the capital of prehistory, it draws history enthusiasts and families, making it great for Airbnb investors looking to attract niche markets. | National Prehistoric Museum, Cave dwellings, Lascaux Caves nearby, Historic sites, Nature reserves |
Understanding Airbnb License Requirements & STR Laws in Beynac-et-Cazenac (2025)
With 19% of listings showing registration in 2025, understanding potential Airbnb license requirements is crucial in Beynac-et-Cazenac. Always verify the latest short term rental regulations and Airbnb license requirements directly with local government authorities for Beynac-et-Cazenac to ensure full compliance before hosting.
(Source: AirROI data, 2025, based on 19% licensed listings)
Top Performing Airbnb Properties in Beynac-et-Cazenac (2025)
Benchmark your potential! Explore examples of top-performing Airbnb properties in Beynac-et-Cazenacbased on Trailing Twelve Month (TTM) revenue. Analyze their characteristics, revenue, occupancy rate, and ADR to understand what drives success in this market.
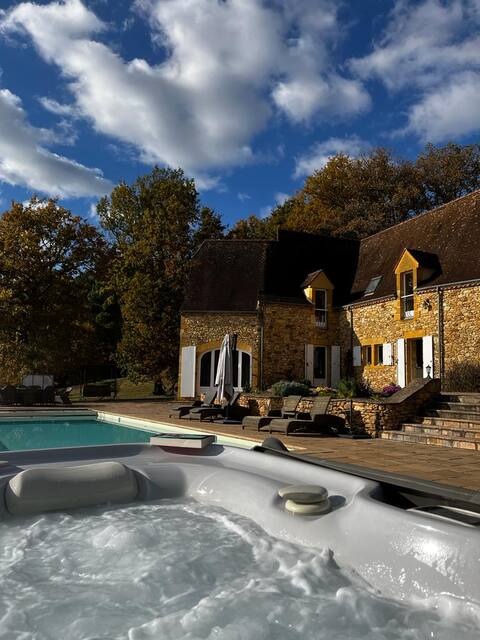
Luxury secluded Chateau with hot tub & pool
Entire Place • 5 bedrooms
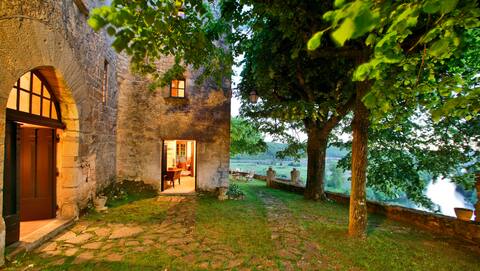
MAGNIFICIENT MANOR HOUSE WITH EXCEPTIONAL VIEWS
Entire Place • 6 bedrooms

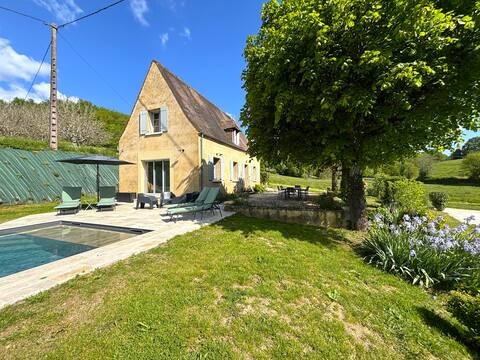
New Listing! Maison Delluc with Spectacular Vistas
Entire Place • 3 bedrooms
Charm and Absolute Romanticism in the heart of Beynac
Entire Place • 2 bedrooms

Million Euro View-Villa Mont Joie
Entire Place • 3 bedrooms
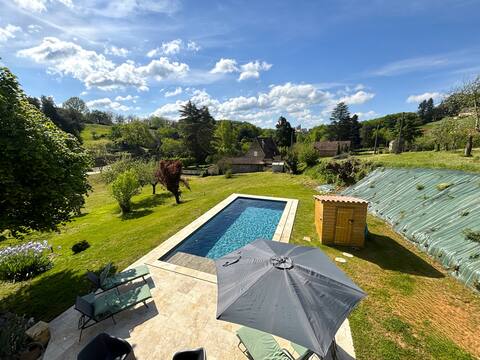
Charming home with heated pool in Beynac
Entire Place • 4 bedrooms
Note: Performance varies based on location, size, amenities, seasonality, and management quality. Data reflects the past 12 months.
Top Performing Airbnb Hosts in Beynac-et-Cazenac (2025)
Learn from the best! This table showcases top-performing Airbnb hosts in Beynac-et-Cazenac based on the number of properties managed and estimated total revenue over the past year. Analyze their scale and performance metrics.
| Host Name | Properties | Grossing Revenue | Stay Reviews | Avg Rating |
|---|---|---|---|---|
| Sabine | 6 | $328,481 | 56 | 4.66/5.0 |
| Vincent | 3 | $193,496 | 131 | 4.98/5.0 |
| Julian | 1 | $161,661 | 101 | 4.90/5.0 |
| Geneviève | 15 | $150,294 | 190 | 3.69/5.0 |
| Frédérique | 4 | $66,441 | 268 | 4.79/5.0 |
| Jocelyne - Emilie & Gregoire | 8 | $59,798 | 598 | 4.70/5.0 |
| Didier | 2 | $54,171 | 27 | 4.86/5.0 |
| Liz And Matt | 1 | $51,191 | 22 | 4.91/5.0 |
| Pierre-Adrien Marie Gérard | 1 | $50,253 | 8 | 4.88/5.0 |
| Claire Et Marie Laure | 2 | $46,387 | 30 | 4.71/5.0 |
Analyzing the strategies of top hosts, such as their property selection, pricing, and guest communication, can offer valuable lessons for optimizing your own Airbnb operations in Beynac-et-Cazenac.
Dive Deeper: Advanced Beynac-et-Cazenac STR Market Data (2025)
Ready to unlock more insights? AirROI provides access to advanced metrics and comprehensive Airbnb data for Beynac-et-Cazenac. Explore detailed analytics beyond this report to refine your investment strategy, optimize pricing, and maximize your vacation rental profits.
Explore Advanced MetricsBeynac-et-Cazenac Short-Term Rental Market Composition (2025): Property & Room Types
Room Type Distribution
Property Type Distribution
Market Composition Insights for Beynac-et-Cazenac
- The Beynac-et-Cazenac Airbnb market composition is heavily skewed towards Entire Home/Apt listings, which make up 83.8% of the 68 active rentals. This indicates strong guest preference for privacy and space.
- Looking at the property type distribution in Beynac-et-Cazenac, House properties are the most common (70.6%), reflecting the local real estate landscape.
- Houses represent a significant 70.6% portion, catering likely to families or larger groups.
- The presence of 8.8% Hotel/Boutique listings indicates integration with traditional hospitality.
- Smaller segments like outdoor/unique, unique stays, others (combined 5.9%) offer potential for unique stay experiences.
Beynac-et-Cazenac Airbnb Room Capacity Analysis (2025): Bedroom Distribution
Distribution of Listings by Number of Bedrooms
Room Capacity Insights for Beynac-et-Cazenac
- The dominant room capacity in Beynac-et-Cazenac is 1 bedroom listings, making up 29.4% of the market. This suggests a strong demand for properties suitable for couples or solo travelers.
- Together, 1 bedroom and 3 bedrooms properties represent 51.5% of the active Airbnb listings in Beynac-et-Cazenac, indicating a high concentration in these sizes.
- A significant 36.9% of listings offer 3+ bedrooms, catering to larger groups and families seeking more space in Beynac-et-Cazenac.
Beynac-et-Cazenac Vacation Rental Guest Capacity Trends (2025)
Distribution of Listings by Guest Capacity
Guest Capacity Insights for Beynac-et-Cazenac
- The most common guest capacity trend in Beynac-et-Cazenac vacation rentals is listings accommodating 6 guests (17.6%). This suggests the primary traveler segment is likely larger groups.
- Properties designed for 6 guests and 2 guests dominate the Beynac-et-Cazenac STR market, accounting for 33.8% of listings.
- 36.7% of properties accommodate 6+ guests, serving the market segment for larger families or group travel in Beynac-et-Cazenac.
- On average, properties in Beynac-et-Cazenac are equipped to host 4.3 guests.
Beynac-et-Cazenac Airbnb Booking Patterns (2025): Available vs. Booked Days
Available Days Distribution
Booked Days Distribution
Booking Pattern Insights for Beynac-et-Cazenac
- The most common availability pattern in Beynac-et-Cazenac falls within the 271-366 days range, representing 54.4% of listings. This suggests many properties have significant open periods on their calendars.
- Approximately 82.3% of listings show high availability (181+ days open annually), indicating potential for increased bookings or specific owner usage patterns.
- For booked days, the 91-180 days range is most frequent in Beynac-et-Cazenac (32.4%), reflecting common guest stay durations or potential owner blocking patterns.
- A notable 19.1% of properties secure long booking periods (181+ days booked per year), highlighting successful long-term rental strategies or significant owner usage.
Beynac-et-Cazenac Airbnb Minimum Stay Requirements Analysis
Distribution of Listings by Minimum Night Requirement
1 Night
3 listings
4.5% of total
2 Nights
13 listings
19.4% of total
3 Nights
12 listings
17.9% of total
4-6 Nights
29 listings
43.3% of total
7-29 Nights
8 listings
11.9% of total
30+ Nights
2 listings
3% of total
Key Insights
- The most prevalent minimum stay requirement in Beynac-et-Cazenac is 4-6 Nights, adopted by 43.3% of listings. This highlights the market's preference for longer commitments.
Recommendations
- Align with the market by considering a 4-6 Nights minimum stay, as 43.3% of Beynac-et-Cazenac hosts use this setting.
- If feasible, allowing 1-night stays, especially midweek or during low season, could capture last-minute bookings, as only 4.5% currently do.
- Adjust minimum nights based on seasonality – potentially shorter during low season and longer during peak demand periods in Beynac-et-Cazenac.
Beynac-et-Cazenac Airbnb Cancellation Policy Trends Analysis (2025)
Refundable
8 listings
13.1% of total
Non-refundable
4 listings
6.6% of total
Super Strict 60 Days
1 listings
1.6% of total
Flexible
7 listings
11.5% of total
Moderate
5 listings
8.2% of total
Firm
15 listings
24.6% of total
Strict
21 listings
34.4% of total
Cancellation Policy Insights for Beynac-et-Cazenac
- The prevailing Airbnb cancellation policy trend in Beynac-et-Cazenac is Strict, used by 34.4% of listings.
- A majority (59.0%) of hosts in Beynac-et-Cazenac utilize Firm or Strict policies, indicating a market where hosts prioritize booking security.
Recommendations for Hosts
- Consider adopting a Strict policy to align with the 34.4% market standard in Beynac-et-Cazenac.
- With 34.4% using Strict terms, this is a viable option in Beynac-et-Cazenac, particularly for high-value properties or during peak demand periods.
- Regularly review your cancellation policy against competitors and market demand shifts in Beynac-et-Cazenac.
Beynac-et-Cazenac STR Booking Lead Time Analysis (2025)
Average Booking Lead Time by Month
Booking Lead Time Insights for Beynac-et-Cazenac
- The overall average booking lead time for vacation rentals in Beynac-et-Cazenac is 75 days.
- Guests book furthest in advance for stays during June (average 133 days), likely coinciding with peak travel demand or local events.
- The shortest booking windows occur for stays in December (average 51 days), indicating more last-minute travel plans during this time.
- Seasonally, Summer (114 days avg.) sees the longest lead times, while Spring (72 days avg.) has the shortest, reflecting typical travel planning cycles.
Recommendations for Hosts
- Use the overall average lead time (75 days) as a baseline for your pricing and availability strategy in Beynac-et-Cazenac.
- For June stays, consider implementing length-of-stay discounts or slightly higher rates for bookings made less than 133 days out to capitalize on advance planning.
- Target marketing efforts for the Summer season well in advance (at least 114 days) to capture early planners.
- Monitor your own booking lead times against these Beynac-et-Cazenac averages to identify opportunities for dynamic pricing adjustments.
Popular & Essential Airbnb Amenities in Beynac-et-Cazenac (2025)
Amenity Prevalence
Amenity Insights for Beynac-et-Cazenac
- Essential amenities in Beynac-et-Cazenac that guests expect include: Heating, Kitchen. Lacking these (any) could significantly impact bookings.
- Popular amenities like Wifi, Refrigerator, Dishes and silverware are common but not universal. Offering these can provide a competitive edge.
- Warning: Wifi is not universally provided but is considered essential globally. Ensure reliable Wifi is offered.
Recommendations for Hosts
- Ensure your listing includes all essential amenities for Beynac-et-Cazenac: Heating, Kitchen.
- Prioritize adding missing essentials: Heating, Kitchen.
- Consider adding popular differentiators like Wifi or Refrigerator to increase appeal.
- Highlight unique or less common amenities you offer (e.g., hot tub, dedicated workspace, EV charger) in your listing description and photos.
- Regularly check competitor amenities in Beynac-et-Cazenac to stay competitive.
Beynac-et-Cazenac Airbnb Guest Demographics & Profile Analysis (2025)
Guest Profile Summary for Beynac-et-Cazenac
- The typical guest profile for Airbnb in Beynac-et-Cazenac consists of a mix of domestic (58%) and international guests, often arriving from nearby Paris, typically belonging to the Post-2000s (Gen Z/Alpha) group (50%), primarily speaking English or French.
- Domestic travelers account for 58.2% of guests.
- Key international markets include France (58.2%) and United Kingdom (15.1%).
- Top languages spoken are English (38.2%) followed by French (38.2%).
- A significant demographic segment is the Post-2000s (Gen Z/Alpha) group, representing 50% of guests.
Recommendations for Hosts
- Balance marketing efforts between domestic and international channels based on the guest mix.
- Tailor amenities and listing descriptions to appeal to the dominant Post-2000s (Gen Z/Alpha) demographic (e.g., highlight fast WiFi, smart home features, local guides).
- Highlight unique local experiences or amenities relevant to the primary guest profile.
- Consider seasonal promotions aligned with peak travel times for key origin markets.
Nearby Short-Term Rental Market Comparison
How does the Beynac-et-Cazenac Airbnb market stack up against its neighbors? Compare key performance metrics like average monthly revenue, ADR, and occupancy rates in surrounding areas to understand the broader regional STR landscape.
| Market | Active Properties | Monthly Revenue | Daily Rate | Avg. Occupancy |
|---|---|---|---|---|
| Astaffort | 10 | $3,393 | $314.20 | 35% |
| Saint-Pierre-Roche | 11 | $2,627 | $166.21 | 48% |
| Eynesse | 14 | $2,564 | $282.87 | 36% |
| Bourrou | 10 | $2,475 | $247.57 | 36% |
| Saint-Jean-d'Alcapiès | 10 | $2,429 | $169.43 | 43% |
| Jayac | 11 | $2,388 | $202.75 | 40% |
| La Magdelaine-sur-Tarn | 10 | $2,383 | $243.17 | 32% |
| Lanta | 14 | $2,306 | $270.81 | 44% |
| Pont-de-Larn | 17 | $2,254 | $239.90 | 32% |
| Gout-Rossignol | 11 | $2,212 | $251.86 | 38% |