Belin-Béliet Airbnb Market Analysis 2025: Short Term Rental Data & Vacation Rental Statistics in Nouvelle-Aquitaine, France
Is Airbnb profitable in Belin-Béliet in 2025? Explore comprehensive Airbnb analytics for Belin-Béliet, Nouvelle-Aquitaine, France to uncover income potential. This 2025 STR market report for Belin-Béliet, based on AirROI data from April 2024 to March 2025, reveals key trends in the niche market of 49 active listings.
Whether you're considering an Airbnb investment in Belin-Béliet, optimizing your existing vacation rental, or exploring rental arbitrage opportunities, understanding the Belin-Béliet Airbnb data is crucial. Leveraging the low regulation environment is key to maximizing your short term rental income potential. Let's dive into the specifics.
Key Belin-Béliet Airbnb Performance Metrics Overview
Monthly Airbnb Revenue Variations & Income Potential in Belin-Béliet (2025)
Understanding the monthly revenue variations for Airbnb listings in Belin-Béliet is key to maximizing your short term rental income potential. Seasonality significantly impacts earnings. Our analysis, based on data from the past 12 months, shows that the peak revenue month for STRs in Belin-Béliet is typically August, while February often presents the lowest earnings, highlighting opportunities for strategic pricing adjustments during shoulder and low seasons. Explore the typical Airbnb income in Belin-Béliet across different performance tiers:
- Best-in-class properties (Top 10%) achieve $4,129+ monthly, often utilizing dynamic pricing and superior guest experiences.
- Strong performing properties (Top 25%) earn $2,396 or more, indicating effective management and desirable locations/amenities.
- Typical properties (Median) generate around $1,227 per month, representing the average market performance.
- Entry-level properties (Bottom 25%) see earnings around $737, often with potential for optimization.
Average Monthly Airbnb Earnings Trend in Belin-Béliet
Belin-Béliet Airbnb Occupancy Rate Trends (2025)
Maximize your bookings by understanding the Belin-Béliet STR occupancy trends. Seasonal demand shifts significantly influence how often properties are booked. Typically, Augustsees the highest demand (peak season occupancy), while January experiences the lowest (low season). Effective strategies, like adjusting minimum stays or offering promotions, can boost occupancy during slower periods. Here's how different property tiers perform in Belin-Béliet:
- Best-in-class properties (Top 10%) achieve 74%+ occupancy, indicating high desirability and potentially optimized availability.
- Strong performing properties (Top 25%) maintain 52% or higher occupancy, suggesting good market fit and guest satisfaction.
- Typical properties (Median) have an occupancy rate around 34%.
- Entry-level properties (Bottom 25%) average 19% occupancy, potentially facing higher vacancy.
Average Monthly Occupancy Rate Trend in Belin-Béliet
Average Daily Rate (ADR) Airbnb Trends in Belin-Béliet (2025)
Effective short term rental pricing strategy in Belin-Béliet involves understanding monthly ADR fluctuations. The Average Daily Rate (ADR) for Airbnb in Belin-Béliet typically peaks in July and dips lowest during April. Leveraging Airbnb dynamic pricing tools or strategies based on this seasonality can significantly boost revenue. Here's a look at the typical nightly rates achieved:
- Best-in-class properties (Top 10%) command rates of $270+ per night, often due to premium features or locations.
- Strong performing properties (Top 25%) achieve nightly rates of $196 or more.
- Typical properties (Median) charge around $110 per night.
- Entry-level properties (Bottom 25%) earn around $75 per night.
Average Daily Rate (ADR) Trend by Month in Belin-Béliet
Get Live Belin-Béliet Market Intelligence 👇

Explore Real-time Analytics
Airbnb Seasonality Analysis & Trends in Belin-Béliet (2025)
Peak Season (August, July, June)
- Revenue averages $3,114 per month
- Occupancy rates average 53.8%
- Daily rates average $156
Shoulder Season
- Revenue averages $1,588 per month
- Occupancy maintains around 35.5%
- Daily rates hold near $149
Low Season (January, February, March)
- Revenue drops to average $1,022 per month
- Occupancy decreases to average 25.3%
- Daily rates adjust to average $151
Seasonality Insights for Belin-Béliet
- The Airbnb seasonality in Belin-Béliet shows highly seasonal trends requiring careful strategy. While the sections above show seasonal averages, it's also insightful to look at the extremes:
- During the high season, the absolute peak month showcases Belin-Béliet's highest earning potential, with monthly revenues capable of climbing to $3,774, occupancy reaching a high of 67.7%, and ADRs peaking at $159.
- Conversely, the slowest single month of the year, typically falling within the low season, marks the market's lowest point. In this month, revenue might dip to $921, occupancy could drop to 23.2%, and ADRs may adjust down to $145.
- Understanding both the seasonal averages and these monthly peaks and troughs in revenue, occupancy, and ADR is crucial for maximizing your Airbnb profit potential in Belin-Béliet.
Seasonal Strategies for Maximizing Profit
- Peak Season: Maximize revenue through premium pricing and potentially longer minimum stays. Ensure high availability.
- Low Season: Offer competitive pricing, special promotions (e.g., extended stay discounts), and flexible cancellation policies. Target off-season travelers like remote workers or budget-conscious guests.
- Shoulder Seasons: Implement dynamic pricing that balances peak and low rates. Target weekend travelers or specific events. Offer slightly more flexible terms than peak season.
- Regularly analyze your own performance against these Belin-Béliet seasonality benchmarks and adjust your pricing and availability strategy accordingly.
Best Areas for Airbnb Investment in Belin-Béliet (2025)
Exploring the top neighborhoods for short-term rentals in Belin-Béliet? This section highlights key areas, outlining why they are attractive for hosts and guests, along with notable local attractions. Consider these locations based on your target guest profile and investment strategy.
| Neighborhood / Area | Why Host Here? (Target Guests & Appeal) | Key Attractions & Landmarks |
|---|---|---|
| Zone de la Gare | Proche des transports et à deux pas du centre-ville, idéale pour les voyageurs d'affaires et les touristes. | Gare de Belin-Béliet, Restaurants locaux, Parc communal, Café culturel, Boutiques artisanales |
| Centre-ville | Animé et vivant, le centre-ville est parfait pour ceux qui cherchent à explorer les boutiques et cafés locaux. | Place du marché, Église de Belin-Béliet, Cinéma local, Musée local, Restaurants gastronomiques |
| Les Landes | Région naturelle magnifique, attirant ceux qui aiment la nature et les activités de plein air. | Forêt des Landes, Lacs de baignade, Pistes cyclables, Randonnée, Observation des oiseaux |
| La Vallée de la Leyre | Idéale pour les amoureux de la nature, connue pour ses paysages pittoresques et ses activités de plein air. | Parc naturel régional, Canoë-kayak, Randonnée, Observation de la faune, Chambres d'hôtes au bord de l'eau |
| Bélin | Petit village charmant avec une atmosphère paisible, parfait pour les couples et les familles en quête de tranquillité. | Vieille église, Fêtes locales, Marchés artisanaux, Balades en nature, Cafés traditionnels |
| Saint-Magne | Offre un mélange de ruralité et de proximité aux commodités, attirant ceux qui cherchent un séjour détendu. | Vin local, Visites de châteaux, Randonnée, Marchés de producteurs, Dégustation de vins |
| Saucats | Proximité des vignobles et des sites touristiques, idéal pour les amateurs de vin et de gastronomie. | Châteaux viticoles, Dégustations de vin, Parc de loisirs, Randonnées dans les vignobles, Événements gastronomiques |
| Cadasse | Connu pour son ambiance familiale et ses activités de plein air, un bon choix pour les séjours en famille. | Parc d'attractions, Activités pour enfants, Randonnée, Picnic en famille, Événements locaux |
Understanding Airbnb License Requirements & STR Laws in Belin-Béliet (2025)
While Belin-Béliet, Nouvelle-Aquitaine, France currently shows low STR regulations, specific Airbnb license requirements might still exist or change. Always verify the latest short term rental regulations and Airbnb license requirements directly with local government authorities for Belin-Béliet to ensure full compliance before hosting.
(Source: AirROI data, 2025, based on 4% licensed listings)
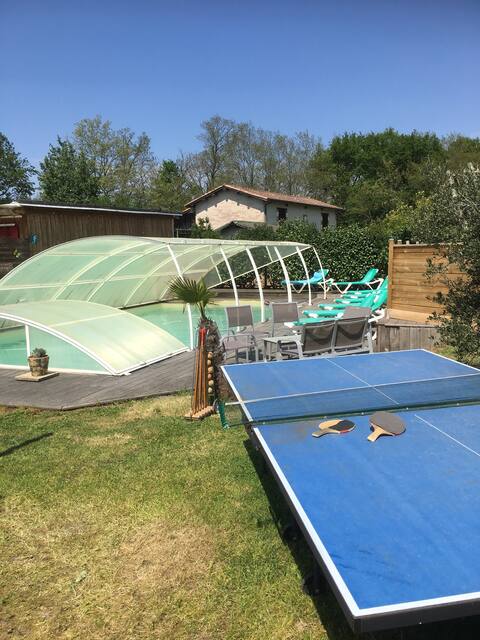
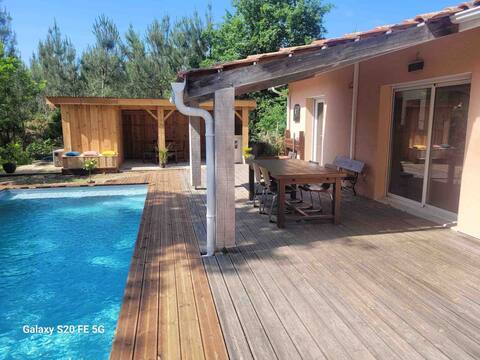
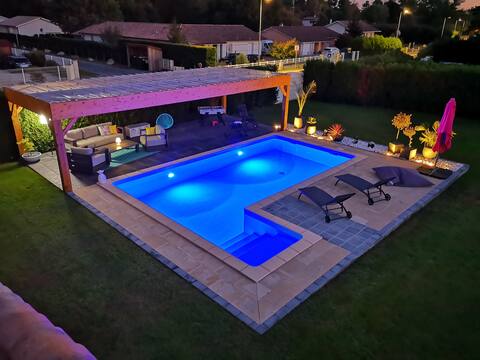
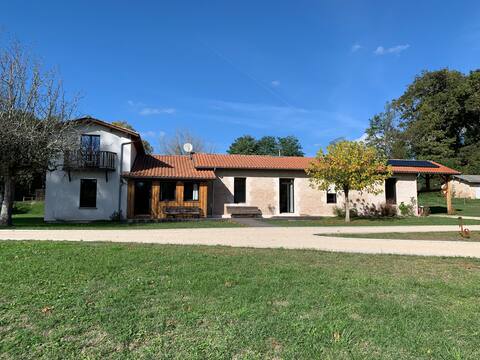
Top Performing Airbnb Properties in Belin-Béliet (2025)
Benchmark your potential! Explore examples of top-performing Airbnb properties in Belin-Bélietbased on Trailing Twelve Month (TTM) revenue. Analyze their characteristics, revenue, occupancy rate, and ADR to understand what drives success in this market.

La Charmeuse(Private Luxury Loft for Lovers
Entire Place • 1 bedroom
Cottage with large capacity Héron, up to 19 beds
Entire Place • 4 bedrooms
Friendly holidays for 12 people Heated pool
Entire Place • 5 bedrooms
Villa, heated pool,near Bassin d 'Arcachon
Entire Place • 4 bedrooms

Villa with Jacuzzi en Lisière de Forêt
Entire Place • 2 bedrooms
Gîte Pontricot adjoining the owner's home
Entire Place • 3 bedrooms
Note: Performance varies based on location, size, amenities, seasonality, and management quality. Data reflects the past 12 months.
Top Performing Airbnb Hosts in Belin-Béliet (2025)
Learn from the best! This table showcases top-performing Airbnb hosts in Belin-Béliet based on the number of properties managed and estimated total revenue over the past year. Analyze their scale and performance metrics.
| Host Name | Properties | Grossing Revenue | Stay Reviews | Avg Rating |
|---|---|---|---|---|
| Frenchy | 2 | $96,541 | 147 | 4.67/5.0 |
| Thierry Et Miguel | 2 | $74,793 | 27 | 4.91/5.0 |
| Ludivine | 5 | $62,712 | 1302 | 4.89/5.0 |
| Myriam | 2 | $30,315 | 24 | 2.46/5.0 |
| Frédéric Et Sophie | 1 | $28,054 | 16 | 5.00/5.0 |
| Marlène | 1 | $26,725 | 19 | 5.00/5.0 |
| Christiane Dominique | 1 | $23,785 | 13 | 4.92/5.0 |
| Olivier | 1 | $22,459 | 11 | 5.00/5.0 |
| Frederic | 1 | $22,303 | 15 | 4.80/5.0 |
| Cedric | 1 | $21,859 | 58 | 4.55/5.0 |
Analyzing the strategies of top hosts, such as their property selection, pricing, and guest communication, can offer valuable lessons for optimizing your own Airbnb operations in Belin-Béliet.
Dive Deeper: Advanced Belin-Béliet STR Market Data (2025)
Ready to unlock more insights? AirROI provides access to advanced metrics and comprehensive Airbnb data for Belin-Béliet. Explore detailed analytics beyond this report to refine your investment strategy, optimize pricing, and maximize your vacation rental profits.
Explore Advanced MetricsBelin-Béliet Short-Term Rental Market Composition (2025): Property & Room Types
Room Type Distribution
Property Type Distribution
Market Composition Insights for Belin-Béliet
- The Belin-Béliet Airbnb market composition is heavily skewed towards Entire Home/Apt listings, which make up 87.8% of the 49 active rentals. This indicates strong guest preference for privacy and space.
- Looking at the property type distribution in Belin-Béliet, House properties are the most common (69.4%), reflecting the local real estate landscape.
- Houses represent a significant 69.4% portion, catering likely to families or larger groups.
- The presence of 20.4% Hotel/Boutique listings indicates integration with traditional hospitality.
- Smaller segments like outdoor/unique, apartment/condo, others (combined 10.2%) offer potential for unique stay experiences.
Belin-Béliet Airbnb Room Capacity Analysis (2025): Bedroom Distribution
Distribution of Listings by Number of Bedrooms
Room Capacity Insights for Belin-Béliet
- The dominant room capacity in Belin-Béliet is 1 bedroom listings, making up 34.7% of the market. This suggests a strong demand for properties suitable for couples or solo travelers.
- Together, 1 bedroom and 2 bedrooms properties represent 59.2% of the active Airbnb listings in Belin-Béliet, indicating a high concentration in these sizes.
- A significant 34.6% of listings offer 3+ bedrooms, catering to larger groups and families seeking more space in Belin-Béliet.
Belin-Béliet Vacation Rental Guest Capacity Trends (2025)
Distribution of Listings by Guest Capacity
Guest Capacity Insights for Belin-Béliet
- The most common guest capacity trend in Belin-Béliet vacation rentals is listings accommodating 8+ guests (22.4%). This suggests the primary traveler segment is likely larger groups.
- Properties designed for 8+ guests and 4 guests dominate the Belin-Béliet STR market, accounting for 42.8% of listings.
- 44.8% of properties accommodate 6+ guests, serving the market segment for larger families or group travel in Belin-Béliet.
- On average, properties in Belin-Béliet are equipped to host 4.6 guests.
Belin-Béliet Airbnb Booking Patterns (2025): Available vs. Booked Days
Available Days Distribution
Booked Days Distribution
Booking Pattern Insights for Belin-Béliet
- The most common availability pattern in Belin-Béliet falls within the 271-366 days range, representing 57.1% of listings. This suggests many properties have significant open periods on their calendars.
- Approximately 85.7% of listings show high availability (181+ days open annually), indicating potential for increased bookings or specific owner usage patterns.
- For booked days, the 31-90 days range is most frequent in Belin-Béliet (40.8%), reflecting common guest stay durations or potential owner blocking patterns.
- A notable 18.3% of properties secure long booking periods (181+ days booked per year), highlighting successful long-term rental strategies or significant owner usage.
Belin-Béliet Airbnb Minimum Stay Requirements Analysis
Distribution of Listings by Minimum Night Requirement
1 Night
19 listings
41.3% of total
2 Nights
12 listings
26.1% of total
3 Nights
2 listings
4.3% of total
4-6 Nights
8 listings
17.4% of total
7-29 Nights
3 listings
6.5% of total
30+ Nights
2 listings
4.3% of total
Key Insights
- The most prevalent minimum stay requirement in Belin-Béliet is 1 Night, adopted by 41.3% of listings. This highlights the market's preference for shorter, flexible bookings.
- A strong majority (67.4%) of the Belin-Béliet Airbnb data shows acceptance of very short stays (1-2 nights), indicating a dynamic, high-turnover market.
Recommendations
- Align with the market by considering a 1 Night minimum stay, as 41.3% of Belin-Béliet hosts use this setting.
- Adjust minimum nights based on seasonality – potentially shorter during low season and longer during peak demand periods in Belin-Béliet.
Belin-Béliet Airbnb Cancellation Policy Trends Analysis (2025)
Flexible
17 listings
41.5% of total
Moderate
10 listings
24.4% of total
Firm
5 listings
12.2% of total
Strict
9 listings
22% of total
Cancellation Policy Insights for Belin-Béliet
- The prevailing Airbnb cancellation policy trend in Belin-Béliet is Flexible, used by 41.5% of listings.
- There's a relatively balanced mix between guest-friendly (65.9%) and stricter (34.2%) policies, offering choices for different guest needs.
Recommendations for Hosts
- Consider adopting a Flexible policy to align with the 41.5% market standard in Belin-Béliet.
- Regularly review your cancellation policy against competitors and market demand shifts in Belin-Béliet.
Belin-Béliet STR Booking Lead Time Analysis (2025)
Average Booking Lead Time by Month
Booking Lead Time Insights for Belin-Béliet
- The overall average booking lead time for vacation rentals in Belin-Béliet is 44 days.
- Guests book furthest in advance for stays during May (average 87 days), likely coinciding with peak travel demand or local events.
- The shortest booking windows occur for stays in April (average 25 days), indicating more last-minute travel plans during this time.
- Seasonally, Summer (66 days avg.) sees the longest lead times, while Fall (40 days avg.) has the shortest, reflecting typical travel planning cycles.
Recommendations for Hosts
- Use the overall average lead time (44 days) as a baseline for your pricing and availability strategy in Belin-Béliet.
- For May stays, consider implementing length-of-stay discounts or slightly higher rates for bookings made less than 87 days out to capitalize on advance planning.
- Target marketing efforts for the Summer season well in advance (at least 66 days) to capture early planners.
- Monitor your own booking lead times against these Belin-Béliet averages to identify opportunities for dynamic pricing adjustments.
Popular & Essential Airbnb Amenities in Belin-Béliet (2025)
Amenity Prevalence
Amenity Insights for Belin-Béliet
- Popular amenities like Free parking on premises, Kitchen, Hot water are common but not universal. Offering these can provide a competitive edge.
Recommendations for Hosts
- Consider adding popular differentiators like Free parking on premises or Kitchen to increase appeal.
- Highlight unique or less common amenities you offer (e.g., hot tub, dedicated workspace, EV charger) in your listing description and photos.
- Regularly check competitor amenities in Belin-Béliet to stay competitive.
Belin-Béliet Airbnb Guest Demographics & Profile Analysis (2025)
Guest Profile Summary for Belin-Béliet
- The typical guest profile for Airbnb in Belin-Béliet consists of primarily domestic travelers (76%), often arriving from nearby Bordeaux, typically belonging to the Post-2000s (Gen Z/Alpha) group (50%), primarily speaking French or English.
- Domestic travelers account for 75.8% of guests.
- Key international markets include France (75.8%) and United Kingdom (4.8%).
- Top languages spoken are French (38.5%) followed by English (30.8%).
- A significant demographic segment is the Post-2000s (Gen Z/Alpha) group, representing 50% of guests.
Recommendations for Hosts
- Target domestic marketing efforts towards travelers from Bordeaux and Paris.
- Tailor amenities and listing descriptions to appeal to the dominant Post-2000s (Gen Z/Alpha) demographic (e.g., highlight fast WiFi, smart home features, local guides).
- Highlight unique local experiences or amenities relevant to the primary guest profile.
- Consider seasonal promotions aligned with peak travel times for key origin markets.
Nearby Short-Term Rental Market Comparison
How does the Belin-Béliet Airbnb market stack up against its neighbors? Compare key performance metrics like average monthly revenue, ADR, and occupancy rates in surrounding areas to understand the broader regional STR landscape.
| Market | Active Properties | Monthly Revenue | Daily Rate | Avg. Occupancy |
|---|---|---|---|---|
| San Sebastián | 1,426 | $3,546 | $262.81 | 49% |
| Saint-Laurent-des-Combes | 11 | $3,526 | $706.18 | 23% |
| Astaffort | 10 | $3,393 | $314.20 | 35% |
| Cénac | 18 | $2,773 | $268.58 | 53% |
| Cérons | 11 | $2,635 | $196.16 | 39% |
| Galgon | 12 | $2,599 | $210.34 | 48% |
| Hernani | 11 | $2,572 | $345.16 | 40% |
| Eynesse | 14 | $2,564 | $282.87 | 36% |
| Bourrou | 10 | $2,475 | $247.57 | 36% |
| Saint-Hippolyte | 10 | $2,443 | $204.98 | 44% |