Ver-sur-Mer Airbnb Market Analysis 2025: Short Term Rental Data & Vacation Rental Statistics in Normandy, France
Is Airbnb profitable in Ver-sur-Mer in 2025? Explore comprehensive Airbnb analytics for Ver-sur-Mer, Normandy, France to uncover income potential. This 2025 STR market report for Ver-sur-Mer, based on AirROI data from April 2024 to March 2025, reveals key trends in the niche market of 91 active listings.
Whether you're considering an Airbnb investment in Ver-sur-Mer, optimizing your existing vacation rental, or exploring rental arbitrage opportunities, understanding the Ver-sur-Mer Airbnb data is crucial. Understanding the local regulations is key to maximizing your short term rental income potential. Let's dive into the specifics.
Key Ver-sur-Mer Airbnb Performance Metrics Overview
Monthly Airbnb Revenue Variations & Income Potential in Ver-sur-Mer (2025)
Understanding the monthly revenue variations for Airbnb listings in Ver-sur-Mer is key to maximizing your short term rental income potential. Seasonality significantly impacts earnings. Our analysis, based on data from the past 12 months, shows that the peak revenue month for STRs in Ver-sur-Mer is typically August, while March often presents the lowest earnings, highlighting opportunities for strategic pricing adjustments during shoulder and low seasons. Explore the typical Airbnb income in Ver-sur-Mer across different performance tiers:
- Best-in-class properties (Top 10%) achieve $5,126+ monthly, often utilizing dynamic pricing and superior guest experiences.
- Strong performing properties (Top 25%) earn $3,155 or more, indicating effective management and desirable locations/amenities.
- Typical properties (Median) generate around $1,638 per month, representing the average market performance.
- Entry-level properties (Bottom 25%) see earnings around $890, often with potential for optimization.
Average Monthly Airbnb Earnings Trend in Ver-sur-Mer
Ver-sur-Mer Airbnb Occupancy Rate Trends (2025)
Maximize your bookings by understanding the Ver-sur-Mer STR occupancy trends. Seasonal demand shifts significantly influence how often properties are booked. Typically, Augustsees the highest demand (peak season occupancy), while March experiences the lowest (low season). Effective strategies, like adjusting minimum stays or offering promotions, can boost occupancy during slower periods. Here's how different property tiers perform in Ver-sur-Mer:
- Best-in-class properties (Top 10%) achieve 78%+ occupancy, indicating high desirability and potentially optimized availability.
- Strong performing properties (Top 25%) maintain 59% or higher occupancy, suggesting good market fit and guest satisfaction.
- Typical properties (Median) have an occupancy rate around 40%.
- Entry-level properties (Bottom 25%) average 22% occupancy, potentially facing higher vacancy.
Average Monthly Occupancy Rate Trend in Ver-sur-Mer
Average Daily Rate (ADR) Airbnb Trends in Ver-sur-Mer (2025)
Effective short term rental pricing strategy in Ver-sur-Mer involves understanding monthly ADR fluctuations. The Average Daily Rate (ADR) for Airbnb in Ver-sur-Mer typically peaks in June and dips lowest during March. Leveraging Airbnb dynamic pricing tools or strategies based on this seasonality can significantly boost revenue. Here's a look at the typical nightly rates achieved:
- Best-in-class properties (Top 10%) command rates of $348+ per night, often due to premium features or locations.
- Strong performing properties (Top 25%) achieve nightly rates of $212 or more.
- Typical properties (Median) charge around $132 per night.
- Entry-level properties (Bottom 25%) earn around $88 per night.
Average Daily Rate (ADR) Trend by Month in Ver-sur-Mer
Get Live Ver-sur-Mer Market Intelligence 👇

Explore Real-time Analytics
Airbnb Seasonality Analysis & Trends in Ver-sur-Mer (2025)
Peak Season (August, June, July)
- Revenue averages $3,746 per month
- Occupancy rates average 60.3%
- Daily rates average $202
Shoulder Season
- Revenue averages $2,192 per month
- Occupancy maintains around 39.8%
- Daily rates hold near $184
Low Season (January, February, March)
- Revenue drops to average $1,402 per month
- Occupancy decreases to average 29.3%
- Daily rates adjust to average $166
Seasonality Insights for Ver-sur-Mer
- The Airbnb seasonality in Ver-sur-Mer shows highly seasonal trends requiring careful strategy. While the sections above show seasonal averages, it's also insightful to look at the extremes:
- During the high season, the absolute peak month showcases Ver-sur-Mer's highest earning potential, with monthly revenues capable of climbing to $4,149, occupancy reaching a high of 70.8%, and ADRs peaking at $206.
- Conversely, the slowest single month of the year, typically falling within the low season, marks the market's lowest point. In this month, revenue might dip to $1,273, occupancy could drop to 26.0%, and ADRs may adjust down to $164.
- Understanding both the seasonal averages and these monthly peaks and troughs in revenue, occupancy, and ADR is crucial for maximizing your Airbnb profit potential in Ver-sur-Mer.
Seasonal Strategies for Maximizing Profit
- Peak Season: Maximize revenue through premium pricing and potentially longer minimum stays. Ensure high availability.
- Low Season: Offer competitive pricing, special promotions (e.g., extended stay discounts), and flexible cancellation policies. Target off-season travelers like remote workers or budget-conscious guests.
- Shoulder Seasons: Implement dynamic pricing that balances peak and low rates. Target weekend travelers or specific events. Offer slightly more flexible terms than peak season.
- Regularly analyze your own performance against these Ver-sur-Mer seasonality benchmarks and adjust your pricing and availability strategy accordingly.
Best Areas for Airbnb Investment in Ver-sur-Mer (2025)
Exploring the top neighborhoods for short-term rentals in Ver-sur-Mer? This section highlights key areas, outlining why they are attractive for hosts and guests, along with notable local attractions. Consider these locations based on your target guest profile and investment strategy.
| Neighborhood / Area | Why Host Here? (Target Guests & Appeal) | Key Attractions & Landmarks |
|---|---|---|
| Historical District | The Historical District of Ver-sur-Mer boasts rich historical significance, especially linked to the D-Day landings during World War II. It attracts history buffs and tourists with an interest in wartime heritage. | Juno Beach Centre, Canadian Cemetery, Gold Beach Museum, Ver-sur-Mer beach, Historical D-Day sites |
| Beachfront Area | The beachfront area offers stunning seaside views and easy access to sandy beaches. Ideal for vacationers looking to enjoy the Normandy coast and relax on the beach under the sun. | Ver-sur-Mer Beach, Coastal walking paths, Water sports activities, Seaside restaurants and cafes |
| Countryside Retreats | Surrounded by the picturesque Normandy countryside, this area appeals to those seeking tranquility and nature. Perfect for families and couples looking to unwind in a rural setting. | Normandy vineyards, Bayeux Tapestry nearby, Historic chateaux, Walking and biking trails in nature |
| Local Market Area | The local market area features a vibrant weekly market that is popular among both locals and tourists, where fresh produce and regional products can be found. This area attracts visitors looking for an authentic local experience. | Weekly market, Local artisan shops, Bakeries and cafes, Cultural events and festivals |
| Normandy Battlefields | Visitors interested in military history flock to the nearby Normandy battlefields, making this area prime for hosting Airbnb accommodations geared toward these tourists. | Battle of Normandy sites, Museums dedicated to WWII, Guided historical tours |
| Cycling Routes | With its extensive cycling routes along the coast and through the countryside, this area is a hotspot for cycling enthusiasts and those looking for active holiday options. | Bicycle rental shops, Scenic cycling paths, Cycling events, Guided bike tours |
| Family Activities Zone | This area provides a wide range of family-friendly activities, making it an attractive destination for families with children seeking fun and engaging experiences. | Aquatic centers, Adventure parks, Playgrounds, Family-oriented events |
| Cultural Heritage Sites | Rich in cultural heritage, this area is perfect for travelers interested in experiencing local culture, architecture, and arts. Attractions include historic buildings and performance venues. | Church of Saint-Aubin, Local art exhibitions, Historical architecture tours |
Understanding Airbnb License Requirements & STR Laws in Ver-sur-Mer (2025)
With 12% of listings showing registration in 2025, understanding potential Airbnb license requirements is crucial in Ver-sur-Mer. Always verify the latest short term rental regulations and Airbnb license requirements directly with local government authorities for Ver-sur-Mer to ensure full compliance before hosting.
(Source: AirROI data, 2025, based on 12% licensed listings)
Top Performing Airbnb Properties in Ver-sur-Mer (2025)
Benchmark your potential! Explore examples of top-performing Airbnb properties in Ver-sur-Merbased on Trailing Twelve Month (TTM) revenue. Analyze their characteristics, revenue, occupancy rate, and ADR to understand what drives success in this market.
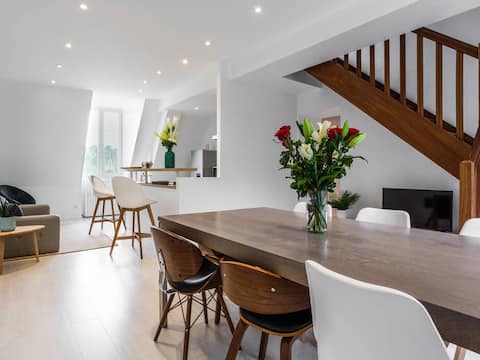
Duplex Panoramic in a Castle 2nd floor
Entire Place • 5 bedrooms
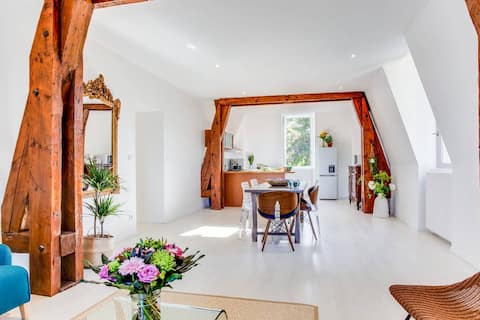
Duplex Grandiose in a Castle 2nd floor
Entire Place • 3 bedrooms
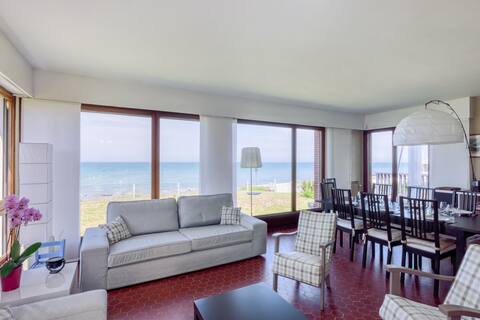
Villa Les Sternes - Les Pieds dans l 'Eau
Entire Place • 4 bedrooms
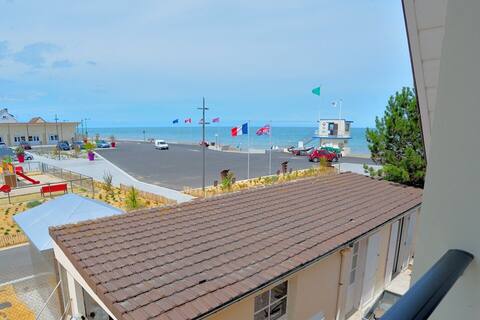
Villa Magulie, beachfront calm
Entire Place • 5 bedrooms

Restored 18th century farmhouse with Jacuzzi
Entire Place • 6 bedrooms
La Maison Bleue, quiet and sea view
Entire Place • 4 bedrooms
Note: Performance varies based on location, size, amenities, seasonality, and management quality. Data reflects the past 12 months.
Top Performing Airbnb Hosts in Ver-sur-Mer (2025)
Learn from the best! This table showcases top-performing Airbnb hosts in Ver-sur-Mer based on the number of properties managed and estimated total revenue over the past year. Analyze their scale and performance metrics.
| Host Name | Properties | Grossing Revenue | Stay Reviews | Avg Rating |
|---|---|---|---|---|
| Sandra | 5 | $338,202 | 174 | 4.97/5.0 |
| Béatrice | 4 | $89,175 | 468 | 4.88/5.0 |
| Agence COCOONR / BOOK&PAY | 3 | $84,236 | 60 | 4.43/5.0 |
| Marie | 3 | $76,067 | 95 | 4.93/5.0 |
| Christine | 1 | $58,991 | 13 | 4.77/5.0 |
| Cecile | 1 | $57,155 | 75 | 4.93/5.0 |
| Camille | 2 | $54,154 | 140 | 4.71/5.0 |
| David | 1 | $52,332 | 152 | 4.55/5.0 |
| Marine | 1 | $50,294 | 70 | 4.83/5.0 |
| Sarah | 1 | $49,264 | 65 | 4.85/5.0 |
Analyzing the strategies of top hosts, such as their property selection, pricing, and guest communication, can offer valuable lessons for optimizing your own Airbnb operations in Ver-sur-Mer.
Dive Deeper: Advanced Ver-sur-Mer STR Market Data (2025)
Ready to unlock more insights? AirROI provides access to advanced metrics and comprehensive Airbnb data for Ver-sur-Mer. Explore detailed analytics beyond this report to refine your investment strategy, optimize pricing, and maximize your vacation rental profits.
Explore Advanced MetricsVer-sur-Mer Short-Term Rental Market Composition (2025): Property & Room Types
Room Type Distribution
Property Type Distribution
Market Composition Insights for Ver-sur-Mer
- The Ver-sur-Mer Airbnb market composition is heavily skewed towards Entire Home/Apt listings, which make up 93.4% of the 91 active rentals. This indicates strong guest preference for privacy and space.
- Looking at the property type distribution in Ver-sur-Mer, House properties are the most common (60.4%), reflecting the local real estate landscape.
- Houses represent a significant 60.4% portion, catering likely to families or larger groups.
- The presence of 6.6% Hotel/Boutique listings indicates integration with traditional hospitality.
- Smaller segments like others (combined 2.2%) offer potential for unique stay experiences.
Ver-sur-Mer Airbnb Room Capacity Analysis (2025): Bedroom Distribution
Distribution of Listings by Number of Bedrooms
Room Capacity Insights for Ver-sur-Mer
- The dominant room capacity in Ver-sur-Mer is 1 bedroom listings, making up 28.6% of the market. This suggests a strong demand for properties suitable for couples or solo travelers.
- Together, 1 bedroom and 3 bedrooms properties represent 47.3% of the active Airbnb listings in Ver-sur-Mer, indicating a high concentration in these sizes.
- A significant 44.0% of listings offer 3+ bedrooms, catering to larger groups and families seeking more space in Ver-sur-Mer.
Ver-sur-Mer Vacation Rental Guest Capacity Trends (2025)
Distribution of Listings by Guest Capacity
Guest Capacity Insights for Ver-sur-Mer
- The most common guest capacity trend in Ver-sur-Mer vacation rentals is listings accommodating 8+ guests (30.8%). This suggests the primary traveler segment is likely larger groups.
- Properties designed for 8+ guests and 4 guests dominate the Ver-sur-Mer STR market, accounting for 52.8% of listings.
- 46.2% of properties accommodate 6+ guests, serving the market segment for larger families or group travel in Ver-sur-Mer.
- On average, properties in Ver-sur-Mer are equipped to host 5.0 guests.
Ver-sur-Mer Airbnb Booking Patterns (2025): Available vs. Booked Days
Available Days Distribution
Booked Days Distribution
Booking Pattern Insights for Ver-sur-Mer
- The most common availability pattern in Ver-sur-Mer falls within the 181-270 days range, representing 42.9% of listings. This suggests many properties have significant open periods on their calendars.
- Approximately 81.4% of listings show high availability (181+ days open annually), indicating potential for increased bookings or specific owner usage patterns.
- For booked days, the 91-180 days range is most frequent in Ver-sur-Mer (42.9%), reflecting common guest stay durations or potential owner blocking patterns.
- A notable 18.7% of properties secure long booking periods (181+ days booked per year), highlighting successful long-term rental strategies or significant owner usage.
Ver-sur-Mer Airbnb Minimum Stay Requirements Analysis
Distribution of Listings by Minimum Night Requirement
1 Night
18 listings
20.5% of total
2 Nights
36 listings
40.9% of total
3 Nights
10 listings
11.4% of total
4-6 Nights
10 listings
11.4% of total
7-29 Nights
3 listings
3.4% of total
30+ Nights
11 listings
12.5% of total
Key Insights
- The most prevalent minimum stay requirement in Ver-sur-Mer is 2 Nights, adopted by 40.9% of listings. This highlights the market's preference for shorter, flexible bookings.
- A strong majority (61.4%) of the Ver-sur-Mer Airbnb data shows acceptance of very short stays (1-2 nights), indicating a dynamic, high-turnover market.
- A significant segment (12.5%) caters to monthly stays (30+ nights) in Ver-sur-Mer, pointing to opportunities in the extended-stay market.
Recommendations
- Align with the market by considering a 2 Nights minimum stay, as 40.9% of Ver-sur-Mer hosts use this setting.
- If feasible, allowing 1-night stays, especially midweek or during low season, could capture last-minute bookings, as only 20.5% currently do.
- Explore offering discounts for stays of 30+ nights to attract the 12.5% of the market seeking extended stays.
- Adjust minimum nights based on seasonality – potentially shorter during low season and longer during peak demand periods in Ver-sur-Mer.
Ver-sur-Mer Airbnb Cancellation Policy Trends Analysis (2025)
Flexible
13 listings
16.5% of total
Moderate
37 listings
46.8% of total
Firm
15 listings
19% of total
Strict
14 listings
17.7% of total
Cancellation Policy Insights for Ver-sur-Mer
- The prevailing Airbnb cancellation policy trend in Ver-sur-Mer is Moderate, used by 46.8% of listings.
- There's a relatively balanced mix between guest-friendly (63.3%) and stricter (36.7%) policies, offering choices for different guest needs.
Recommendations for Hosts
- Consider adopting a Moderate policy to align with the 46.8% market standard in Ver-sur-Mer.
- Regularly review your cancellation policy against competitors and market demand shifts in Ver-sur-Mer.
Ver-sur-Mer STR Booking Lead Time Analysis (2025)
Average Booking Lead Time by Month
Booking Lead Time Insights for Ver-sur-Mer
- The overall average booking lead time for vacation rentals in Ver-sur-Mer is 71 days.
- Guests book furthest in advance for stays during June (average 154 days), likely coinciding with peak travel demand or local events.
- The shortest booking windows occur for stays in March (average 44 days), indicating more last-minute travel plans during this time.
- Seasonally, Summer (120 days avg.) sees the longest lead times, while Winter (53 days avg.) has the shortest, reflecting typical travel planning cycles.
Recommendations for Hosts
- Use the overall average lead time (71 days) as a baseline for your pricing and availability strategy in Ver-sur-Mer.
- For June stays, consider implementing length-of-stay discounts or slightly higher rates for bookings made less than 154 days out to capitalize on advance planning.
- Target marketing efforts for the Summer season well in advance (at least 120 days) to capture early planners.
- Monitor your own booking lead times against these Ver-sur-Mer averages to identify opportunities for dynamic pricing adjustments.
Popular & Essential Airbnb Amenities in Ver-sur-Mer (2025)
Amenity Prevalence
Amenity Insights for Ver-sur-Mer
- Essential amenities in Ver-sur-Mer that guests expect include: Free parking on premises, Hot water. Lacking these (any) could significantly impact bookings.
- Popular amenities like Kitchen, Wifi, TV are common but not universal. Offering these can provide a competitive edge.
- Warning: Wifi is not universally provided but is considered essential globally. Ensure reliable Wifi is offered.
Recommendations for Hosts
- Ensure your listing includes all essential amenities for Ver-sur-Mer: Free parking on premises, Hot water.
- Prioritize adding missing essentials: Free parking on premises, Hot water.
- Consider adding popular differentiators like Kitchen or Wifi to increase appeal.
- Highlight unique or less common amenities you offer (e.g., hot tub, dedicated workspace, EV charger) in your listing description and photos.
- Regularly check competitor amenities in Ver-sur-Mer to stay competitive.
Ver-sur-Mer Airbnb Guest Demographics & Profile Analysis (2025)
Guest Profile Summary for Ver-sur-Mer
- The typical guest profile for Airbnb in Ver-sur-Mer consists of a mix of domestic (53%) and international guests, often arriving from nearby Paris, typically belonging to the Post-2000s (Gen Z/Alpha) group (50%), primarily speaking English or French.
- Domestic travelers account for 52.8% of guests.
- Key international markets include France (52.8%) and United Kingdom (13.5%).
- Top languages spoken are English (38%) followed by French (31.8%).
- A significant demographic segment is the Post-2000s (Gen Z/Alpha) group, representing 50% of guests.
Recommendations for Hosts
- Balance marketing efforts between domestic and international channels based on the guest mix.
- Tailor amenities and listing descriptions to appeal to the dominant Post-2000s (Gen Z/Alpha) demographic (e.g., highlight fast WiFi, smart home features, local guides).
- Highlight unique local experiences or amenities relevant to the primary guest profile.
- Consider seasonal promotions aligned with peak travel times for key origin markets.
Nearby Short-Term Rental Market Comparison
How does the Ver-sur-Mer Airbnb market stack up against its neighbors? Compare key performance metrics like average monthly revenue, ADR, and occupancy rates in surrounding areas to understand the broader regional STR landscape.
| Market | Active Properties | Monthly Revenue | Daily Rate | Avg. Occupancy |
|---|---|---|---|---|
| La Poterie-Cap-d'Antifer | 11 | $5,076 | $293.95 | 55% |
| Nettlestone | 26 | $3,980 | $391.99 | 42% |
| Bonneville-sur-Touques | 16 | $3,903 | $367.00 | 40% |
| Luneray | 12 | $3,745 | $526.24 | 42% |
| Furzehill | 12 | $3,537 | $256.32 | 47% |
| Shorwell | 28 | $3,511 | $283.08 | 45% |
| St Ives | 15 | $3,509 | $243.56 | 46% |
| Roedean | 47 | $3,494 | $257.09 | 47% |
| Saint-Étienne-la-Thillaye | 24 | $3,459 | $325.89 | 42% |
| Cricquebœuf | 10 | $3,417 | $268.29 | 46% |