Thury-Harcourt-le-Hom Airbnb Market Analysis 2025: Short Term Rental Data & Vacation Rental Statistics in Normandy, France
Is Airbnb profitable in Thury-Harcourt-le-Hom in 2025? Explore comprehensive Airbnb analytics for Thury-Harcourt-le-Hom, Normandy, France to uncover income potential. This 2025 STR market report for Thury-Harcourt-le-Hom, based on AirROI data from April 2024 to March 2025, reveals key trends in the niche market of 19 active listings.
Whether you're considering an Airbnb investment in Thury-Harcourt-le-Hom, optimizing your existing vacation rental, or exploring rental arbitrage opportunities, understanding the Thury-Harcourt-le-Hom Airbnb data is crucial. Leveraging the low regulation environment is key to maximizing your short term rental income potential. Let's dive into the specifics.
Key Thury-Harcourt-le-Hom Airbnb Performance Metrics Overview
Monthly Airbnb Revenue Variations & Income Potential in Thury-Harcourt-le-Hom (2025)
Understanding the monthly revenue variations for Airbnb listings in Thury-Harcourt-le-Hom is key to maximizing your short term rental income potential. Seasonality significantly impacts earnings. Our analysis, based on data from the past 12 months, shows that the peak revenue month for STRs in Thury-Harcourt-le-Hom is typically June, while March often presents the lowest earnings, highlighting opportunities for strategic pricing adjustments during shoulder and low seasons. Explore the typical Airbnb income in Thury-Harcourt-le-Hom across different performance tiers:
- Best-in-class properties (Top 10%) achieve $3,731+ monthly, often utilizing dynamic pricing and superior guest experiences.
- Strong performing properties (Top 25%) earn $2,703 or more, indicating effective management and desirable locations/amenities.
- Typical properties (Median) generate around $1,820 per month, representing the average market performance.
- Entry-level properties (Bottom 25%) see earnings around $960, often with potential for optimization.
Average Monthly Airbnb Earnings Trend in Thury-Harcourt-le-Hom
Thury-Harcourt-le-Hom Airbnb Occupancy Rate Trends (2025)
Maximize your bookings by understanding the Thury-Harcourt-le-Hom STR occupancy trends. Seasonal demand shifts significantly influence how often properties are booked. Typically, Augustsees the highest demand (peak season occupancy), while March experiences the lowest (low season). Effective strategies, like adjusting minimum stays or offering promotions, can boost occupancy during slower periods. Here's how different property tiers perform in Thury-Harcourt-le-Hom:
- Best-in-class properties (Top 10%) achieve 71%+ occupancy, indicating high desirability and potentially optimized availability.
- Strong performing properties (Top 25%) maintain 59% or higher occupancy, suggesting good market fit and guest satisfaction.
- Typical properties (Median) have an occupancy rate around 42%.
- Entry-level properties (Bottom 25%) average 29% occupancy, potentially facing higher vacancy.
Average Monthly Occupancy Rate Trend in Thury-Harcourt-le-Hom
Average Daily Rate (ADR) Airbnb Trends in Thury-Harcourt-le-Hom (2025)
Effective short term rental pricing strategy in Thury-Harcourt-le-Hom involves understanding monthly ADR fluctuations. The Average Daily Rate (ADR) for Airbnb in Thury-Harcourt-le-Hom typically peaks in November and dips lowest during March. Leveraging Airbnb dynamic pricing tools or strategies based on this seasonality can significantly boost revenue. Here's a look at the typical nightly rates achieved:
- Best-in-class properties (Top 10%) command rates of $213+ per night, often due to premium features or locations.
- Strong performing properties (Top 25%) achieve nightly rates of $141 or more.
- Typical properties (Median) charge around $109 per night.
- Entry-level properties (Bottom 25%) earn around $70 per night.
Average Daily Rate (ADR) Trend by Month in Thury-Harcourt-le-Hom
Get Live Thury-Harcourt-le-Hom Market Intelligence 👇

Explore Real-time Analytics
Airbnb Seasonality Analysis & Trends in Thury-Harcourt-le-Hom (2025)
Peak Season (June, April, May)
- Revenue averages $3,330 per month
- Occupancy rates average 49.0%
- Daily rates average $131
Shoulder Season
- Revenue averages $2,022 per month
- Occupancy maintains around 47.0%
- Daily rates hold near $132
Low Season (January, February, March)
- Revenue drops to average $1,042 per month
- Occupancy decreases to average 28.0%
- Daily rates adjust to average $125
Seasonality Insights for Thury-Harcourt-le-Hom
- The Airbnb seasonality in Thury-Harcourt-le-Hom shows highly seasonal trends requiring careful strategy. While the sections above show seasonal averages, it's also insightful to look at the extremes:
- During the high season, the absolute peak month showcases Thury-Harcourt-le-Hom's highest earning potential, with monthly revenues capable of climbing to $3,580, occupancy reaching a high of 68.0%, and ADRs peaking at $136.
- Conversely, the slowest single month of the year, typically falling within the low season, marks the market's lowest point. In this month, revenue might dip to $648, occupancy could drop to 17.7%, and ADRs may adjust down to $124.
- Understanding both the seasonal averages and these monthly peaks and troughs in revenue, occupancy, and ADR is crucial for maximizing your Airbnb profit potential in Thury-Harcourt-le-Hom.
Seasonal Strategies for Maximizing Profit
- Peak Season: Maximize revenue through premium pricing and potentially longer minimum stays. Ensure high availability.
- Low Season: Offer competitive pricing, special promotions (e.g., extended stay discounts), and flexible cancellation policies. Target off-season travelers like remote workers or budget-conscious guests.
- Shoulder Seasons: Implement dynamic pricing that balances peak and low rates. Target weekend travelers or specific events. Offer slightly more flexible terms than peak season.
- Regularly analyze your own performance against these Thury-Harcourt-le-Hom seasonality benchmarks and adjust your pricing and availability strategy accordingly.
Best Areas for Airbnb Investment in Thury-Harcourt-le-Hom (2025)
Exploring the top neighborhoods for short-term rentals in Thury-Harcourt-le-Hom? This section highlights key areas, outlining why they are attractive for hosts and guests, along with notable local attractions. Consider these locations based on your target guest profile and investment strategy.
| Neighborhood / Area | Why Host Here? (Target Guests & Appeal) | Key Attractions & Landmarks |
|---|---|---|
| Thury-Harcourt Historical Center | A charming village center featuring beautiful historical architecture and quaint streets, offering an authentic taste of Normandy culture. Attracts tourists interested in history and local experiences. | Chateau de Thury-Harcourt, Local artisan shops, Village square, Historical museums, Norman cuisine restaurants |
| L'Orne Valley | Known for its breathtaking natural scenery and outdoor activities, this area appeals to nature lovers and adventure seekers looking for a peaceful retreat amidst nature. | Orne River canoeing, Cycling trails, Picnic areas, Scenic viewpoints, Wildlife observing spots |
| Local Farms and Orchards | Surrounded by picturesque farmland, this area attracts guests interested in agritourism, offering fresh local produce and rustic experiences. | Apple orchards, Farmers markets, Cider tasting, Rural hiking trails, Animal petting farms |
| Bocage Normand | This lush countryside provides an ideal backdrop for guests looking for quiet, rural getaways filled with scenic views and traditional Normandy landscapes. | Rolling hills, Traditional villages, Walking paths, Nature reserves, Historic sites |
| Nearby Falaise | A short drive away, Falaise is steeped in history, particularly known for its connection to William the Conqueror, making it a compelling visit for history enthusiasts. | Chateau de Falaise, Birthplace of William the Conqueror, Local museums, Historical tours, Cafes and shops |
| Les Jardins de la Côte Fleury | Famous for its gardens and serene landscapes, this area offers tranquility and beauty, drawing those looking to relax in nature. | Botanical gardens, Walking trails, Picnic spots, Flower festivals, Art in the gardens |
| Caen Memorial Museum | Located nearby, this museum attracts tourists interested in WWII history and peace studies, making it a perfect location for educational stays. | War memorials, Educational tours, Exhibits on peace, Historical artifacts, Documentary screenings |
| Cider Route | This scenic route through Normandy is known for its cider houses and apple orchards, appealing to foodies and beverage enthusiasts eager to taste local specialties. | Cider tasting tours, Apple festivals, Local restaurants, Rural landscapes, Scenic drives |
Understanding Airbnb License Requirements & STR Laws in Thury-Harcourt-le-Hom (2025)
While Thury-Harcourt-le-Hom, Normandy, France currently shows low STR regulations, specific Airbnb license requirements might still exist or change. Always verify the latest short term rental regulations and Airbnb license requirements directly with local government authorities for Thury-Harcourt-le-Hom to ensure full compliance before hosting.
(Source: AirROI data, 2025, finding no licensed listings among those analyzed)
Top Performing Airbnb Properties in Thury-Harcourt-le-Hom (2025)
Benchmark your potential! Explore examples of top-performing Airbnb properties in Thury-Harcourt-le-Hombased on Trailing Twelve Month (TTM) revenue. Analyze their characteristics, revenue, occupancy rate, and ADR to understand what drives success in this market.

SPACIOUS HOUSE WITH HOT TUB AND SAUNA
Entire Place • 4 bedrooms
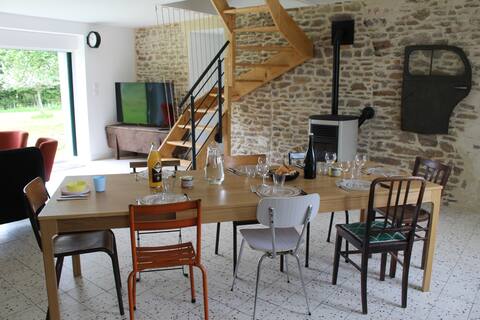
Le Coq Au Vert - 10 pers. cottage in Suisse Normande
Entire Place • 4 bedrooms
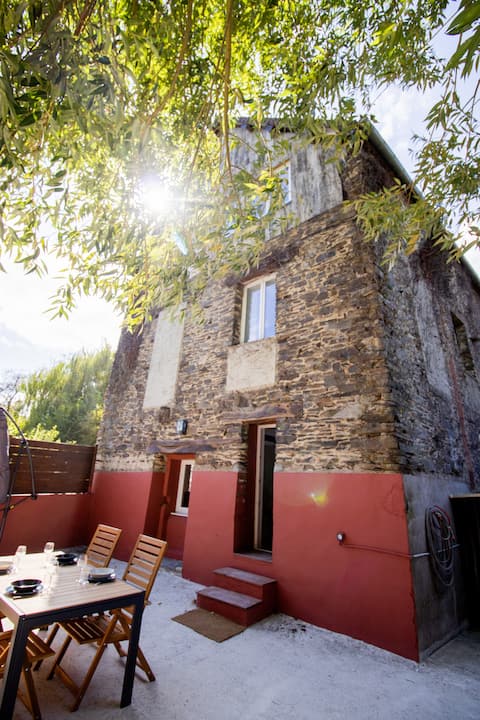
"Beautiful House in Stone" 4 bedrooms
Entire Place • 4 bedrooms
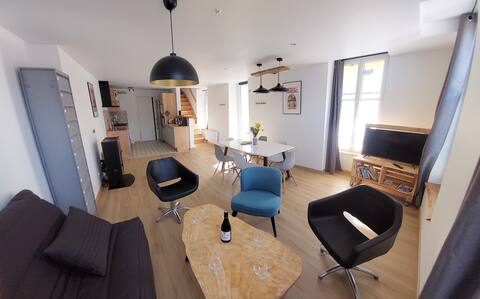
La Cigogne, modern, spacious and well located
Entire Place • 3 bedrooms

Chalet de la Prairie
Entire Place • 1 bedroom
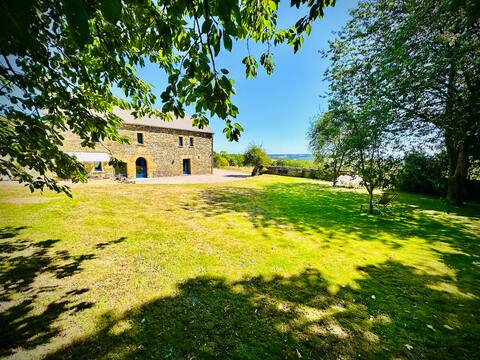
House in the heart of the greenery of Normandy Switzerland
Entire Place • 3 bedrooms
Note: Performance varies based on location, size, amenities, seasonality, and management quality. Data reflects the past 12 months.
Top Performing Airbnb Hosts in Thury-Harcourt-le-Hom (2025)
Learn from the best! This table showcases top-performing Airbnb hosts in Thury-Harcourt-le-Hom based on the number of properties managed and estimated total revenue over the past year. Analyze their scale and performance metrics.
| Host Name | Properties | Grossing Revenue | Stay Reviews | Avg Rating |
|---|---|---|---|---|
| Mélanie | 2 | $93,064 | 61 | 4.64/5.0 |
| Martin | 4 | $85,809 | 112 | 4.98/5.0 |
| Laetitia | 1 | $31,719 | 47 | 5.00/5.0 |
| Marion Et Olivier | 1 | $29,609 | 35 | 4.74/5.0 |
| Valentin | 1 | $24,603 | 28 | 4.96/5.0 |
| Anne-Sophie | 1 | $22,786 | 6 | 5.00/5.0 |
| Beatrice | 1 | $19,707 | 17 | 5.00/5.0 |
| Dorian | 1 | $16,117 | 25 | 4.76/5.0 |
| Christophe | 1 | $13,114 | 79 | 4.63/5.0 |
| Host #318115616 | 1 | $11,450 | 9 | 4.67/5.0 |
Analyzing the strategies of top hosts, such as their property selection, pricing, and guest communication, can offer valuable lessons for optimizing your own Airbnb operations in Thury-Harcourt-le-Hom.
Dive Deeper: Advanced Thury-Harcourt-le-Hom STR Market Data (2025)
Ready to unlock more insights? AirROI provides access to advanced metrics and comprehensive Airbnb data for Thury-Harcourt-le-Hom. Explore detailed analytics beyond this report to refine your investment strategy, optimize pricing, and maximize your vacation rental profits.
Explore Advanced MetricsThury-Harcourt-le-Hom Short-Term Rental Market Composition (2025): Property & Room Types
Room Type Distribution
Property Type Distribution
Market Composition Insights for Thury-Harcourt-le-Hom
- The Thury-Harcourt-le-Hom Airbnb market composition is heavily skewed towards Entire Home/Apt listings, which make up 89.5% of the 19 active rentals. This indicates strong guest preference for privacy and space.
- Looking at the property type distribution in Thury-Harcourt-le-Hom, House properties are the most common (73.7%), reflecting the local real estate landscape.
- Houses represent a significant 73.7% portion, catering likely to families or larger groups.
- The presence of 15.8% Hotel/Boutique listings indicates integration with traditional hospitality.
Thury-Harcourt-le-Hom Airbnb Room Capacity Analysis (2025): Bedroom Distribution
Distribution of Listings by Number of Bedrooms
Room Capacity Insights for Thury-Harcourt-le-Hom
- The dominant room capacity in Thury-Harcourt-le-Hom is 2 bedrooms listings, making up 36.8% of the market. This suggests a strong demand for properties suitable for couples or solo travelers.
- Together, 2 bedrooms and 1 bedroom properties represent 68.4% of the active Airbnb listings in Thury-Harcourt-le-Hom, indicating a high concentration in these sizes.
- A significant 31.6% of listings offer 3+ bedrooms, catering to larger groups and families seeking more space in Thury-Harcourt-le-Hom.
Thury-Harcourt-le-Hom Vacation Rental Guest Capacity Trends (2025)
Distribution of Listings by Guest Capacity
Guest Capacity Insights for Thury-Harcourt-le-Hom
- The most common guest capacity trend in Thury-Harcourt-le-Hom vacation rentals is listings accommodating 4 guests (26.3%). This suggests the primary traveler segment is likely small families or groups.
- Properties designed for 4 guests and 8+ guests dominate the Thury-Harcourt-le-Hom STR market, accounting for 47.4% of listings.
- 31.7% of properties accommodate 6+ guests, serving the market segment for larger families or group travel in Thury-Harcourt-le-Hom.
- On average, properties in Thury-Harcourt-le-Hom are equipped to host 4.9 guests.
Thury-Harcourt-le-Hom Airbnb Booking Patterns (2025): Available vs. Booked Days
Available Days Distribution
Booked Days Distribution
Booking Pattern Insights for Thury-Harcourt-le-Hom
- The most common availability pattern in Thury-Harcourt-le-Hom falls within the 181-270 days range, representing 47.4% of listings. This suggests many properties have significant open periods on their calendars.
- Approximately 79.0% of listings show high availability (181+ days open annually), indicating potential for increased bookings or specific owner usage patterns.
- For booked days, the 91-180 days range is most frequent in Thury-Harcourt-le-Hom (47.4%), reflecting common guest stay durations or potential owner blocking patterns.
- A notable 21.1% of properties secure long booking periods (181+ days booked per year), highlighting successful long-term rental strategies or significant owner usage.
Thury-Harcourt-le-Hom Airbnb Minimum Stay Requirements Analysis
Distribution of Listings by Minimum Night Requirement
1 Night
10 listings
58.8% of total
2 Nights
7 listings
41.2% of total
Key Insights
- The most prevalent minimum stay requirement in Thury-Harcourt-le-Hom is 1 Night, adopted by 58.8% of listings. This highlights the market's preference for shorter, flexible bookings.
- A strong majority (100.0%) of the Thury-Harcourt-le-Hom Airbnb data shows acceptance of very short stays (1-2 nights), indicating a dynamic, high-turnover market.
Recommendations
- Align with the market by considering a 1 Night minimum stay, as 58.8% of Thury-Harcourt-le-Hom hosts use this setting.
- Adjust minimum nights based on seasonality – potentially shorter during low season and longer during peak demand periods in Thury-Harcourt-le-Hom.
Thury-Harcourt-le-Hom Airbnb Cancellation Policy Trends Analysis (2025)
Flexible
3 listings
18.8% of total
Moderate
8 listings
50% of total
Firm
5 listings
31.3% of total
Cancellation Policy Insights for Thury-Harcourt-le-Hom
- The prevailing Airbnb cancellation policy trend in Thury-Harcourt-le-Hom is Moderate, used by 50% of listings.
- There's a relatively balanced mix between guest-friendly (68.8%) and stricter (31.3%) policies, offering choices for different guest needs.
Recommendations for Hosts
- Consider adopting a Moderate policy to align with the 50% market standard in Thury-Harcourt-le-Hom.
- Regularly review your cancellation policy against competitors and market demand shifts in Thury-Harcourt-le-Hom.
Thury-Harcourt-le-Hom STR Booking Lead Time Analysis (2025)
Average Booking Lead Time by Month
Booking Lead Time Insights for Thury-Harcourt-le-Hom
- The overall average booking lead time for vacation rentals in Thury-Harcourt-le-Hom is 34 days.
- Guests book furthest in advance for stays during May (average 110 days), likely coinciding with peak travel demand or local events.
- The shortest booking windows occur for stays in January (average 11 days), indicating more last-minute travel plans during this time.
- Seasonally, Spring (70 days avg.) sees the longest lead times, while Winter (18 days avg.) has the shortest, reflecting typical travel planning cycles.
Recommendations for Hosts
- Use the overall average lead time (34 days) as a baseline for your pricing and availability strategy in Thury-Harcourt-le-Hom.
- For May stays, consider implementing length-of-stay discounts or slightly higher rates for bookings made less than 110 days out to capitalize on advance planning.
- During January, focus on last-minute booking availability and promotions, as guests book with very short notice (11 days avg.).
- Target marketing efforts for the Spring season well in advance (at least 70 days) to capture early planners.
- Monitor your own booking lead times against these Thury-Harcourt-le-Hom averages to identify opportunities for dynamic pricing adjustments.
Popular & Essential Airbnb Amenities in Thury-Harcourt-le-Hom (2025)
Amenity Prevalence
Amenity Insights for Thury-Harcourt-le-Hom
- Essential amenities in Thury-Harcourt-le-Hom that guests expect include: Smoke alarm, Dishes and silverware, Hot water. Lacking these (any) could significantly impact bookings.
- Popular amenities like Kitchen, TV, Refrigerator are common but not universal. Offering these can provide a competitive edge.
Recommendations for Hosts
- Ensure your listing includes all essential amenities for Thury-Harcourt-le-Hom: Smoke alarm, Dishes and silverware, Hot water.
- Consider adding popular differentiators like Kitchen or TV to increase appeal.
- Highlight unique or less common amenities you offer (e.g., hot tub, dedicated workspace, EV charger) in your listing description and photos.
- Regularly check competitor amenities in Thury-Harcourt-le-Hom to stay competitive.
Thury-Harcourt-le-Hom Airbnb Guest Demographics & Profile Analysis (2025)
Guest Profile Summary for Thury-Harcourt-le-Hom
- The typical guest profile for Airbnb in Thury-Harcourt-le-Hom consists of primarily domestic travelers (83%), often arriving from nearby Paris, typically belonging to the Post-2000s (Gen Z/Alpha) group (50%), primarily speaking French or English.
- Domestic travelers account for 83.2% of guests.
- Key international markets include France (83.2%) and United Kingdom (4.7%).
- Top languages spoken are French (40.5%) followed by English (35.9%).
- A significant demographic segment is the Post-2000s (Gen Z/Alpha) group, representing 50% of guests.
Recommendations for Hosts
- Target domestic marketing efforts towards travelers from Paris and Rouen.
- Tailor amenities and listing descriptions to appeal to the dominant Post-2000s (Gen Z/Alpha) demographic (e.g., highlight fast WiFi, smart home features, local guides).
- Highlight unique local experiences or amenities relevant to the primary guest profile.
- Consider seasonal promotions aligned with peak travel times for key origin markets.
Nearby Short-Term Rental Market Comparison
How does the Thury-Harcourt-le-Hom Airbnb market stack up against its neighbors? Compare key performance metrics like average monthly revenue, ADR, and occupancy rates in surrounding areas to understand the broader regional STR landscape.
| Market | Active Properties | Monthly Revenue | Daily Rate | Avg. Occupancy |
|---|---|---|---|---|
| La Poterie-Cap-d'Antifer | 11 | $5,076 | $293.95 | 55% |
| Bonneville-sur-Touques | 16 | $3,903 | $367.00 | 40% |
| Luneray | 12 | $3,745 | $526.24 | 42% |
| Saint-Étienne-la-Thillaye | 24 | $3,459 | $325.89 | 42% |
| Cricquebœuf | 10 | $3,417 | $268.29 | 46% |
| Caumont | 11 | $3,350 | $286.17 | 49% |
| Coteaux-sur-Loire | 19 | $3,328 | $270.00 | 41% |
| Moulins-le-Carbonnel | 11 | $3,213 | $320.85 | 35% |
| Gonneville-en-Auge | 12 | $3,061 | $235.90 | 40% |
| Villiers-sur-Loir | 10 | $2,967 | $216.51 | 41% |