Sées Airbnb Market Analysis 2025: Short Term Rental Data & Vacation Rental Statistics in Normandy, France
Is Airbnb profitable in Sées in 2025? Explore comprehensive Airbnb analytics for Sées, Normandy, France to uncover income potential. This 2025 STR market report for Sées, based on AirROI data from April 2024 to March 2025, reveals key trends in the niche market of 22 active listings.
Whether you're considering an Airbnb investment in Sées, optimizing your existing vacation rental, or exploring rental arbitrage opportunities, understanding the Sées Airbnb data is crucial. Leveraging the low regulation environment is key to maximizing your short term rental income potential. Let's dive into the specifics.
Key Sées Airbnb Performance Metrics Overview
Monthly Airbnb Revenue Variations & Income Potential in Sées (2025)
Understanding the monthly revenue variations for Airbnb listings in Sées is key to maximizing your short term rental income potential. Seasonality significantly impacts earnings. Our analysis, based on data from the past 12 months, shows that the peak revenue month for STRs in Sées is typically May, while September often presents the lowest earnings, highlighting opportunities for strategic pricing adjustments during shoulder and low seasons. Explore the typical Airbnb income in Sées across different performance tiers:
- Best-in-class properties (Top 10%) achieve $2,512+ monthly, often utilizing dynamic pricing and superior guest experiences.
- Strong performing properties (Top 25%) earn $1,703 or more, indicating effective management and desirable locations/amenities.
- Typical properties (Median) generate around $1,023 per month, representing the average market performance.
- Entry-level properties (Bottom 25%) see earnings around $545, often with potential for optimization.
Average Monthly Airbnb Earnings Trend in Sées
Sées Airbnb Occupancy Rate Trends (2025)
Maximize your bookings by understanding the Sées STR occupancy trends. Seasonal demand shifts significantly influence how often properties are booked. Typically, Augustsees the highest demand (peak season occupancy), while January experiences the lowest (low season). Effective strategies, like adjusting minimum stays or offering promotions, can boost occupancy during slower periods. Here's how different property tiers perform in Sées:
- Best-in-class properties (Top 10%) achieve 73%+ occupancy, indicating high desirability and potentially optimized availability.
- Strong performing properties (Top 25%) maintain 58% or higher occupancy, suggesting good market fit and guest satisfaction.
- Typical properties (Median) have an occupancy rate around 43%.
- Entry-level properties (Bottom 25%) average 26% occupancy, potentially facing higher vacancy.
Average Monthly Occupancy Rate Trend in Sées
Average Daily Rate (ADR) Airbnb Trends in Sées (2025)
Effective short term rental pricing strategy in Sées involves understanding monthly ADR fluctuations. The Average Daily Rate (ADR) for Airbnb in Sées typically peaks in November and dips lowest during September. Leveraging Airbnb dynamic pricing tools or strategies based on this seasonality can significantly boost revenue. Here's a look at the typical nightly rates achieved:
- Best-in-class properties (Top 10%) command rates of $114+ per night, often due to premium features or locations.
- Strong performing properties (Top 25%) achieve nightly rates of $94 or more.
- Typical properties (Median) charge around $68 per night.
- Entry-level properties (Bottom 25%) earn around $51 per night.
Average Daily Rate (ADR) Trend by Month in Sées
Get Live Sées Market Intelligence 👇

Explore Real-time Analytics
Airbnb Seasonality Analysis & Trends in Sées (2025)
Peak Season (May, August, July)
- Revenue averages $1,933 per month
- Occupancy rates average 52.9%
- Daily rates average $92
Shoulder Season
- Revenue averages $1,438 per month
- Occupancy maintains around 41.2%
- Daily rates hold near $92
Low Season (February, March, September)
- Revenue drops to average $1,055 per month
- Occupancy decreases to average 38.3%
- Daily rates adjust to average $90
Seasonality Insights for Sées
- The Airbnb seasonality in Sées shows moderate seasonality with distinct peak and low periods. While the sections above show seasonal averages, it's also insightful to look at the extremes:
- During the high season, the absolute peak month showcases Sées's highest earning potential, with monthly revenues capable of climbing to $1,965, occupancy reaching a high of 61.1%, and ADRs peaking at $96.
- Conversely, the slowest single month of the year, typically falling within the low season, marks the market's lowest point. In this month, revenue might dip to $1,024, occupancy could drop to 31.9%, and ADRs may adjust down to $87.
- Understanding both the seasonal averages and these monthly peaks and troughs in revenue, occupancy, and ADR is crucial for maximizing your Airbnb profit potential in Sées.
Seasonal Strategies for Maximizing Profit
- Peak Season: Maximize revenue through premium pricing and potentially longer minimum stays. Ensure high availability.
- Low Season: Offer competitive pricing, special promotions (e.g., extended stay discounts), and flexible cancellation policies. Target off-season travelers like remote workers or budget-conscious guests.
- Shoulder Seasons: Implement dynamic pricing that balances peak and low rates. Target weekend travelers or specific events. Offer slightly more flexible terms than peak season.
- Regularly analyze your own performance against these Sées seasonality benchmarks and adjust your pricing and availability strategy accordingly.
Best Areas for Airbnb Investment in Sées (2025)
Exploring the top neighborhoods for short-term rentals in Sées? This section highlights key areas, outlining why they are attractive for hosts and guests, along with notable local attractions. Consider these locations based on your target guest profile and investment strategy.
| Neighborhood / Area | Why Host Here? (Target Guests & Appeal) | Key Attractions & Landmarks |
|---|---|---|
| Sées City Center | Central area with historical sites, local shops, and restaurants. Attractive for tourists exploring the rich cultural heritage of Normandy. | Cathedral of Sées, Historic Town Hall, Local Market, Musee de Sées, Parc National Normandie-Maine |
| Côte de Nacre | Scenic coastal area providing beautiful beaches and outdoor activities. Ideal for guests looking for relaxation and seaside fun. | The Beaches of Langrune-sur-Mer, The historic town of Arromanches, Omaha Beach, Courseulles-sur-Mer, Juno Beach |
| Normandy Countryside | Quaint rural area surrounded by picturesque landscapes and charming villages. Perfect for guests seeking tranquility and nature. | Château de Carrouges, Bagnoles de l'Orne, Regional Natural Park of Normandie-Maine, Local farms and vineyards, Hiking trails |
| Carrouges | Charming town known for its historic architecture and peaceful ambiance. Attracts visitors interested in a slower pace of life. | Castle of Carrouges, Local artisanal shops, Château de la Duchesse de Montpensier, Historic streets |
| Alençon | Nearby city with vibrant culture and history. A great location for exploring bigger city attractions while enjoying smaller town charm. | Château d'Alençon, Notre-Dame d'Alençon, Musee des Beaux-Arts, Local boutiques, Park of Happening |
| Falaise | Historic town famous for its association with William the Conqueror. Offers rich history and cultural sites for interested travelers. | Falaise Castle, Gare de Falaise, Château de Falaise Museum, Local markets, Les Jardins de la Mairie |
| Argentan | Cultural hub with a blend of history and modern amenities. Great for guests looking for cultural enrichment and leisure activities. | Argentan Castle, Abbey of Saint-Germain, Local parks, Shopping streets, Cultural festivals |
| Domfront-en-Poiraie | A medieval town offering a unique glimpse into Norman history. Perfect for tourists intrigued by medieval architecture and history. | Domfront Castle, Historic village center, Musee de la Jeep, Local crafts shops, Walks through the medieval streets |
Understanding Airbnb License Requirements & STR Laws in Sées (2025)
While Sées, Normandy, France currently shows low STR regulations, specific Airbnb license requirements might still exist or change. Always verify the latest short term rental regulations and Airbnb license requirements directly with local government authorities for Sées to ensure full compliance before hosting.
(Source: AirROI data, 2025, finding no licensed listings among those analyzed)
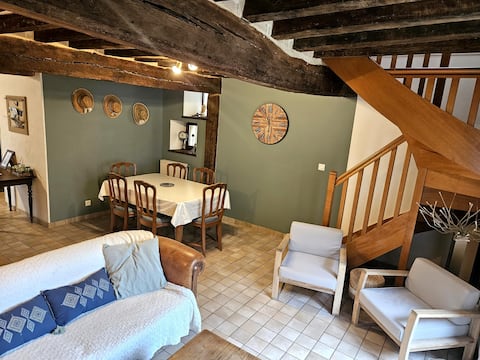
Top Performing Airbnb Properties in Sées (2025)
Benchmark your potential! Explore examples of top-performing Airbnb properties in Séesbased on Trailing Twelve Month (TTM) revenue. Analyze their characteristics, revenue, occupancy rate, and ADR to understand what drives success in this market.
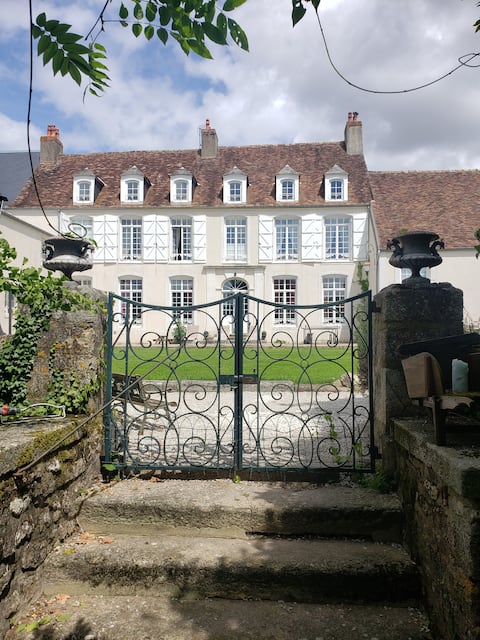
Family home in small city of character.
Entire Place • 9 bedrooms
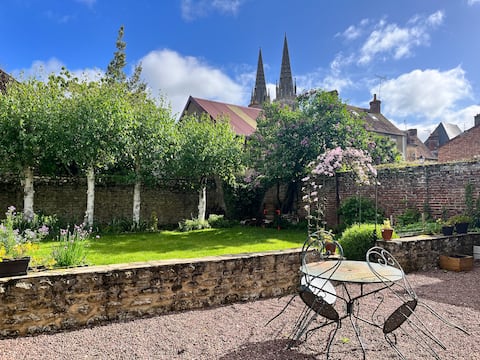
Cheerful house with garden and garage
Entire Place • 3 bedrooms

Country house with courtyard.
Entire Place • 3 bedrooms
"Le petit Conté" - Quiet house in the center of Sées
Entire Place • 3 bedrooms
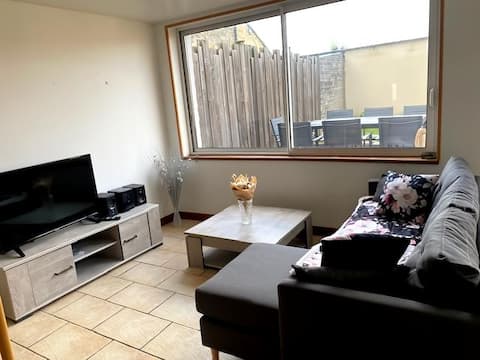
very quiet townhouse
Entire Place • 3 bedrooms
Spacious townhouse with wooded garden
Entire Place • 3 bedrooms
Note: Performance varies based on location, size, amenities, seasonality, and management quality. Data reflects the past 12 months.
Top Performing Airbnb Hosts in Sées (2025)
Learn from the best! This table showcases top-performing Airbnb hosts in Sées based on the number of properties managed and estimated total revenue over the past year. Analyze their scale and performance metrics.
| Host Name | Properties | Grossing Revenue | Stay Reviews | Avg Rating |
|---|---|---|---|---|
| Evelyne | 1 | $98,687 | 71 | 4.87/5.0 |
| Stéphanie | 2 | $35,521 | 329 | 4.88/5.0 |
| Marie-Paule | 6 | $33,967 | 539 | 4.83/5.0 |
| Charlene | 2 | $33,713 | 185 | 4.81/5.0 |
| Delphine | 1 | $25,707 | 14 | 4.79/5.0 |
| Pierre-Yves | 1 | $21,001 | 77 | 4.94/5.0 |
| Anne-Sophie | 1 | $17,126 | 77 | 4.91/5.0 |
| Aline | 1 | $17,000 | 62 | 4.85/5.0 |
| Cyrille | 1 | $15,474 | 16 | 5.00/5.0 |
| Cécile | 1 | $13,899 | 77 | 4.88/5.0 |
Analyzing the strategies of top hosts, such as their property selection, pricing, and guest communication, can offer valuable lessons for optimizing your own Airbnb operations in Sées.
Dive Deeper: Advanced Sées STR Market Data (2025)
Ready to unlock more insights? AirROI provides access to advanced metrics and comprehensive Airbnb data for Sées. Explore detailed analytics beyond this report to refine your investment strategy, optimize pricing, and maximize your vacation rental profits.
Explore Advanced MetricsSées Short-Term Rental Market Composition (2025): Property & Room Types
Room Type Distribution
Property Type Distribution
Market Composition Insights for Sées
- The Sées Airbnb market composition is heavily skewed towards Entire Home/Apt listings, which make up 72.7% of the 22 active rentals. This indicates strong guest preference for privacy and space.
- Looking at the property type distribution in Sées, House properties are the most common (77.3%), reflecting the local real estate landscape.
- Houses represent a significant 77.3% portion, catering likely to families or larger groups.
- Smaller segments like hotel/boutique (combined 4.5%) offer potential for unique stay experiences.
Sées Airbnb Room Capacity Analysis (2025): Bedroom Distribution
Distribution of Listings by Number of Bedrooms
Room Capacity Insights for Sées
- The dominant room capacity in Sées is 1 bedroom listings, making up 31.8% of the market. This suggests a strong demand for properties suitable for couples or solo travelers.
- Together, 1 bedroom and 3 bedrooms properties represent 63.6% of the active Airbnb listings in Sées, indicating a high concentration in these sizes.
- A significant 36.3% of listings offer 3+ bedrooms, catering to larger groups and families seeking more space in Sées.
Sées Vacation Rental Guest Capacity Trends (2025)
Distribution of Listings by Guest Capacity
Guest Capacity Insights for Sées
- The most common guest capacity trend in Sées vacation rentals is listings accommodating 4 guests (31.8%). This suggests the primary traveler segment is likely small families or groups.
- Properties designed for 4 guests and 8+ guests dominate the Sées STR market, accounting for 50.0% of listings.
- 31.8% of properties accommodate 6+ guests, serving the market segment for larger families or group travel in Sées.
- On average, properties in Sées are equipped to host 4.0 guests.
Sées Airbnb Booking Patterns (2025): Available vs. Booked Days
Available Days Distribution
Booked Days Distribution
Booking Pattern Insights for Sées
- The most common availability pattern in Sées falls within the 91-180 days range, representing 59.1% of listings. This suggests many properties have significant open periods on their calendars.
- Approximately 40.9% of listings show high availability (181+ days open annually), indicating potential for increased bookings or specific owner usage patterns.
- For booked days, the 181-270 days range is most frequent in Sées (59.1%), reflecting common guest stay durations or potential owner blocking patterns.
- A notable 59.1% of properties secure long booking periods (181+ days booked per year), highlighting successful long-term rental strategies or significant owner usage.
Sées Airbnb Minimum Stay Requirements Analysis
Distribution of Listings by Minimum Night Requirement
1 Night
15 listings
71.4% of total
2 Nights
3 listings
14.3% of total
30+ Nights
3 listings
14.3% of total
Key Insights
- The most prevalent minimum stay requirement in Sées is 1 Night, adopted by 71.4% of listings. This highlights the market's preference for shorter, flexible bookings.
- A strong majority (85.7%) of the Sées Airbnb data shows acceptance of very short stays (1-2 nights), indicating a dynamic, high-turnover market.
- A significant segment (14.3%) caters to monthly stays (30+ nights) in Sées, pointing to opportunities in the extended-stay market.
Recommendations
- Align with the market by considering a 1 Night minimum stay, as 71.4% of Sées hosts use this setting.
- Explore offering discounts for stays of 30+ nights to attract the 14.3% of the market seeking extended stays.
- Adjust minimum nights based on seasonality – potentially shorter during low season and longer during peak demand periods in Sées.
Sées Airbnb Cancellation Policy Trends Analysis (2025)
Flexible
10 listings
47.6% of total
Moderate
6 listings
28.6% of total
Firm
1 listings
4.8% of total
Strict
4 listings
19% of total
Cancellation Policy Insights for Sées
- The prevailing Airbnb cancellation policy trend in Sées is Flexible, used by 47.6% of listings.
- The market strongly favors guest-friendly terms, with 76.2% of listings offering Flexible or Moderate policies. This suggests guests in Sées may expect booking flexibility.
Recommendations for Hosts
- Consider adopting a Flexible policy to align with the 47.6% market standard in Sées.
- Regularly review your cancellation policy against competitors and market demand shifts in Sées.
Sées STR Booking Lead Time Analysis (2025)
Average Booking Lead Time by Month
Booking Lead Time Insights for Sées
- The overall average booking lead time for vacation rentals in Sées is 57 days.
- Guests book furthest in advance for stays during May (average 112 days), likely coinciding with peak travel demand or local events.
- The shortest booking windows occur for stays in December (average 36 days), indicating more last-minute travel plans during this time.
- Seasonally, Spring (86 days avg.) sees the longest lead times, while Fall (41 days avg.) has the shortest, reflecting typical travel planning cycles.
Recommendations for Hosts
- Use the overall average lead time (57 days) as a baseline for your pricing and availability strategy in Sées.
- For May stays, consider implementing length-of-stay discounts or slightly higher rates for bookings made less than 112 days out to capitalize on advance planning.
- Target marketing efforts for the Spring season well in advance (at least 86 days) to capture early planners.
- Monitor your own booking lead times against these Sées averages to identify opportunities for dynamic pricing adjustments.
Popular & Essential Airbnb Amenities in Sées (2025)
Amenity Prevalence
Amenity Insights for Sées
- Essential amenities in Sées that guests expect include: Dishes and silverware, Microwave, Heating, Coffee maker. Lacking these (any) could significantly impact bookings.
- Popular amenities like Bed linens, Hot water, Cooking basics are common but not universal. Offering these can provide a competitive edge.
Recommendations for Hosts
- Ensure your listing includes all essential amenities for Sées: Dishes and silverware, Microwave, Heating, Coffee maker.
- Prioritize adding missing essentials: Heating, Coffee maker.
- Consider adding popular differentiators like Bed linens or Hot water to increase appeal.
- Highlight unique or less common amenities you offer (e.g., hot tub, dedicated workspace, EV charger) in your listing description and photos.
- Regularly check competitor amenities in Sées to stay competitive.
Sées Airbnb Guest Demographics & Profile Analysis (2025)
Guest Profile Summary for Sées
- The typical guest profile for Airbnb in Sées consists of primarily domestic travelers (68%), often arriving from nearby England, typically belonging to the Post-2000s (Gen Z/Alpha) group (50%), primarily speaking French or English.
- Domestic travelers account for 68.4% of guests.
- Key international markets include France (68.4%) and United Kingdom (21.1%).
- Top languages spoken are French (43.1%) followed by English (33.8%).
- A significant demographic segment is the Post-2000s (Gen Z/Alpha) group, representing 50% of guests.
Recommendations for Hosts
- Target domestic marketing efforts towards travelers from England and Paris.
- Tailor amenities and listing descriptions to appeal to the dominant Post-2000s (Gen Z/Alpha) demographic (e.g., highlight fast WiFi, smart home features, local guides).
- Highlight unique local experiences or amenities relevant to the primary guest profile.
- Consider seasonal promotions aligned with peak travel times for key origin markets.
Nearby Short-Term Rental Market Comparison
How does the Sées Airbnb market stack up against its neighbors? Compare key performance metrics like average monthly revenue, ADR, and occupancy rates in surrounding areas to understand the broader regional STR landscape.
| Market | Active Properties | Monthly Revenue | Daily Rate | Avg. Occupancy |
|---|---|---|---|---|
| La Poterie-Cap-d'Antifer | 11 | $5,076 | $293.95 | 55% |
| Bonneville-sur-Touques | 16 | $3,903 | $367.00 | 40% |
| Luneray | 12 | $3,745 | $526.24 | 42% |
| La Couture-Boussey | 12 | $3,620 | $378.08 | 28% |
| Millançay | 11 | $3,476 | $370.42 | 39% |
| Saint-Étienne-la-Thillaye | 24 | $3,459 | $325.89 | 42% |
| Cricquebœuf | 10 | $3,417 | $268.29 | 46% |
| Caumont | 11 | $3,350 | $286.17 | 49% |
| Coteaux-sur-Loire | 19 | $3,328 | $270.00 | 41% |
| Moulins-le-Carbonnel | 11 | $3,213 | $320.85 | 35% |