Saint-Quentin-sur-le-Homme Airbnb Market Analysis 2025: Short Term Rental Data & Vacation Rental Statistics in Normandy, France
Is Airbnb profitable in Saint-Quentin-sur-le-Homme in 2025? Explore comprehensive Airbnb analytics for Saint-Quentin-sur-le-Homme, Normandy, France to uncover income potential. This 2025 STR market report for Saint-Quentin-sur-le-Homme, based on AirROI data from April 2024 to March 2025, reveals key trends in the niche market of 17 active listings.
Whether you're considering an Airbnb investment in Saint-Quentin-sur-le-Homme, optimizing your existing vacation rental, or exploring rental arbitrage opportunities, understanding the Saint-Quentin-sur-le-Homme Airbnb data is crucial. Understanding the local regulations is key to maximizing your short term rental income potential. Let's dive into the specifics.
Key Saint-Quentin-sur-le-Homme Airbnb Performance Metrics Overview
Monthly Airbnb Revenue Variations & Income Potential in Saint-Quentin-sur-le-Homme (2025)
Understanding the monthly revenue variations for Airbnb listings in Saint-Quentin-sur-le-Homme is key to maximizing your short term rental income potential. Seasonality significantly impacts earnings. Our analysis, based on data from the past 12 months, shows that the peak revenue month for STRs in Saint-Quentin-sur-le-Homme is typically August, while January often presents the lowest earnings, highlighting opportunities for strategic pricing adjustments during shoulder and low seasons. Explore the typical Airbnb income in Saint-Quentin-sur-le-Homme across different performance tiers:
- Best-in-class properties (Top 10%) achieve $2,254+ monthly, often utilizing dynamic pricing and superior guest experiences.
- Strong performing properties (Top 25%) earn $1,638 or more, indicating effective management and desirable locations/amenities.
- Typical properties (Median) generate around $976 per month, representing the average market performance.
- Entry-level properties (Bottom 25%) see earnings around $514, often with potential for optimization.
Average Monthly Airbnb Earnings Trend in Saint-Quentin-sur-le-Homme
Saint-Quentin-sur-le-Homme Airbnb Occupancy Rate Trends (2025)
Maximize your bookings by understanding the Saint-Quentin-sur-le-Homme STR occupancy trends. Seasonal demand shifts significantly influence how often properties are booked. Typically, Augustsees the highest demand (peak season occupancy), while January experiences the lowest (low season). Effective strategies, like adjusting minimum stays or offering promotions, can boost occupancy during slower periods. Here's how different property tiers perform in Saint-Quentin-sur-le-Homme:
- Best-in-class properties (Top 10%) achieve 80%+ occupancy, indicating high desirability and potentially optimized availability.
- Strong performing properties (Top 25%) maintain 55% or higher occupancy, suggesting good market fit and guest satisfaction.
- Typical properties (Median) have an occupancy rate around 38%.
- Entry-level properties (Bottom 25%) average 22% occupancy, potentially facing higher vacancy.
Average Monthly Occupancy Rate Trend in Saint-Quentin-sur-le-Homme
Average Daily Rate (ADR) Airbnb Trends in Saint-Quentin-sur-le-Homme (2025)
Effective short term rental pricing strategy in Saint-Quentin-sur-le-Homme involves understanding monthly ADR fluctuations. The Average Daily Rate (ADR) for Airbnb in Saint-Quentin-sur-le-Homme typically peaks in July and dips lowest during February. Leveraging Airbnb dynamic pricing tools or strategies based on this seasonality can significantly boost revenue. Here's a look at the typical nightly rates achieved:
- Best-in-class properties (Top 10%) command rates of $124+ per night, often due to premium features or locations.
- Strong performing properties (Top 25%) achieve nightly rates of $108 or more.
- Typical properties (Median) charge around $72 per night.
- Entry-level properties (Bottom 25%) earn around $59 per night.
Average Daily Rate (ADR) Trend by Month in Saint-Quentin-sur-le-Homme
Get Live Saint-Quentin-sur-le-Homme Market Intelligence 👇

Explore Real-time Analytics
Airbnb Seasonality Analysis & Trends in Saint-Quentin-sur-le-Homme (2025)
Peak Season (August, July, June)
- Revenue averages $1,773 per month
- Occupancy rates average 58.8%
- Daily rates average $85
Shoulder Season
- Revenue averages $1,118 per month
- Occupancy maintains around 42.5%
- Daily rates hold near $82
Low Season (January, February, December)
- Revenue drops to average $678 per month
- Occupancy decreases to average 26.7%
- Daily rates adjust to average $81
Seasonality Insights for Saint-Quentin-sur-le-Homme
- The Airbnb seasonality in Saint-Quentin-sur-le-Homme shows highly seasonal trends requiring careful strategy. While the sections above show seasonal averages, it's also insightful to look at the extremes:
- During the high season, the absolute peak month showcases Saint-Quentin-sur-le-Homme's highest earning potential, with monthly revenues capable of climbing to $1,956, occupancy reaching a high of 71.5%, and ADRs peaking at $87.
- Conversely, the slowest single month of the year, typically falling within the low season, marks the market's lowest point. In this month, revenue might dip to $464, occupancy could drop to 18.5%, and ADRs may adjust down to $80.
- Understanding both the seasonal averages and these monthly peaks and troughs in revenue, occupancy, and ADR is crucial for maximizing your Airbnb profit potential in Saint-Quentin-sur-le-Homme.
Seasonal Strategies for Maximizing Profit
- Peak Season: Maximize revenue through premium pricing and potentially longer minimum stays. Ensure high availability.
- Low Season: Offer competitive pricing, special promotions (e.g., extended stay discounts), and flexible cancellation policies. Target off-season travelers like remote workers or budget-conscious guests.
- Shoulder Seasons: Implement dynamic pricing that balances peak and low rates. Target weekend travelers or specific events. Offer slightly more flexible terms than peak season.
- Regularly analyze your own performance against these Saint-Quentin-sur-le-Homme seasonality benchmarks and adjust your pricing and availability strategy accordingly.
Best Areas for Airbnb Investment in Saint-Quentin-sur-le-Homme (2025)
Exploring the top neighborhoods for short-term rentals in Saint-Quentin-sur-le-Homme? This section highlights key areas, outlining why they are attractive for hosts and guests, along with notable local attractions. Consider these locations based on your target guest profile and investment strategy.
| Neighborhood / Area | Why Host Here? (Target Guests & Appeal) | Key Attractions & Landmarks |
|---|---|---|
| Le Mont-Saint-Michel | A UNESCO World Heritage site, famous for its stunning island commune topped with a medieval abbey. It's a major tourist attraction drawing visitors from all over the world, making it ideal for Airbnb investment. | Mont Saint-Michel Abbey, La Grande Rue, Musee Historique, The Church, Ramparts of Mont Saint-Michel |
| Granville | Known as the 'Monaco of the North', Granville offers beautiful beaches and a vibrant harbor. It's a popular summer destination, attracting families and history enthusiasts. | Christian Dior Museum, Granville beaches, Old Town, Granville Lighthouse, Musee d'Art Moderne |
| Saint-Malo | A historic walled city that is a hotspot for tourists. Its rich history and beautiful beaches make it appealing for those looking to experience French culture. | Saint-Malo Cathedral, The Intra-Muros, Fort National, Beaches of Saint-Malo, Les Remparts |
| Avranches | A charming town rich in history, close to Mont-Saint-Michel. It's appealing for visitors interested in history, making it a good option for Airbnb. | Scriptorial d'Avranches, Jardin des plantes, Avranches Cathedral, Mont Saint-Michel views, Musee des 80 ans du Debarquement |
| Jullouville | A seaside resort known for its sandy beaches and family-friendly atmosphere. Perfect for summer holiday rentals, catering to families and beach lovers. | Jullouville Beach, The Promenade, Water sports activities, Local cafes, Nearby nature trails |
| Domfront | A historic town with medieval architecture and scenic views, suitable for guests looking for a quieter, more rural experience. | Domfront Castle, Saint-Julien Church, The old town, Château de Domfront, Local markets |
| Fougères | Home to one of the largest and best-preserved medieval castles in Europe. It's a fascinating destination for history buffs and families. | Fougères Castle, The medieval town, Botanical Garden, Saint-Sulpice Church, Musee Emmanuel de la Villéon |
| Lisieux | Known for its religious significance and beautiful basilica, Lisieux attracts many pilgrims and tourists, ideal for short-term rentals. | Basilique Sainte-Thérèse, Lisieux Cathedral, Musee d'Art et d'Histoire, The Carmelite Convent, Château de Lisieux |
Understanding Airbnb License Requirements & STR Laws in Saint-Quentin-sur-le-Homme (2025)
With 12% of listings showing registration in 2025, understanding potential Airbnb license requirements is crucial in Saint-Quentin-sur-le-Homme. Always verify the latest short term rental regulations and Airbnb license requirements directly with local government authorities for Saint-Quentin-sur-le-Homme to ensure full compliance before hosting.
(Source: AirROI data, 2025, based on 12% licensed listings)
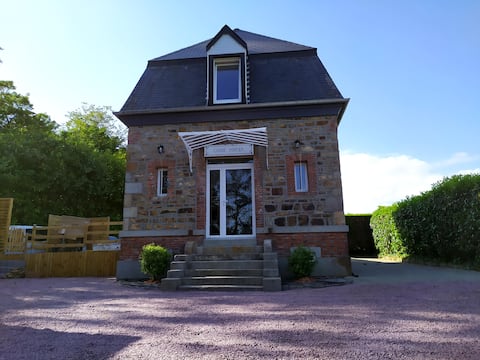
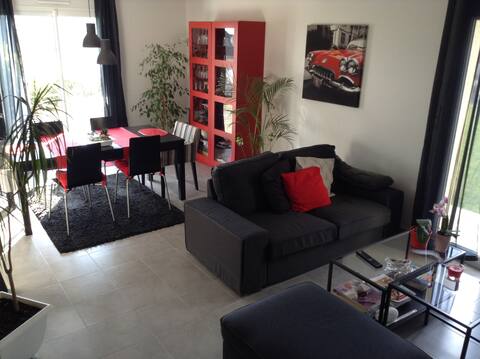
Top Performing Airbnb Properties in Saint-Quentin-sur-le-Homme (2025)
Benchmark your potential! Explore examples of top-performing Airbnb properties in Saint-Quentin-sur-le-Hommebased on Trailing Twelve Month (TTM) revenue. Analyze their characteristics, revenue, occupancy rate, and ADR to understand what drives success in this market.

House near Mont Saint Michel
Entire Place • 4 bedrooms
Gite du Garde Portier
Entire Place • 3 bedrooms

Maison de charme dans la Baie "Les Mouettes"
Entire Place • 4 bedrooms
PRIVATE ROOM NEAR MONT ST MICHEL 5 PERS
Private Room • 2 bedrooms

The little bay cocoon
Entire Place • 1 bedroom
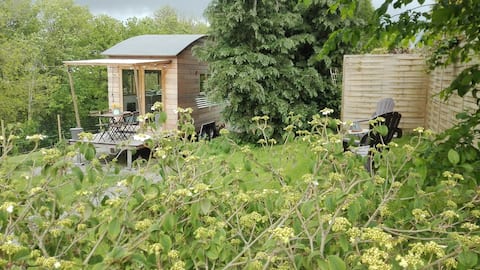
"Tiny House" cottage in Mont Saint Michel Bay
Entire Place • 1 bedroom
Note: Performance varies based on location, size, amenities, seasonality, and management quality. Data reflects the past 12 months.
Top Performing Airbnb Hosts in Saint-Quentin-sur-le-Homme (2025)
Learn from the best! This table showcases top-performing Airbnb hosts in Saint-Quentin-sur-le-Homme based on the number of properties managed and estimated total revenue over the past year. Analyze their scale and performance metrics.
| Host Name | Properties | Grossing Revenue | Stay Reviews | Avg Rating |
|---|---|---|---|---|
| Brigitte | 4 | $36,511 | 196 | 4.87/5.0 |
| Michel | 1 | $25,081 | 97 | 4.97/5.0 |
| Déborah | 1 | $24,838 | 291 | 4.90/5.0 |
| Host #461503423 | 1 | $22,529 | 27 | 4.81/5.0 |
| Gilles | 1 | $13,610 | 70 | 4.89/5.0 |
| Christèle & Sébastien | 1 | $10,712 | 157 | 4.94/5.0 |
| Sophie | 1 | $10,693 | 14 | 5.00/5.0 |
| Douglas | 1 | $9,314 | 121 | 4.83/5.0 |
| Olivier | 1 | $9,224 | 30 | 4.87/5.0 |
| Solange | 2 | $8,325 | 248 | 4.67/5.0 |
Analyzing the strategies of top hosts, such as their property selection, pricing, and guest communication, can offer valuable lessons for optimizing your own Airbnb operations in Saint-Quentin-sur-le-Homme.
Dive Deeper: Advanced Saint-Quentin-sur-le-Homme STR Market Data (2025)
Ready to unlock more insights? AirROI provides access to advanced metrics and comprehensive Airbnb data for Saint-Quentin-sur-le-Homme. Explore detailed analytics beyond this report to refine your investment strategy, optimize pricing, and maximize your vacation rental profits.
Explore Advanced MetricsSaint-Quentin-sur-le-Homme Short-Term Rental Market Composition (2025): Property & Room Types
Room Type Distribution
Property Type Distribution
Market Composition Insights for Saint-Quentin-sur-le-Homme
- The Saint-Quentin-sur-le-Homme Airbnb market composition is heavily skewed towards Entire Home/Apt listings, which make up 70.6% of the 17 active rentals. This indicates strong guest preference for privacy and space.
- Looking at the property type distribution in Saint-Quentin-sur-le-Homme, House properties are the most common (76.5%), reflecting the local real estate landscape.
- Houses represent a significant 76.5% portion, catering likely to families or larger groups.
- The presence of 11.8% Hotel/Boutique listings indicates integration with traditional hospitality.
Saint-Quentin-sur-le-Homme Airbnb Room Capacity Analysis (2025): Bedroom Distribution
Distribution of Listings by Number of Bedrooms
Room Capacity Insights for Saint-Quentin-sur-le-Homme
- The dominant room capacity in Saint-Quentin-sur-le-Homme is 1 bedroom listings, making up 35.3% of the market. This suggests a strong demand for properties suitable for couples or solo travelers.
- Together, 1 bedroom and 2 bedrooms properties represent 58.8% of the active Airbnb listings in Saint-Quentin-sur-le-Homme, indicating a high concentration in these sizes.
- A significant 23.6% of listings offer 3+ bedrooms, catering to larger groups and families seeking more space in Saint-Quentin-sur-le-Homme.
Saint-Quentin-sur-le-Homme Vacation Rental Guest Capacity Trends (2025)
Distribution of Listings by Guest Capacity
Guest Capacity Insights for Saint-Quentin-sur-le-Homme
- The most common guest capacity trend in Saint-Quentin-sur-le-Homme vacation rentals is listings accommodating 2 guests (35.3%). This suggests the primary traveler segment is likely couples or solo travelers.
- Properties designed for 2 guests and 6 guests dominate the Saint-Quentin-sur-le-Homme STR market, accounting for 52.9% of listings.
- 29.4% of properties accommodate 6+ guests, serving the market segment for larger families or group travel in Saint-Quentin-sur-le-Homme.
- On average, properties in Saint-Quentin-sur-le-Homme are equipped to host 2.9 guests.
Saint-Quentin-sur-le-Homme Airbnb Booking Patterns (2025): Available vs. Booked Days
Available Days Distribution
Booked Days Distribution
Booking Pattern Insights for Saint-Quentin-sur-le-Homme
- The most common availability pattern in Saint-Quentin-sur-le-Homme falls within the 181-270 days range, representing 47.1% of listings. This suggests many properties have significant open periods on their calendars.
- Approximately 82.4% of listings show high availability (181+ days open annually), indicating potential for increased bookings or specific owner usage patterns.
- For booked days, the 91-180 days range is most frequent in Saint-Quentin-sur-le-Homme (47.1%), reflecting common guest stay durations or potential owner blocking patterns.
- A notable 23.6% of properties secure long booking periods (181+ days booked per year), highlighting successful long-term rental strategies or significant owner usage.
Saint-Quentin-sur-le-Homme Airbnb Minimum Stay Requirements Analysis
Distribution of Listings by Minimum Night Requirement
1 Night
5 listings
31.3% of total
2 Nights
7 listings
43.8% of total
3 Nights
1 listings
6.3% of total
4-6 Nights
3 listings
18.8% of total
Key Insights
- The most prevalent minimum stay requirement in Saint-Quentin-sur-le-Homme is 2 Nights, adopted by 43.8% of listings. This highlights the market's preference for shorter, flexible bookings.
- A strong majority (75.1%) of the Saint-Quentin-sur-le-Homme Airbnb data shows acceptance of very short stays (1-2 nights), indicating a dynamic, high-turnover market.
Recommendations
- Align with the market by considering a 2 Nights minimum stay, as 43.8% of Saint-Quentin-sur-le-Homme hosts use this setting.
- Adjust minimum nights based on seasonality – potentially shorter during low season and longer during peak demand periods in Saint-Quentin-sur-le-Homme.
Saint-Quentin-sur-le-Homme Airbnb Cancellation Policy Trends Analysis (2025)
Flexible
4 listings
25% of total
Moderate
7 listings
43.8% of total
Firm
1 listings
6.3% of total
Strict
4 listings
25% of total
Cancellation Policy Insights for Saint-Quentin-sur-le-Homme
- The prevailing Airbnb cancellation policy trend in Saint-Quentin-sur-le-Homme is Moderate, used by 43.8% of listings.
- There's a relatively balanced mix between guest-friendly (68.8%) and stricter (31.3%) policies, offering choices for different guest needs.
Recommendations for Hosts
- Consider adopting a Moderate policy to align with the 43.8% market standard in Saint-Quentin-sur-le-Homme.
- Regularly review your cancellation policy against competitors and market demand shifts in Saint-Quentin-sur-le-Homme.
Saint-Quentin-sur-le-Homme STR Booking Lead Time Analysis (2025)
Average Booking Lead Time by Month
Booking Lead Time Insights for Saint-Quentin-sur-le-Homme
- The overall average booking lead time for vacation rentals in Saint-Quentin-sur-le-Homme is 63 days.
- Guests book furthest in advance for stays during September (average 106 days), likely coinciding with peak travel demand or local events.
- The shortest booking windows occur for stays in February (average 35 days), indicating more last-minute travel plans during this time.
- Seasonally, Summer (86 days avg.) sees the longest lead times, while Winter (43 days avg.) has the shortest, reflecting typical travel planning cycles.
Recommendations for Hosts
- Use the overall average lead time (63 days) as a baseline for your pricing and availability strategy in Saint-Quentin-sur-le-Homme.
- For September stays, consider implementing length-of-stay discounts or slightly higher rates for bookings made less than 106 days out to capitalize on advance planning.
- Target marketing efforts for the Summer season well in advance (at least 86 days) to capture early planners.
- Monitor your own booking lead times against these Saint-Quentin-sur-le-Homme averages to identify opportunities for dynamic pricing adjustments.
Popular & Essential Airbnb Amenities in Saint-Quentin-sur-le-Homme (2025)
Amenity Prevalence
Amenity Insights for Saint-Quentin-sur-le-Homme
- Essential amenities in Saint-Quentin-sur-le-Homme that guests expect include: Coffee maker, Free parking on premises, Refrigerator. Lacking these (any) could significantly impact bookings.
- Popular amenities like Kitchen, Hot water, Outdoor dining area are common but not universal. Offering these can provide a competitive edge.
Recommendations for Hosts
- Ensure your listing includes all essential amenities for Saint-Quentin-sur-le-Homme: Coffee maker, Free parking on premises, Refrigerator.
- Consider adding popular differentiators like Kitchen or Hot water to increase appeal.
- Highlight unique or less common amenities you offer (e.g., hot tub, dedicated workspace, EV charger) in your listing description and photos.
- Regularly check competitor amenities in Saint-Quentin-sur-le-Homme to stay competitive.
Saint-Quentin-sur-le-Homme Airbnb Guest Demographics & Profile Analysis (2025)
Guest Profile Summary for Saint-Quentin-sur-le-Homme
- The typical guest profile for Airbnb in Saint-Quentin-sur-le-Homme consists of primarily domestic travelers (78%), often arriving from nearby Paris, typically belonging to the Post-2000s (Gen Z/Alpha) group (50%), primarily speaking French or English.
- Domestic travelers account for 77.6% of guests.
- Key international markets include France (77.6%) and Belgium (5%).
- Top languages spoken are French (36.1%) followed by English (32.7%).
- A significant demographic segment is the Post-2000s (Gen Z/Alpha) group, representing 50% of guests.
Recommendations for Hosts
- Target domestic marketing efforts towards travelers from Paris and Tours.
- Tailor amenities and listing descriptions to appeal to the dominant Post-2000s (Gen Z/Alpha) demographic (e.g., highlight fast WiFi, smart home features, local guides).
- Highlight unique local experiences or amenities relevant to the primary guest profile.
- Consider seasonal promotions aligned with peak travel times for key origin markets.
Nearby Short-Term Rental Market Comparison
How does the Saint-Quentin-sur-le-Homme Airbnb market stack up against its neighbors? Compare key performance metrics like average monthly revenue, ADR, and occupancy rates in surrounding areas to understand the broader regional STR landscape.
| Market | Active Properties | Monthly Revenue | Daily Rate | Avg. Occupancy |
|---|---|---|---|---|
| St Martin | 14 | $4,074 | $436.70 | 51% |
| Moulins-le-Carbonnel | 11 | $3,213 | $320.85 | 35% |
| Gonneville-en-Auge | 12 | $3,061 | $235.90 | 40% |
| Vallon-sur-Gée | 11 | $2,913 | $379.01 | 30% |
| Saint Lawrence | 11 | $2,911 | $317.86 | 52% |
| Auberville | 22 | $2,777 | $249.63 | 36% |
| St Ouen | 15 | $2,635 | $339.51 | 51% |
| Chambellay | 11 | $2,525 | $255.24 | 34% |
| St Clement | 14 | $2,522 | $219.76 | 51% |
| Grouville | 21 | $2,510 | $218.40 | 52% |