Quinéville Airbnb Market Analysis 2025: Short Term Rental Data & Vacation Rental Statistics in Normandy, France
Is Airbnb profitable in Quinéville in 2025? Explore comprehensive Airbnb analytics for Quinéville, Normandy, France to uncover income potential. This 2025 STR market report for Quinéville, based on AirROI data from April 2024 to March 2025, reveals key trends in the niche market of 25 active listings.
Whether you're considering an Airbnb investment in Quinéville, optimizing your existing vacation rental, or exploring rental arbitrage opportunities, understanding the Quinéville Airbnb data is crucial. Leveraging the low regulation environment is key to maximizing your short term rental income potential. Let's dive into the specifics.
Key Quinéville Airbnb Performance Metrics Overview
Monthly Airbnb Revenue Variations & Income Potential in Quinéville (2025)
Understanding the monthly revenue variations for Airbnb listings in Quinéville is key to maximizing your short term rental income potential. Seasonality significantly impacts earnings. Our analysis, based on data from the past 12 months, shows that the peak revenue month for STRs in Quinéville is typically August, while January often presents the lowest earnings, highlighting opportunities for strategic pricing adjustments during shoulder and low seasons. Explore the typical Airbnb income in Quinéville across different performance tiers:
- Best-in-class properties (Top 10%) achieve $4,977+ monthly, often utilizing dynamic pricing and superior guest experiences.
- Strong performing properties (Top 25%) earn $2,365 or more, indicating effective management and desirable locations/amenities.
- Typical properties (Median) generate around $1,569 per month, representing the average market performance.
- Entry-level properties (Bottom 25%) see earnings around $956, often with potential for optimization.
Average Monthly Airbnb Earnings Trend in Quinéville
Quinéville Airbnb Occupancy Rate Trends (2025)
Maximize your bookings by understanding the Quinéville STR occupancy trends. Seasonal demand shifts significantly influence how often properties are booked. Typically, Augustsees the highest demand (peak season occupancy), while January experiences the lowest (low season). Effective strategies, like adjusting minimum stays or offering promotions, can boost occupancy during slower periods. Here's how different property tiers perform in Quinéville:
- Best-in-class properties (Top 10%) achieve 73%+ occupancy, indicating high desirability and potentially optimized availability.
- Strong performing properties (Top 25%) maintain 57% or higher occupancy, suggesting good market fit and guest satisfaction.
- Typical properties (Median) have an occupancy rate around 38%.
- Entry-level properties (Bottom 25%) average 25% occupancy, potentially facing higher vacancy.
Average Monthly Occupancy Rate Trend in Quinéville
Average Daily Rate (ADR) Airbnb Trends in Quinéville (2025)
Effective short term rental pricing strategy in Quinéville involves understanding monthly ADR fluctuations. The Average Daily Rate (ADR) for Airbnb in Quinéville typically peaks in July and dips lowest during March. Leveraging Airbnb dynamic pricing tools or strategies based on this seasonality can significantly boost revenue. Here's a look at the typical nightly rates achieved:
- Best-in-class properties (Top 10%) command rates of $301+ per night, often due to premium features or locations.
- Strong performing properties (Top 25%) achieve nightly rates of $180 or more.
- Typical properties (Median) charge around $119 per night.
- Entry-level properties (Bottom 25%) earn around $90 per night.
Average Daily Rate (ADR) Trend by Month in Quinéville
Get Live Quinéville Market Intelligence 👇

Explore Real-time Analytics
Airbnb Seasonality Analysis & Trends in Quinéville (2025)
Peak Season (August, July, June)
- Revenue averages $3,639 per month
- Occupancy rates average 69.2%
- Daily rates average $168
Shoulder Season
- Revenue averages $1,979 per month
- Occupancy maintains around 36.8%
- Daily rates hold near $150
Low Season (January, March, November)
- Revenue drops to average $1,188 per month
- Occupancy decreases to average 23.6%
- Daily rates adjust to average $136
Seasonality Insights for Quinéville
- The Airbnb seasonality in Quinéville shows highly seasonal trends requiring careful strategy. While the sections above show seasonal averages, it's also insightful to look at the extremes:
- During the high season, the absolute peak month showcases Quinéville's highest earning potential, with monthly revenues capable of climbing to $4,364, occupancy reaching a high of 85.8%, and ADRs peaking at $170.
- Conversely, the slowest single month of the year, typically falling within the low season, marks the market's lowest point. In this month, revenue might dip to $940, occupancy could drop to 15.2%, and ADRs may adjust down to $136.
- Understanding both the seasonal averages and these monthly peaks and troughs in revenue, occupancy, and ADR is crucial for maximizing your Airbnb profit potential in Quinéville.
Seasonal Strategies for Maximizing Profit
- Peak Season: Maximize revenue through premium pricing and potentially longer minimum stays. Ensure high availability.
- Low Season: Offer competitive pricing, special promotions (e.g., extended stay discounts), and flexible cancellation policies. Target off-season travelers like remote workers or budget-conscious guests.
- Shoulder Seasons: Implement dynamic pricing that balances peak and low rates. Target weekend travelers or specific events. Offer slightly more flexible terms than peak season.
- Regularly analyze your own performance against these Quinéville seasonality benchmarks and adjust your pricing and availability strategy accordingly.
Best Areas for Airbnb Investment in Quinéville (2025)
Exploring the top neighborhoods for short-term rentals in Quinéville? This section highlights key areas, outlining why they are attractive for hosts and guests, along with notable local attractions. Consider these locations based on your target guest profile and investment strategy.
| Neighborhood / Area | Why Host Here? (Target Guests & Appeal) | Key Attractions & Landmarks |
|---|---|---|
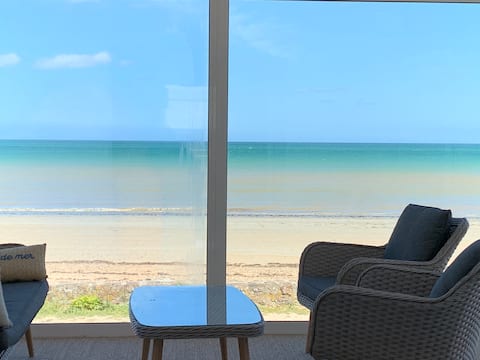
| Quinéville Beach | Beautiful sandy beach area perfect for families and beach lovers. The picturesque views and calm waters attract tourists looking for a relaxing seaside escape. | Quinéville Beach, Sea Kayaking, Tide Pool Exploration, Nearby Dunes, Beachside Cafes, Scenic Walking Trails |
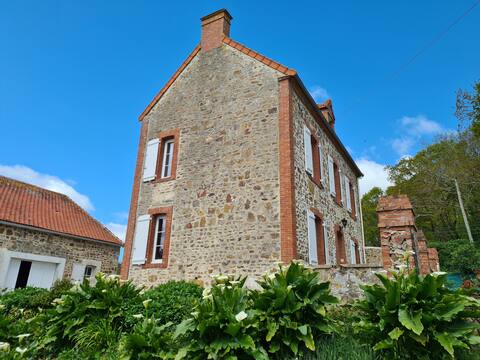
| Historical Quinéville | Rich in history, this area offers visitors a glimpse into the past with its historic sites and charming architecture. Ideal for history buffs and culture enthusiasts. | St. Mary Magdalene Church, Quinéville British War Cemetery, Local Museums, Heritage Tours, Traditional Shops, Cultural Events |
| Saint-Germain-de-Varreville | Close to Quinéville, this area provides access to local amenities and comforts. A great choice for visitors looking for both relaxation and convenience. | Local Markets, Restaurants, Bakeries, Public Parks, Community Events, Artisan Shops |
| Utah Beach | Famous for its historical significance during World War II, Utah Beach attracts visitors interested in history and beautiful coastal landscapes. | Utah Beach Museum, World War II History Tours, Beach Walks, Memorials, Bicycling Paths, Fisherman's Village |
| Carentan | A short drive from Quinéville, Carentan offers a mix of historical sites and modern amenities, making it a versatile location for travelers. | Carentan Market, Local Cuisine, Historic Landmarks, Waterfront Promenade, Canoeing Opportunities, Bicycle Tours |
| Barfleur | A charming fishing village nearby, Barfleur is known for its stunning port and beautiful architecture, drawing visitors looking for a quaint experience. | Barfleur Harbour, Seafood Restaurants, Local Artisans, Historic Lighthouses, Walking Paths by the Sea, Picnic Areas |
| Carteret | Located slightly further, Carteret offers stunning views of the coastline and is perfect for outdoor activities and family vacations. | Carteret Beach, Beachfront Restaurants, Surf Schools, Hiking Trails, Coastal Wildlife, Scenic Boat Rides |
| Cherbourg | A larger city that serves as a gateway to many other attractions in Normandy. Ideal for urban dwellers seeking culture, shopping, and entertainment. | Cité de la Mer, Cherbourg Port, Local Shopping District, Museums, Art Galleries, Theatre and Performances |
Understanding Airbnb License Requirements & STR Laws in Quinéville (2025)
While Quinéville, Normandy, France currently shows low STR regulations, specific Airbnb license requirements might still exist or change. Always verify the latest short term rental regulations and Airbnb license requirements directly with local government authorities for Quinéville to ensure full compliance before hosting.
(Source: AirROI data, 2025, based on 4% licensed listings)
Top Performing Airbnb Properties in Quinéville (2025)
Benchmark your potential! Explore examples of top-performing Airbnb properties in Quinévillebased on Trailing Twelve Month (TTM) revenue. Analyze their characteristics, revenue, occupancy rate, and ADR to understand what drives success in this market.
“HAVRE DES ISLES” Spacious beachfront house
Entire Place • 3 bedrooms

Family home with jacuzzi 50 m from the sea
Entire Place • 3 bedrooms

Large villa with pool and sea view
Entire Place • 5 bedrooms
House near beach disembarkation
Entire Place • 3 bedrooms
House, 50 m from the beach, view of the marshes.
Entire Place • 2 bedrooms

Family house with sea view- 6-8 people
Entire Place • 5 bedrooms
Note: Performance varies based on location, size, amenities, seasonality, and management quality. Data reflects the past 12 months.
Top Performing Airbnb Hosts in Quinéville (2025)
Learn from the best! This table showcases top-performing Airbnb hosts in Quinéville based on the number of properties managed and estimated total revenue over the past year. Analyze their scale and performance metrics.
| Host Name | Properties | Grossing Revenue | Stay Reviews | Avg Rating |
|---|---|---|---|---|
| Cyril | 1 | $99,333 | 69 | 4.99/5.0 |
| Laurent | 1 | $46,580 | 16 | 5.00/5.0 |
| Augustin | 1 | $33,610 | 32 | 4.84/5.0 |
| David | 1 | $28,601 | 7 | 5.00/5.0 |
| Christèle | 2 | $25,062 | 29 | 4.63/5.0 |
| Luc Et France | 1 | $20,387 | 54 | 4.65/5.0 |
| Odile | 1 | $18,428 | 3 | 5.00/5.0 |
| Josette | 1 | $18,425 | 12 | 4.92/5.0 |
| Séverine Et Arnaud | 1 | $18,212 | 312 | 4.89/5.0 |
| Pierre | 1 | $17,951 | 23 | 4.91/5.0 |
Analyzing the strategies of top hosts, such as their property selection, pricing, and guest communication, can offer valuable lessons for optimizing your own Airbnb operations in Quinéville.
Dive Deeper: Advanced Quinéville STR Market Data (2025)
Ready to unlock more insights? AirROI provides access to advanced metrics and comprehensive Airbnb data for Quinéville. Explore detailed analytics beyond this report to refine your investment strategy, optimize pricing, and maximize your vacation rental profits.
Explore Advanced MetricsQuinéville Short-Term Rental Market Composition (2025): Property & Room Types
Room Type Distribution
Property Type Distribution
Market Composition Insights for Quinéville
- The Quinéville Airbnb market composition is heavily skewed towards Entire Home/Apt listings, which make up 100% of the 25 active rentals. This indicates strong guest preference for privacy and space.
- Looking at the property type distribution in Quinéville, House properties are the most common (100%), reflecting the local real estate landscape.
- Houses represent a significant 100% portion, catering likely to families or larger groups.
Quinéville Airbnb Room Capacity Analysis (2025): Bedroom Distribution
Distribution of Listings by Number of Bedrooms
Room Capacity Insights for Quinéville
- The dominant room capacity in Quinéville is 3 bedrooms listings, making up 40% of the market. This suggests a strong demand for properties suitable for families or small groups.
- Together, 3 bedrooms and 2 bedrooms properties represent 72.0% of the active Airbnb listings in Quinéville, indicating a high concentration in these sizes.
- A significant 60.0% of listings offer 3+ bedrooms, catering to larger groups and families seeking more space in Quinéville.
Quinéville Vacation Rental Guest Capacity Trends (2025)
Distribution of Listings by Guest Capacity
Guest Capacity Insights for Quinéville
- The most common guest capacity trend in Quinéville vacation rentals is listings accommodating 6 guests (44%). This suggests the primary traveler segment is likely larger groups.
- Properties designed for 6 guests and 4 guests dominate the Quinéville STR market, accounting for 60.0% of listings.
- 68.0% of properties accommodate 6+ guests, serving the market segment for larger families or group travel in Quinéville.
- On average, properties in Quinéville are equipped to host 5.8 guests.
Quinéville Airbnb Booking Patterns (2025): Available vs. Booked Days
Available Days Distribution
Booked Days Distribution
Booking Pattern Insights for Quinéville
- The most common availability pattern in Quinéville falls within the 271-366 days range, representing 44% of listings. This suggests many properties have significant open periods on their calendars.
- Approximately 84.0% of listings show high availability (181+ days open annually), indicating potential for increased bookings or specific owner usage patterns.
- For booked days, the 91-180 days range is most frequent in Quinéville (40%), reflecting common guest stay durations or potential owner blocking patterns.
- A notable 20.0% of properties secure long booking periods (181+ days booked per year), highlighting successful long-term rental strategies or significant owner usage.
Quinéville Airbnb Minimum Stay Requirements Analysis
Distribution of Listings by Minimum Night Requirement
1 Night
1 listings
4% of total
2 Nights
8 listings
32% of total
3 Nights
5 listings
20% of total
4-6 Nights
7 listings
28% of total
7-29 Nights
2 listings
8% of total
30+ Nights
2 listings
8% of total
Key Insights
- The most prevalent minimum stay requirement in Quinéville is 2 Nights, adopted by 32% of listings. This highlights the market's preference for shorter, flexible bookings.
Recommendations
- Align with the market by considering a 2 Nights minimum stay, as 32% of Quinéville hosts use this setting.
- If feasible, allowing 1-night stays, especially midweek or during low season, could capture last-minute bookings, as only 4% currently do.
- A 2-night minimum appears standard (32%). Consider this for weekends or peak periods.
- Explore offering discounts for stays of 30+ nights to attract the 8% of the market seeking extended stays.
- Adjust minimum nights based on seasonality – potentially shorter during low season and longer during peak demand periods in Quinéville.
Quinéville Airbnb Cancellation Policy Trends Analysis (2025)
Flexible
8 listings
33.3% of total
Moderate
2 listings
8.3% of total
Firm
6 listings
25% of total
Strict
8 listings
33.3% of total
Cancellation Policy Insights for Quinéville
- The prevailing Airbnb cancellation policy trend in Quinéville is Flexible, used by 33.3% of listings.
- A majority (58.3%) of hosts in Quinéville utilize Firm or Strict policies, indicating a market where hosts prioritize booking security.
Recommendations for Hosts
- Consider adopting a Flexible policy to align with the 33.3% market standard in Quinéville.
- With 33.3% using Strict terms, this is a viable option in Quinéville, particularly for high-value properties or during peak demand periods.
- Regularly review your cancellation policy against competitors and market demand shifts in Quinéville.
Quinéville STR Booking Lead Time Analysis (2025)
Average Booking Lead Time by Month
Booking Lead Time Insights for Quinéville
- The overall average booking lead time for vacation rentals in Quinéville is 65 days.
- Guests book furthest in advance for stays during June (average 155 days), likely coinciding with peak travel demand or local events.
- The shortest booking windows occur for stays in December (average 44 days), indicating more last-minute travel plans during this time.
- Seasonally, Summer (138 days avg.) sees the longest lead times, while Winter (49 days avg.) has the shortest, reflecting typical travel planning cycles.
Recommendations for Hosts
- Use the overall average lead time (65 days) as a baseline for your pricing and availability strategy in Quinéville.
- For June stays, consider implementing length-of-stay discounts or slightly higher rates for bookings made less than 155 days out to capitalize on advance planning.
- Target marketing efforts for the Summer season well in advance (at least 138 days) to capture early planners.
- Monitor your own booking lead times against these Quinéville averages to identify opportunities for dynamic pricing adjustments.
Popular & Essential Airbnb Amenities in Quinéville (2025)
Amenity Prevalence
Amenity Insights for Quinéville
- Essential amenities in Quinéville that guests expect include: TV, Kitchen, Washer. Lacking these (any) could significantly impact bookings.
- Popular amenities like Heating, Free parking on premises, Dishes and silverware are common but not universal. Offering these can provide a competitive edge.
- Warning: Wifi is not universally provided but is considered essential globally. Ensure reliable Wifi is offered.
Recommendations for Hosts
- Ensure your listing includes all essential amenities for Quinéville: TV, Kitchen, Washer.
- Prioritize adding missing essentials: TV, Kitchen, Washer.
- Consider adding popular differentiators like Heating or Free parking on premises to increase appeal.
- Highlight unique or less common amenities you offer (e.g., hot tub, dedicated workspace, EV charger) in your listing description and photos.
- Regularly check competitor amenities in Quinéville to stay competitive.
Quinéville Airbnb Guest Demographics & Profile Analysis (2025)
Guest Profile Summary for Quinéville
- The typical guest profile for Airbnb in Quinéville consists of primarily domestic travelers (71%), often arriving from nearby Paris, typically belonging to the Post-2000s (Gen Z/Alpha) group (50%), primarily speaking French or English.
- Domestic travelers account for 70.6% of guests.
- Key international markets include France (70.6%) and United Kingdom (7.1%).
- Top languages spoken are French (40%) followed by English (37.5%).
- A significant demographic segment is the Post-2000s (Gen Z/Alpha) group, representing 50% of guests.
Recommendations for Hosts
- Target domestic marketing efforts towards travelers from Paris and England.
- Tailor amenities and listing descriptions to appeal to the dominant Post-2000s (Gen Z/Alpha) demographic (e.g., highlight fast WiFi, smart home features, local guides).
- Highlight unique local experiences or amenities relevant to the primary guest profile.
- Consider seasonal promotions aligned with peak travel times for key origin markets.
Nearby Short-Term Rental Market Comparison
How does the Quinéville Airbnb market stack up against its neighbors? Compare key performance metrics like average monthly revenue, ADR, and occupancy rates in surrounding areas to understand the broader regional STR landscape.
| Market | Active Properties | Monthly Revenue | Daily Rate | Avg. Occupancy |
|---|---|---|---|---|
| Winsham | 10 | $5,154 | $484.22 | 52% |
| Osmington | 32 | $4,097 | $279.33 | 55% |
| St Martin | 14 | $4,074 | $436.70 | 51% |
| Nettlestone | 26 | $3,980 | $391.99 | 42% |
| Crossways | 37 | $3,903 | $460.52 | 33% |
| West Lulworth | 59 | $3,559 | $262.94 | 50% |
| Furzehill | 12 | $3,537 | $256.32 | 47% |
| Shorwell | 28 | $3,511 | $283.08 | 45% |
| St Ives | 15 | $3,509 | $243.56 | 46% |
| Roedean | 47 | $3,494 | $257.09 | 47% |