Poses Airbnb Market Analysis 2025: Short Term Rental Data & Vacation Rental Statistics in Normandy, France
Is Airbnb profitable in Poses in 2025? Explore comprehensive Airbnb analytics for Poses, Normandy, France to uncover income potential. This 2025 STR market report for Poses, based on AirROI data from April 2024 to March 2025, reveals key trends in the niche market of 23 active listings.
Whether you're considering an Airbnb investment in Poses, optimizing your existing vacation rental, or exploring rental arbitrage opportunities, understanding the Poses Airbnb data is crucial. Leveraging the low regulation environment is key to maximizing your short term rental income potential. Let's dive into the specifics.
Key Poses Airbnb Performance Metrics Overview
Monthly Airbnb Revenue Variations & Income Potential in Poses (2025)
Understanding the monthly revenue variations for Airbnb listings in Poses is key to maximizing your short term rental income potential. Seasonality significantly impacts earnings. Our analysis, based on data from the past 12 months, shows that the peak revenue month for STRs in Poses is typically June, while January often presents the lowest earnings, highlighting opportunities for strategic pricing adjustments during shoulder and low seasons. Explore the typical Airbnb income in Poses across different performance tiers:
- Best-in-class properties (Top 10%) achieve $2,963+ monthly, often utilizing dynamic pricing and superior guest experiences.
- Strong performing properties (Top 25%) earn $1,743 or more, indicating effective management and desirable locations/amenities.
- Typical properties (Median) generate around $952 per month, representing the average market performance.
- Entry-level properties (Bottom 25%) see earnings around $526, often with potential for optimization.
Average Monthly Airbnb Earnings Trend in Poses
Poses Airbnb Occupancy Rate Trends (2025)
Maximize your bookings by understanding the Poses STR occupancy trends. Seasonal demand shifts significantly influence how often properties are booked. Typically, Junesees the highest demand (peak season occupancy), while January experiences the lowest (low season). Effective strategies, like adjusting minimum stays or offering promotions, can boost occupancy during slower periods. Here's how different property tiers perform in Poses:
- Best-in-class properties (Top 10%) achieve 64%+ occupancy, indicating high desirability and potentially optimized availability.
- Strong performing properties (Top 25%) maintain 44% or higher occupancy, suggesting good market fit and guest satisfaction.
- Typical properties (Median) have an occupancy rate around 32%.
- Entry-level properties (Bottom 25%) average 18% occupancy, potentially facing higher vacancy.
Average Monthly Occupancy Rate Trend in Poses
Average Daily Rate (ADR) Airbnb Trends in Poses (2025)
Effective short term rental pricing strategy in Poses involves understanding monthly ADR fluctuations. The Average Daily Rate (ADR) for Airbnb in Poses typically peaks in November and dips lowest during February. Leveraging Airbnb dynamic pricing tools or strategies based on this seasonality can significantly boost revenue. Here's a look at the typical nightly rates achieved:
- Best-in-class properties (Top 10%) command rates of $181+ per night, often due to premium features or locations.
- Strong performing properties (Top 25%) achieve nightly rates of $140 or more.
- Typical properties (Median) charge around $93 per night.
- Entry-level properties (Bottom 25%) earn around $49 per night.
Average Daily Rate (ADR) Trend by Month in Poses
Get Live Poses Market Intelligence 👇

Explore Real-time Analytics
Airbnb Seasonality Analysis & Trends in Poses (2025)
Peak Season (June, May, August)
- Revenue averages $2,049 per month
- Occupancy rates average 48.7%
- Daily rates average $101
Shoulder Season
- Revenue averages $1,325 per month
- Occupancy maintains around 34.7%
- Daily rates hold near $100
Low Season (January, February, November)
- Revenue drops to average $499 per month
- Occupancy decreases to average 18.7%
- Daily rates adjust to average $98
Seasonality Insights for Poses
- The Airbnb seasonality in Poses shows highly seasonal trends requiring careful strategy. While the sections above show seasonal averages, it's also insightful to look at the extremes:
- During the high season, the absolute peak month showcases Poses's highest earning potential, with monthly revenues capable of climbing to $2,233, occupancy reaching a high of 57.9%, and ADRs peaking at $109.
- Conversely, the slowest single month of the year, typically falling within the low season, marks the market's lowest point. In this month, revenue might dip to $420, occupancy could drop to 15.8%, and ADRs may adjust down to $91.
- Understanding both the seasonal averages and these monthly peaks and troughs in revenue, occupancy, and ADR is crucial for maximizing your Airbnb profit potential in Poses.
Seasonal Strategies for Maximizing Profit
- Peak Season: Maximize revenue through premium pricing and potentially longer minimum stays. Ensure high availability.
- Low Season: Offer competitive pricing, special promotions (e.g., extended stay discounts), and flexible cancellation policies. Target off-season travelers like remote workers or budget-conscious guests.
- Shoulder Seasons: Implement dynamic pricing that balances peak and low rates. Target weekend travelers or specific events. Offer slightly more flexible terms than peak season.
- Regularly analyze your own performance against these Poses seasonality benchmarks and adjust your pricing and availability strategy accordingly.
Best Areas for Airbnb Investment in Poses (2025)
Exploring the top neighborhoods for short-term rentals in Poses? This section highlights key areas, outlining why they are attractive for hosts and guests, along with notable local attractions. Consider these locations based on your target guest profile and investment strategy.
| Neighborhood / Area | Why Host Here? (Target Guests & Appeal) | Key Attractions & Landmarks |
|---|---|---|
| Villers-sur-Mer | Charming seaside town with beautiful beaches and a family-friendly atmosphere. Popular for summer vacations and close proximity to Deauville and Trouville. | Villers-sur-Mer Beach, Côte Fleurie, Parc Naturel des Marais, Casino de Villers, La Maison de la Nature |
| Deauville | Famous luxury resort town known for its beautiful beach, horse racing, and film festival. Attracts wealthy tourists and offers upscale amenities. | Deauville Beach, Les Planches, Casino Barrière, Deauville American Film Festival, Hippodrome de Deauville |
| Trouville-sur-Mer | Quaint coastal town with a lively market and vibrant boardwalk. Ideal for tourists looking for a traditional French beach experience. | Trouville Beach, Les Franciscaines, Port de Trouville, Market Hall, La Plage |
| Honfleur | Historic port town renowned for its artistic heritage and picturesque harbor. Attracts artists and tourists interested in culture and history. | Vieux Port, Saint Catherine's Church, Maisons Satie, Museum of Trouville, Naturospace |
| Cabourg | Charming coastal resort famous for its romantic beach and historical architecture. Popular for couples and families seeking a tranquil retreat. | Cabourg Beach, Promenade Marcel Proust, Grand Hotel Cabourg, Casino de Cabourg, Cabourg Marina |
| Lisieux | Historic town with significant religious sites and rich history. Suitable for visitors interested in culture and pilgrimage tourism. | Basilique Sainte-Thérèse, Lisieux Cathedral, Musee d'Art et d'Histoire, Saint-Pierre de Lisieux, Château de saint-Germain |
| Pont-l'Évêque | Quaint town known for its beautiful countryside and cheese production. Great for those looking to experience rural Normandy. | Pont-l’Évêque Lake, Cheese factory tours, Historical old town, Notre-Dame de Pont-l'Évêque, La Route du Cidre |
| Caen | Vibrant city with a rich history, famous for its historical sites and proximity to D-Day beaches. Ideal for history buffs and visitors interested in wartime history. | Caen Memorial Museum, Abbey of Saint-Étienne, Château de Caen, Jardin des Plantes, Eglise Saint-Pierre |
Understanding Airbnb License Requirements & STR Laws in Poses (2025)
While Poses, Normandy, France currently shows low STR regulations, specific Airbnb license requirements might still exist or change. Always verify the latest short term rental regulations and Airbnb license requirements directly with local government authorities for Poses to ensure full compliance before hosting.
(Source: AirROI data, 2025, based on 4% licensed listings)
Top Performing Airbnb Properties in Poses (2025)
Benchmark your potential! Explore examples of top-performing Airbnb properties in Posesbased on Trailing Twelve Month (TTM) revenue. Analyze their characteristics, revenue, occupancy rate, and ADR to understand what drives success in this market.

Charming Les Hirondelles cottage for 4 people
Entire Place • 2 bedrooms

House 6/8 people with veranda and garden
Entire Place • 3 bedrooms
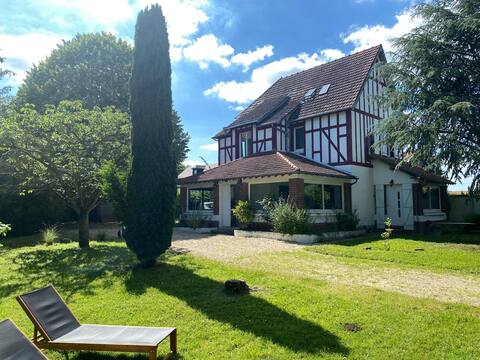
Maison Normande Bords de Seine -Collection Idylliq
Entire Place • 4 bedrooms

Le Gîte de Frêne *** Poses
Entire Place • 2 bedrooms
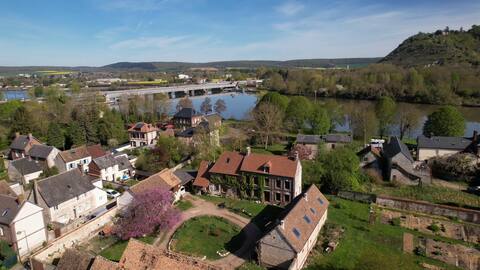
Charming Les Tourtereaux cottage for 2 people
Entire Place • 1 bedroom
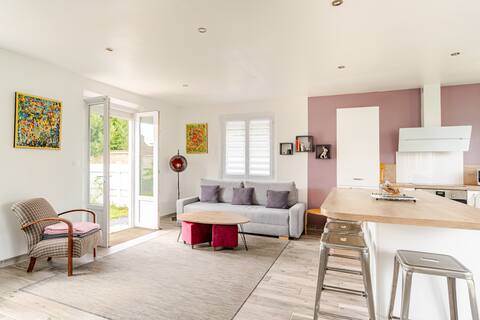
La petite maison de Poses ***
Entire Place • 1 bedroom
Note: Performance varies based on location, size, amenities, seasonality, and management quality. Data reflects the past 12 months.
Top Performing Airbnb Hosts in Poses (2025)
Learn from the best! This table showcases top-performing Airbnb hosts in Poses based on the number of properties managed and estimated total revenue over the past year. Analyze their scale and performance metrics.
| Host Name | Properties | Grossing Revenue | Stay Reviews | Avg Rating |
|---|---|---|---|---|
| Oxana | 2 | $48,053 | 16 | 5.00/5.0 |
| Yohan | 1 | $26,059 | 17 | 4.88/5.0 |
| Collection Idylliq | 1 | $24,460 | 3 | 5.00/5.0 |
| Marie Christine Et Philippe | 1 | $21,001 | 53 | 4.87/5.0 |
| Sophie David | 1 | $14,966 | 251 | 4.98/5.0 |
| Vincent | 1 | $14,836 | 4 | 5.00/5.0 |
| Host #384539776 | 5 | $14,149 | 0 | 0.00/5.0 |
| Matthias | 1 | $14,035 | 121 | 4.97/5.0 |
| Noëlle | 1 | $11,319 | 123 | 4.65/5.0 |
| Martine | 3 | $8,410 | 38 | 4.79/5.0 |
Analyzing the strategies of top hosts, such as their property selection, pricing, and guest communication, can offer valuable lessons for optimizing your own Airbnb operations in Poses.
Dive Deeper: Advanced Poses STR Market Data (2025)
Ready to unlock more insights? AirROI provides access to advanced metrics and comprehensive Airbnb data for Poses. Explore detailed analytics beyond this report to refine your investment strategy, optimize pricing, and maximize your vacation rental profits.
Explore Advanced MetricsPoses Short-Term Rental Market Composition (2025): Property & Room Types
Room Type Distribution
Property Type Distribution
Market Composition Insights for Poses
- The Poses Airbnb market composition is heavily skewed towards Entire Home/Apt listings, which make up 73.9% of the 23 active rentals. This indicates strong guest preference for privacy and space.
- Looking at the property type distribution in Poses, House properties are the most common (65.2%), reflecting the local real estate landscape.
- Houses represent a significant 65.2% portion, catering likely to families or larger groups.
- The presence of 8.7% Hotel/Boutique listings indicates integration with traditional hospitality.
- Smaller segments like outdoor/unique (combined 4.3%) offer potential for unique stay experiences.
Poses Airbnb Room Capacity Analysis (2025): Bedroom Distribution
Distribution of Listings by Number of Bedrooms
Room Capacity Insights for Poses
- The dominant room capacity in Poses is 2 bedrooms listings, making up 34.8% of the market. This suggests a strong demand for properties suitable for couples or solo travelers.
- Together, 2 bedrooms and 1 bedroom properties represent 65.2% of the active Airbnb listings in Poses, indicating a high concentration in these sizes.
Poses Vacation Rental Guest Capacity Trends (2025)
Distribution of Listings by Guest Capacity
Guest Capacity Insights for Poses
- The most common guest capacity trend in Poses vacation rentals is listings accommodating 4 guests (34.8%). This suggests the primary traveler segment is likely small families or groups.
- Properties designed for 4 guests and 2 guests dominate the Poses STR market, accounting for 47.8% of listings.
- 21.7% of properties accommodate 6+ guests, serving the market segment for larger families or group travel in Poses.
- On average, properties in Poses are equipped to host 3.4 guests.
Poses Airbnb Booking Patterns (2025): Available vs. Booked Days
Available Days Distribution
Booked Days Distribution
Booking Pattern Insights for Poses
- The most common availability pattern in Poses falls within the 271-366 days range, representing 52.2% of listings. This suggests many properties have significant open periods on their calendars.
- Approximately 100.0% of listings show high availability (181+ days open annually), indicating potential for increased bookings or specific owner usage patterns.
- For booked days, the 91-180 days range is most frequent in Poses (47.8%), reflecting common guest stay durations or potential owner blocking patterns.
- A notable 4.3% of properties secure long booking periods (181+ days booked per year), highlighting successful long-term rental strategies or significant owner usage.
Poses Airbnb Minimum Stay Requirements Analysis
Distribution of Listings by Minimum Night Requirement
1 Night
9 listings
50% of total
2 Nights
6 listings
33.3% of total
30+ Nights
3 listings
16.7% of total
Key Insights
- The most prevalent minimum stay requirement in Poses is 1 Night, adopted by 50% of listings. This highlights the market's preference for shorter, flexible bookings.
- A strong majority (83.3%) of the Poses Airbnb data shows acceptance of very short stays (1-2 nights), indicating a dynamic, high-turnover market.
- A significant segment (16.7%) caters to monthly stays (30+ nights) in Poses, pointing to opportunities in the extended-stay market.
Recommendations
- Align with the market by considering a 1 Night minimum stay, as 50% of Poses hosts use this setting.
- Explore offering discounts for stays of 30+ nights to attract the 16.7% of the market seeking extended stays.
- Adjust minimum nights based on seasonality – potentially shorter during low season and longer during peak demand periods in Poses.
Poses Airbnb Cancellation Policy Trends Analysis (2025)
Flexible
8 listings
47.1% of total
Moderate
4 listings
23.5% of total
Firm
4 listings
23.5% of total
Strict
1 listings
5.9% of total
Cancellation Policy Insights for Poses
- The prevailing Airbnb cancellation policy trend in Poses is Flexible, used by 47.1% of listings.
- The market strongly favors guest-friendly terms, with 70.6% of listings offering Flexible or Moderate policies. This suggests guests in Poses may expect booking flexibility.
- Strict cancellation policies are quite rare (5.9%), potentially making listings with this policy less competitive unless justified by high demand or property type.
Recommendations for Hosts
- Consider adopting a Flexible policy to align with the 47.1% market standard in Poses.
- Using a Strict policy might deter some guests, as only 5.9% of listings use it. Evaluate if potential revenue protection outweighs possible lower booking rates.
- Regularly review your cancellation policy against competitors and market demand shifts in Poses.
Poses STR Booking Lead Time Analysis (2025)
Average Booking Lead Time by Month
Booking Lead Time Insights for Poses
- The overall average booking lead time for vacation rentals in Poses is 46 days.
- Guests book furthest in advance for stays during July (average 65 days), likely coinciding with peak travel demand or local events.
- The shortest booking windows occur for stays in March (average 1 days), indicating more last-minute travel plans during this time.
- Seasonally, Winter (48 days avg.) sees the longest lead times, while Fall (21 days avg.) has the shortest, reflecting typical travel planning cycles.
Recommendations for Hosts
- Use the overall average lead time (46 days) as a baseline for your pricing and availability strategy in Poses.
- For July stays, consider implementing length-of-stay discounts or slightly higher rates for bookings made less than 65 days out to capitalize on advance planning.
- During March, focus on last-minute booking availability and promotions, as guests book with very short notice (1 days avg.).
- Target marketing efforts for the Winter season well in advance (at least 48 days) to capture early planners.
- Monitor your own booking lead times against these Poses averages to identify opportunities for dynamic pricing adjustments.
Popular & Essential Airbnb Amenities in Poses (2025)
Amenity Prevalence
Amenity Insights for Poses
- Essential amenities in Poses that guests expect include: Wifi, Heating, Kitchen, Hot water. Lacking these (any) could significantly impact bookings.
- Popular amenities like Outdoor dining area, Coffee maker, Wine glasses are common but not universal. Offering these can provide a competitive edge.
Recommendations for Hosts
- Ensure your listing includes all essential amenities for Poses: Wifi, Heating, Kitchen, Hot water.
- Prioritize adding missing essentials: Kitchen, Hot water.
- Consider adding popular differentiators like Outdoor dining area or Coffee maker to increase appeal.
- Highlight unique or less common amenities you offer (e.g., hot tub, dedicated workspace, EV charger) in your listing description and photos.
- Regularly check competitor amenities in Poses to stay competitive.
Poses Airbnb Guest Demographics & Profile Analysis (2025)
Guest Profile Summary for Poses
- The typical guest profile for Airbnb in Poses consists of primarily domestic travelers (70%), often arriving from nearby Paris, typically belonging to the Post-2000s (Gen Z/Alpha) group (50%), primarily speaking French or English.
- Domestic travelers account for 69.7% of guests.
- Key international markets include France (69.7%) and United Kingdom (14.5%).
- Top languages spoken are French (37.7%) followed by English (35.8%).
- A significant demographic segment is the Post-2000s (Gen Z/Alpha) group, representing 50% of guests.
Recommendations for Hosts
- Target domestic marketing efforts towards travelers from Paris and London.
- Tailor amenities and listing descriptions to appeal to the dominant Post-2000s (Gen Z/Alpha) demographic (e.g., highlight fast WiFi, smart home features, local guides).
- Highlight unique local experiences or amenities relevant to the primary guest profile.
- Consider seasonal promotions aligned with peak travel times for key origin markets.
Nearby Short-Term Rental Market Comparison
How does the Poses Airbnb market stack up against its neighbors? Compare key performance metrics like average monthly revenue, ADR, and occupancy rates in surrounding areas to understand the broader regional STR landscape.
| Market | Active Properties | Monthly Revenue | Daily Rate | Avg. Occupancy |
|---|---|---|---|---|
| Lo-Reninge | 12 | $6,193 | $432.10 | 49% |
| Morienval | 10 | $5,794 | $400.84 | 32% |
| La Poterie-Cap-d'Antifer | 11 | $5,076 | $293.95 | 55% |
| Bonneville-sur-Touques | 16 | $3,903 | $367.00 | 40% |
| Luneray | 12 | $3,745 | $526.24 | 42% |
| La Couture-Boussey | 12 | $3,620 | $378.08 | 28% |
| Dourdan | 15 | $3,576 | $223.06 | 52% |
| Rosoy-en-Multien | 15 | $3,558 | $367.61 | 51% |
| Saint-Étienne-la-Thillaye | 24 | $3,459 | $325.89 | 42% |
| Cricquebœuf | 10 | $3,417 | $268.29 | 46% |