Montsenelle Airbnb Market Analysis 2025: Short Term Rental Data & Vacation Rental Statistics in Normandy, France
Is Airbnb profitable in Montsenelle in 2025? Explore comprehensive Airbnb analytics for Montsenelle, Normandy, France to uncover income potential. This 2025 STR market report for Montsenelle, based on AirROI data from April 2024 to March 2025, reveals key trends in the niche market of 19 active listings.
Whether you're considering an Airbnb investment in Montsenelle, optimizing your existing vacation rental, or exploring rental arbitrage opportunities, understanding the Montsenelle Airbnb data is crucial. Understanding the local regulations is key to maximizing your short term rental income potential. Let's dive into the specifics.
Key Montsenelle Airbnb Performance Metrics Overview
Monthly Airbnb Revenue Variations & Income Potential in Montsenelle (2025)
Understanding the monthly revenue variations for Airbnb listings in Montsenelle is key to maximizing your short term rental income potential. Seasonality significantly impacts earnings. Our analysis, based on data from the past 12 months, shows that the peak revenue month for STRs in Montsenelle is typically May, while January often presents the lowest earnings, highlighting opportunities for strategic pricing adjustments during shoulder and low seasons. Explore the typical Airbnb income in Montsenelle across different performance tiers:
- Best-in-class properties (Top 10%) achieve $1,918+ monthly, often utilizing dynamic pricing and superior guest experiences.
- Strong performing properties (Top 25%) earn $1,386 or more, indicating effective management and desirable locations/amenities.
- Typical properties (Median) generate around $743 per month, representing the average market performance.
- Entry-level properties (Bottom 25%) see earnings around $386, often with potential for optimization.
Average Monthly Airbnb Earnings Trend in Montsenelle
Montsenelle Airbnb Occupancy Rate Trends (2025)
Maximize your bookings by understanding the Montsenelle STR occupancy trends. Seasonal demand shifts significantly influence how often properties are booked. Typically, Augustsees the highest demand (peak season occupancy), while April experiences the lowest (low season). Effective strategies, like adjusting minimum stays or offering promotions, can boost occupancy during slower periods. Here's how different property tiers perform in Montsenelle:
- Best-in-class properties (Top 10%) achieve 74%+ occupancy, indicating high desirability and potentially optimized availability.
- Strong performing properties (Top 25%) maintain 61% or higher occupancy, suggesting good market fit and guest satisfaction.
- Typical properties (Median) have an occupancy rate around 39%.
- Entry-level properties (Bottom 25%) average 25% occupancy, potentially facing higher vacancy.
Average Monthly Occupancy Rate Trend in Montsenelle
Average Daily Rate (ADR) Airbnb Trends in Montsenelle (2025)
Effective short term rental pricing strategy in Montsenelle involves understanding monthly ADR fluctuations. The Average Daily Rate (ADR) for Airbnb in Montsenelle typically peaks in November and dips lowest during April. Leveraging Airbnb dynamic pricing tools or strategies based on this seasonality can significantly boost revenue. Here's a look at the typical nightly rates achieved:
- Best-in-class properties (Top 10%) command rates of $140+ per night, often due to premium features or locations.
- Strong performing properties (Top 25%) achieve nightly rates of $126 or more.
- Typical properties (Median) charge around $101 per night.
- Entry-level properties (Bottom 25%) earn around $62 per night.
Average Daily Rate (ADR) Trend by Month in Montsenelle
Get Live Montsenelle Market Intelligence 👇

Explore Real-time Analytics
Airbnb Seasonality Analysis & Trends in Montsenelle (2025)
Peak Season (May, August, July)
- Revenue averages $1,552 per month
- Occupancy rates average 54.5%
- Daily rates average $94
Shoulder Season
- Revenue averages $879 per month
- Occupancy maintains around 38.5%
- Daily rates hold near $97
Low Season (January, February, November)
- Revenue drops to average $488 per month
- Occupancy decreases to average 38.4%
- Daily rates adjust to average $100
Seasonality Insights for Montsenelle
- The Airbnb seasonality in Montsenelle shows highly seasonal trends requiring careful strategy. While the sections above show seasonal averages, it's also insightful to look at the extremes:
- During the high season, the absolute peak month showcases Montsenelle's highest earning potential, with monthly revenues capable of climbing to $1,605, occupancy reaching a high of 58.0%, and ADRs peaking at $102.
- Conversely, the slowest single month of the year, typically falling within the low season, marks the market's lowest point. In this month, revenue might dip to $436, occupancy could drop to 29.0%, and ADRs may adjust down to $93.
- Understanding both the seasonal averages and these monthly peaks and troughs in revenue, occupancy, and ADR is crucial for maximizing your Airbnb profit potential in Montsenelle.
Seasonal Strategies for Maximizing Profit
- Peak Season: Maximize revenue through premium pricing and potentially longer minimum stays. Ensure high availability.
- Low Season: Offer competitive pricing, special promotions (e.g., extended stay discounts), and flexible cancellation policies. Target off-season travelers like remote workers or budget-conscious guests.
- Shoulder Seasons: Implement dynamic pricing that balances peak and low rates. Target weekend travelers or specific events. Offer slightly more flexible terms than peak season.
- Regularly analyze your own performance against these Montsenelle seasonality benchmarks and adjust your pricing and availability strategy accordingly.
Best Areas for Airbnb Investment in Montsenelle (2025)
Exploring the top neighborhoods for short-term rentals in Montsenelle? This section highlights key areas, outlining why they are attractive for hosts and guests, along with notable local attractions. Consider these locations based on your target guest profile and investment strategy.
| Neighborhood / Area | Why Host Here? (Target Guests & Appeal) | Key Attractions & Landmarks |
|---|---|---|
| Étretat | Famous for its stunning chalk cliffs and beautiful beaches, Étretat attracts tourists looking for picturesque views and outdoor activities. Ideal for nature lovers and those seeking relaxation by the sea. | Étretat Cliffs, Falaise d'Amont, The Aiguille, Étretat Beach, The Gardens of Étretat |
| Honfleur | A charming port town with a rich history and beautiful architecture, Honfleur is popular among tourists for its art scene and vibrant harbor. Perfect for visitors looking for culture and scenic views. | Vieux Bassin, Sainte-Catherine's Church, Honfleur's Art Museum, The Lieutenancy, Museum of Ethnography |
| Cabourg | Known for its elegant architecture and sandy beaches, Cabourg is a classic seaside resort that attracts families and couples wanting a romantic getaway by the sea. | Cabourg Beach, Les Halles de Cabourg, Grand Hôtel Cabourg, Cabourg Casino, Promenade Marcel Proust |
| Deauville | An upscale resort town renowned for its beaches, cinema, and horse racing. Deauville is a hotspot for luxury travelers and celebrities, offering a glamorous experience close to Paris. | Deauville Beach, Promenade des Planches, Deauville Casino, Deauville American Film Festival, Hippodrome de Deauville |
| Rouen | The historic capital of Normandy, Rouen is known for its medieval architecture and rich history. Ideal for visitors interested in culture, art, and history. | Rouen Cathedral, Gros Horloge, Musée des Beaux-Arts, Place du Vieux Marché, The Joan of Arc Historial |
| Bayeux | Home to the famous Bayeux Tapestry, this town offers a glimpse into Normandy's medieval history and is a key location for tourists visiting the D-Day beaches. | Bayeux Tapestry Museum, Bayeux Cathedral, British War Cemetery, Garden of the Museum, Ferme de la Rançonnière |
| Fécamp | A town with stunning coastal scenery and historical sites, Fécamp attracts visitors for its maritime heritage and beautiful seaside walks. | Fécamp Abbey, Les Grandes Dalles, Fécamp Beach, Palais Bénédictine, The musée des Terre-Neuvas et de la pêche |
| Caen | The capital of Calvados, Caen is a vibrant city with a rich history, perfect for tourists interested in Normandy's legacy and culture. | Caen Memorial Museum, Abbey of Saint-Étienne, Château de Caen, Museum of Fine Arts, Jardin des Plantes |
Understanding Airbnb License Requirements & STR Laws in Montsenelle (2025)
With 16% of listings showing registration in 2025, understanding potential Airbnb license requirements is crucial in Montsenelle. Always verify the latest short term rental regulations and Airbnb license requirements directly with local government authorities for Montsenelle to ensure full compliance before hosting.
(Source: AirROI data, 2025, based on 16% licensed listings)
Top Performing Airbnb Properties in Montsenelle (2025)
Benchmark your potential! Explore examples of top-performing Airbnb properties in Montsenellebased on Trailing Twelve Month (TTM) revenue. Analyze their characteristics, revenue, occupancy rate, and ADR to understand what drives success in this market.
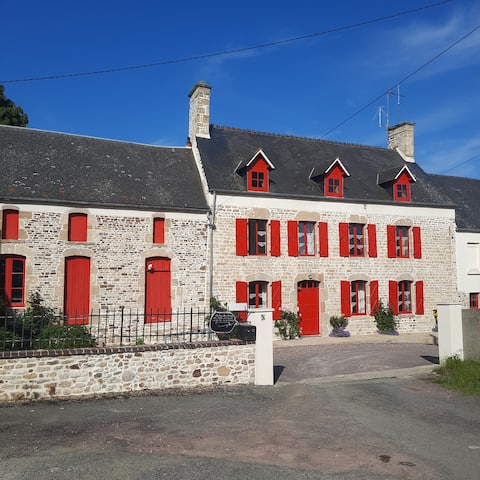
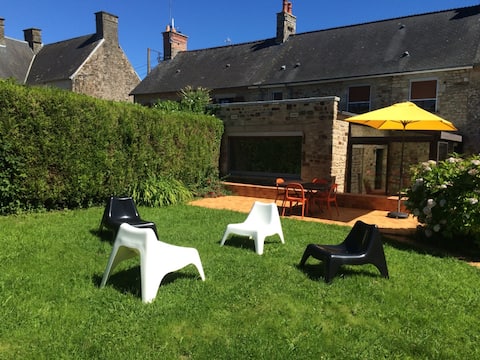
Maison Normande in the heart of Cotentin
Entire Place • 4 bedrooms
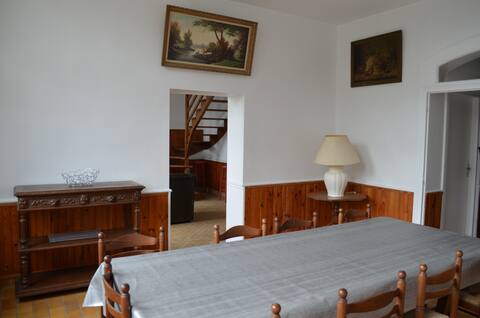
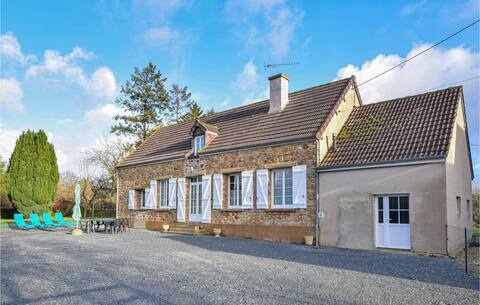
Large country lodge
Entire Place • 5 bedrooms
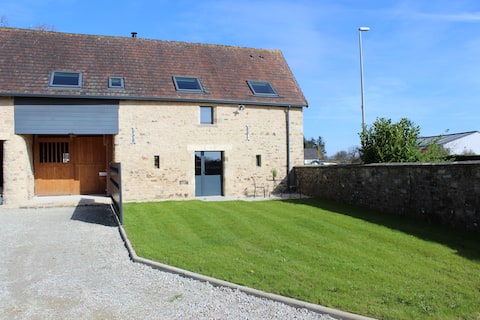
Gite de la Garde
Entire Place • 2 bedrooms
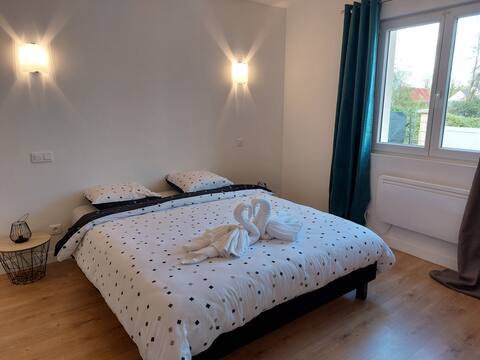
Nice house between Land and Sea
Entire Place • 3 bedrooms
3 bedroom lodge
Entire Place • 3 bedrooms
4 bedroom cozy home in Montsenelle
Entire Place • 4 bedrooms
Note: Performance varies based on location, size, amenities, seasonality, and management quality. Data reflects the past 12 months.
Top Performing Airbnb Hosts in Montsenelle (2025)
Learn from the best! This table showcases top-performing Airbnb hosts in Montsenelle based on the number of properties managed and estimated total revenue over the past year. Analyze their scale and performance metrics.
| Host Name | Properties | Grossing Revenue | Stay Reviews | Avg Rating |
|---|---|---|---|---|
| Valerie | 5 | $38,379 | 747 | 4.91/5.0 |
| Sabrina | 1 | $16,473 | 39 | 4.74/5.0 |
| Vincent | 1 | $14,363 | 13 | 5.00/5.0 |
| Emilie | 1 | $13,088 | 12 | 4.83/5.0 |
| Joanne | 2 | $10,881 | 39 | 4.83/5.0 |
| Host #70882199 | 1 | $10,688 | 87 | 4.78/5.0 |
| Host #154026976 | 1 | $8,680 | 1 | 0.00/5.0 |
| Erika | 1 | $8,140 | 17 | 5.00/5.0 |
| Novasol | 1 | $7,952 | 6 | 4.00/5.0 |
| Host #69454619 | 1 | $7,255 | 37 | 4.27/5.0 |
Analyzing the strategies of top hosts, such as their property selection, pricing, and guest communication, can offer valuable lessons for optimizing your own Airbnb operations in Montsenelle.
Dive Deeper: Advanced Montsenelle STR Market Data (2025)
Ready to unlock more insights? AirROI provides access to advanced metrics and comprehensive Airbnb data for Montsenelle. Explore detailed analytics beyond this report to refine your investment strategy, optimize pricing, and maximize your vacation rental profits.
Explore Advanced MetricsMontsenelle Short-Term Rental Market Composition (2025): Property & Room Types
Room Type Distribution
Property Type Distribution
Market Composition Insights for Montsenelle
- The Montsenelle Airbnb market composition is heavily skewed towards Entire Home/Apt listings, which make up 78.9% of the 19 active rentals. This indicates strong guest preference for privacy and space.
- Looking at the property type distribution in Montsenelle, House properties are the most common (84.2%), reflecting the local real estate landscape.
- Houses represent a significant 84.2% portion, catering likely to families or larger groups.
Montsenelle Airbnb Room Capacity Analysis (2025): Bedroom Distribution
Distribution of Listings by Number of Bedrooms
Room Capacity Insights for Montsenelle
- The dominant room capacity in Montsenelle is 3 bedrooms listings, making up 31.6% of the market. This suggests a strong demand for properties suitable for families or small groups.
- Together, 3 bedrooms and 2 bedrooms properties represent 47.4% of the active Airbnb listings in Montsenelle, indicating a high concentration in these sizes.
- A significant 52.7% of listings offer 3+ bedrooms, catering to larger groups and families seeking more space in Montsenelle.
Montsenelle Vacation Rental Guest Capacity Trends (2025)
Distribution of Listings by Guest Capacity
Guest Capacity Insights for Montsenelle
- The most common guest capacity trend in Montsenelle vacation rentals is listings accommodating 8+ guests (31.6%). This suggests the primary traveler segment is likely larger groups.
- Properties designed for 8+ guests and 4 guests dominate the Montsenelle STR market, accounting for 52.7% of listings.
- 42.1% of properties accommodate 6+ guests, serving the market segment for larger families or group travel in Montsenelle.
- On average, properties in Montsenelle are equipped to host 4.6 guests.
Montsenelle Airbnb Booking Patterns (2025): Available vs. Booked Days
Available Days Distribution
Booked Days Distribution
Booking Pattern Insights for Montsenelle
- The most common availability pattern in Montsenelle falls within the 271-366 days range, representing 47.4% of listings. This suggests many properties have significant open periods on their calendars.
- Approximately 79.0% of listings show high availability (181+ days open annually), indicating potential for increased bookings or specific owner usage patterns.
- For booked days, the 91-180 days range is most frequent in Montsenelle (31.6%), reflecting common guest stay durations or potential owner blocking patterns.
- A notable 21.1% of properties secure long booking periods (181+ days booked per year), highlighting successful long-term rental strategies or significant owner usage.
Montsenelle Airbnb Minimum Stay Requirements Analysis
Distribution of Listings by Minimum Night Requirement
1 Night
1 listings
5.9% of total
2 Nights
12 listings
70.6% of total
7-29 Nights
1 listings
5.9% of total
30+ Nights
3 listings
17.6% of total
Key Insights
- The most prevalent minimum stay requirement in Montsenelle is 2 Nights, adopted by 70.6% of listings. This highlights the market's preference for shorter, flexible bookings.
- A strong majority (76.5%) of the Montsenelle Airbnb data shows acceptance of very short stays (1-2 nights), indicating a dynamic, high-turnover market.
- A significant segment (17.6%) caters to monthly stays (30+ nights) in Montsenelle, pointing to opportunities in the extended-stay market.
Recommendations
- Align with the market by considering a 2 Nights minimum stay, as 70.6% of Montsenelle hosts use this setting.
- If feasible, allowing 1-night stays, especially midweek or during low season, could capture last-minute bookings, as only 5.9% currently do.
- A 2-night minimum appears standard (70.6%). Consider this for weekends or peak periods.
- Explore offering discounts for stays of 30+ nights to attract the 17.6% of the market seeking extended stays.
- Adjust minimum nights based on seasonality – potentially shorter during low season and longer during peak demand periods in Montsenelle.
Montsenelle Airbnb Cancellation Policy Trends Analysis (2025)
Super Strict 60 Days
1 listings
5.9% of total
Flexible
5 listings
29.4% of total
Moderate
6 listings
35.3% of total
Firm
1 listings
5.9% of total
Strict
4 listings
23.5% of total
Cancellation Policy Insights for Montsenelle
- The prevailing Airbnb cancellation policy trend in Montsenelle is Moderate, used by 35.3% of listings.
- There's a relatively balanced mix between guest-friendly (64.7%) and stricter (29.4%) policies, offering choices for different guest needs.
Recommendations for Hosts
- Consider adopting a Moderate policy to align with the 35.3% market standard in Montsenelle.
- Regularly review your cancellation policy against competitors and market demand shifts in Montsenelle.
Montsenelle STR Booking Lead Time Analysis (2025)
Average Booking Lead Time by Month
Booking Lead Time Insights for Montsenelle
- The overall average booking lead time for vacation rentals in Montsenelle is 72 days.
- Guests book furthest in advance for stays during June (average 147 days), likely coinciding with peak travel demand or local events.
- The shortest booking windows occur for stays in March (average 15 days), indicating more last-minute travel plans during this time.
- Seasonally, Summer (93 days avg.) sees the longest lead times, while Spring (39 days avg.) has the shortest, reflecting typical travel planning cycles.
Recommendations for Hosts
- Use the overall average lead time (72 days) as a baseline for your pricing and availability strategy in Montsenelle.
- For June stays, consider implementing length-of-stay discounts or slightly higher rates for bookings made less than 147 days out to capitalize on advance planning.
- Target marketing efforts for the Summer season well in advance (at least 93 days) to capture early planners.
- Monitor your own booking lead times against these Montsenelle averages to identify opportunities for dynamic pricing adjustments.
Popular & Essential Airbnb Amenities in Montsenelle (2025)
Amenity Prevalence
Amenity Insights for Montsenelle
- Essential amenities in Montsenelle that guests expect include: Free parking on premises, Kitchen. Lacking these (any) could significantly impact bookings.
- Popular amenities like Hangers, TV, Refrigerator are common but not universal. Offering these can provide a competitive edge.
Recommendations for Hosts
- Ensure your listing includes all essential amenities for Montsenelle: Free parking on premises, Kitchen.
- Consider adding popular differentiators like Hangers or TV to increase appeal.
- Highlight unique or less common amenities you offer (e.g., hot tub, dedicated workspace, EV charger) in your listing description and photos.
- Regularly check competitor amenities in Montsenelle to stay competitive.
Montsenelle Airbnb Guest Demographics & Profile Analysis (2025)
Guest Profile Summary for Montsenelle
- The typical guest profile for Airbnb in Montsenelle consists of primarily domestic travelers (86%), often arriving from nearby Paris, typically belonging to the Post-2000s (Gen Z/Alpha) group (50%), primarily speaking French or English.
- Domestic travelers account for 85.7% of guests.
- Key international markets include France (85.7%) and United Kingdom (3.8%).
- Top languages spoken are French (36.4%) followed by English (30%).
- A significant demographic segment is the Post-2000s (Gen Z/Alpha) group, representing 50% of guests.
Recommendations for Hosts
- Target domestic marketing efforts towards travelers from Paris and Marseille.
- Tailor amenities and listing descriptions to appeal to the dominant Post-2000s (Gen Z/Alpha) demographic (e.g., highlight fast WiFi, smart home features, local guides).
- Highlight unique local experiences or amenities relevant to the primary guest profile.
- Consider seasonal promotions aligned with peak travel times for key origin markets.
Nearby Short-Term Rental Market Comparison
How does the Montsenelle Airbnb market stack up against its neighbors? Compare key performance metrics like average monthly revenue, ADR, and occupancy rates in surrounding areas to understand the broader regional STR landscape.
| Market | Active Properties | Monthly Revenue | Daily Rate | Avg. Occupancy |
|---|---|---|---|---|
| Winsham | 10 | $5,154 | $484.22 | 52% |
| Osmington | 32 | $4,097 | $279.33 | 55% |
| St Martin | 14 | $4,074 | $436.70 | 51% |
| Nettlestone | 26 | $3,980 | $391.99 | 42% |
| Crossways | 37 | $3,903 | $460.52 | 33% |
| West Lulworth | 59 | $3,559 | $262.94 | 50% |
| Furzehill | 12 | $3,537 | $256.32 | 47% |
| Shorwell | 28 | $3,511 | $283.08 | 45% |
| St Ives | 15 | $3,509 | $243.56 | 46% |
| Roedean | 47 | $3,494 | $257.09 | 47% |