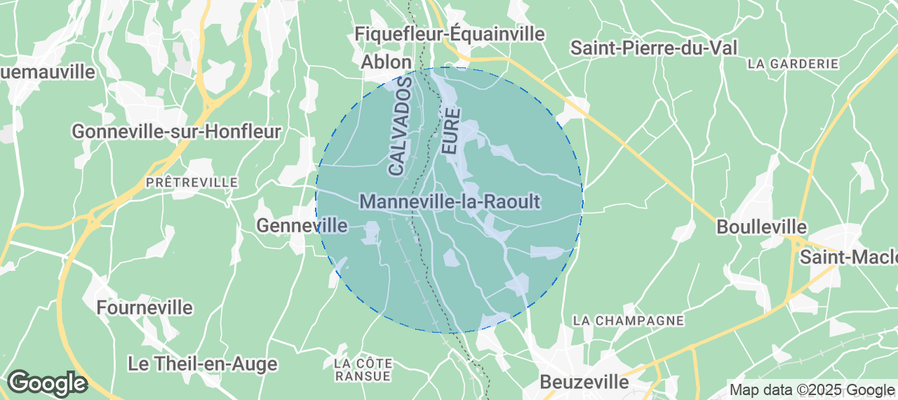
Manneville-la-Raoult Airbnb Market Analysis 2025: Short Term Rental Data & Vacation Rental Statistics in Normandy, France
Is Airbnb profitable in Manneville-la-Raoult in 2025? Explore comprehensive Airbnb analytics for Manneville-la-Raoult, Normandy, France to uncover income potential. This 2025 STR market report for Manneville-la-Raoult, based on AirROI data from April 2024 to March 2025, reveals key trends in the niche market of 24 active listings.
Whether you're considering an Airbnb investment in Manneville-la-Raoult, optimizing your existing vacation rental, or exploring rental arbitrage opportunities, understanding the Manneville-la-Raoult Airbnb data is crucial. Leveraging the low regulation environment is key to maximizing your short term rental income potential. Let's dive into the specifics.
Key Manneville-la-Raoult Airbnb Performance Metrics Overview
Monthly Airbnb Revenue Variations & Income Potential in Manneville-la-Raoult (2025)
Understanding the monthly revenue variations for Airbnb listings in Manneville-la-Raoult is key to maximizing your short term rental income potential. Seasonality significantly impacts earnings. Our analysis, based on data from the past 12 months, shows that the peak revenue month for STRs in Manneville-la-Raoult is typically August, while February often presents the lowest earnings, highlighting opportunities for strategic pricing adjustments during shoulder and low seasons. Explore the typical Airbnb income in Manneville-la-Raoult across different performance tiers:
- Best-in-class properties (Top 10%) achieve $4,851+ monthly, often utilizing dynamic pricing and superior guest experiences.
- Strong performing properties (Top 25%) earn $2,954 or more, indicating effective management and desirable locations/amenities.
- Typical properties (Median) generate around $1,550 per month, representing the average market performance.
- Entry-level properties (Bottom 25%) see earnings around $738, often with potential for optimization.
Average Monthly Airbnb Earnings Trend in Manneville-la-Raoult
Manneville-la-Raoult Airbnb Occupancy Rate Trends (2025)
Maximize your bookings by understanding the Manneville-la-Raoult STR occupancy trends. Seasonal demand shifts significantly influence how often properties are booked. Typically, Augustsees the highest demand (peak season occupancy), while March experiences the lowest (low season). Effective strategies, like adjusting minimum stays or offering promotions, can boost occupancy during slower periods. Here's how different property tiers perform in Manneville-la-Raoult:
- Best-in-class properties (Top 10%) achieve 65%+ occupancy, indicating high desirability and potentially optimized availability.
- Strong performing properties (Top 25%) maintain 46% or higher occupancy, suggesting good market fit and guest satisfaction.
- Typical properties (Median) have an occupancy rate around 28%.
- Entry-level properties (Bottom 25%) average 17% occupancy, potentially facing higher vacancy.
Average Monthly Occupancy Rate Trend in Manneville-la-Raoult
Average Daily Rate (ADR) Airbnb Trends in Manneville-la-Raoult (2025)
Effective short term rental pricing strategy in Manneville-la-Raoult involves understanding monthly ADR fluctuations. The Average Daily Rate (ADR) for Airbnb in Manneville-la-Raoult typically peaks in July and dips lowest during October. Leveraging Airbnb dynamic pricing tools or strategies based on this seasonality can significantly boost revenue. Here's a look at the typical nightly rates achieved:
- Best-in-class properties (Top 10%) command rates of $364+ per night, often due to premium features or locations.
- Strong performing properties (Top 25%) achieve nightly rates of $244 or more.
- Typical properties (Median) charge around $123 per night.
- Entry-level properties (Bottom 25%) earn around $106 per night.
Average Daily Rate (ADR) Trend by Month in Manneville-la-Raoult
Get Live Manneville-la-Raoult Market Intelligence 👇
Explore Real-time Analytics
Airbnb Seasonality Analysis & Trends in Manneville-la-Raoult (2025)
Peak Season (August, July, April)
- Revenue averages $3,419 per month
- Occupancy rates average 56.5%
- Daily rates average $190
Shoulder Season
- Revenue averages $2,007 per month
- Occupancy maintains around 30.9%
- Daily rates hold near $189
Low Season (January, February, October)
- Revenue drops to average $1,206 per month
- Occupancy decreases to average 20.7%
- Daily rates adjust to average $187
Seasonality Insights for Manneville-la-Raoult
- The Airbnb seasonality in Manneville-la-Raoult shows highly seasonal trends requiring careful strategy. While the sections above show seasonal averages, it's also insightful to look at the extremes:
- During the high season, the absolute peak month showcases Manneville-la-Raoult's highest earning potential, with monthly revenues capable of climbing to $3,856, occupancy reaching a high of 74.3%, and ADRs peaking at $192.
- Conversely, the slowest single month of the year, typically falling within the low season, marks the market's lowest point. In this month, revenue might dip to $1,115, occupancy could drop to 18.6%, and ADRs may adjust down to $184.
- Understanding both the seasonal averages and these monthly peaks and troughs in revenue, occupancy, and ADR is crucial for maximizing your Airbnb profit potential in Manneville-la-Raoult.
Seasonal Strategies for Maximizing Profit
- Peak Season: Maximize revenue through premium pricing and potentially longer minimum stays. Ensure high availability.
- Low Season: Offer competitive pricing, special promotions (e.g., extended stay discounts), and flexible cancellation policies. Target off-season travelers like remote workers or budget-conscious guests.
- Shoulder Seasons: Implement dynamic pricing that balances peak and low rates. Target weekend travelers or specific events. Offer slightly more flexible terms than peak season.
- Regularly analyze your own performance against these Manneville-la-Raoult seasonality benchmarks and adjust your pricing and availability strategy accordingly.
Best Areas for Airbnb Investment in Manneville-la-Raoult (2025)
Exploring the top neighborhoods for short-term rentals in Manneville-la-Raoult? This section highlights key areas, outlining why they are attractive for hosts and guests, along with notable local attractions. Consider these locations based on your target guest profile and investment strategy.
| Neighborhood / Area | Why Host Here? (Target Guests & Appeal) | Key Attractions & Landmarks |
|---|---|---|
| Etretat | Famous for its stunning cliffs and natural beauty, Etretat is a popular destination for tourists seeking picturesque views and outdoor activities. | Cliffs of Etretat, Etretat Beach, Aiguille Creuse, Notre-Dame de la Garde Chapel, Gardens of Etretat |
| Honfleur | A charming port town known for its beautiful harbor and well-preserved historic architecture. Ideal for those looking for a mix of culture and coastal beauty. | Vieux Bassin, Saint-Catherine's Church, Honfleur Museum, Naturospace, Sainte-Catherine's Place |
| Deauville | Known for its luxurious beach resorts and vibrant festivals, Deauville is a popular destination for upscale tourists and international visitors. | Deauville Beach, Deauville Casino, Promenade des Planches, Deauville Polo Club, L'essentiel Restaurant |
| Rouen | Rich in history and culture, Rouen is known for its beautiful medieval architecture and proximity to the Seine. A great location for both cultural and urban experiences. | Rouen Cathedral, Gros Horloge, Museum of Fine Arts, Rue Saint-Romain, Church of Saint-Maclou |
| Lisieux | Famous for its basilica and connection to St. Thérèse, Lisieux attracts religious tourism and those seeking a quiet, historic experience. | Basilica of St. Thérèse, Lisieux Museum, Saint Pierre Cathedral, Cemetery of Lisieux, La Chapelle de la Visitation |
| Fécamp | A coastal town known for its maritime history and beautiful scenery, Fécamp is ideal for those seeking outdoor activities and exploration. | Fécamp Beach, Palais Bénédictine, Chapelle Notre-Dame du Salut, Les Grandes Dalles, Fishermen's Museum |
| Villers-sur-Mer | A charming seaside resort that offers a more relaxed atmosphere along with beautiful beaches and family-friendly activities. | Villers-sur-Mer Beach, La Chaufferie, Nature Reserve of Villers-sur-Mer, Villers-sur-Mer Market, La Promenade |
| Cabourg | Known for its romantic atmosphere and beautiful beach, Cabourg attracts couples and families seeking a classic French seaside experience. | Cabourg Beach, Grand Hotel Cabourg, Promenade Marcel Proust, Cabourg Casino, Hippodrome de Cabourg |
Understanding Airbnb License Requirements & STR Laws in Manneville-la-Raoult (2025)
While Manneville-la-Raoult, Normandy, France currently shows low STR regulations, specific Airbnb license requirements might still exist or change. Always verify the latest short term rental regulations and Airbnb license requirements directly with local government authorities for Manneville-la-Raoult to ensure full compliance before hosting.
(Source: AirROI data, 2025, finding no licensed listings among those analyzed)
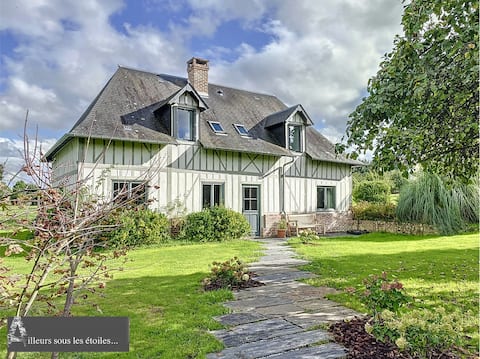
Top Performing Airbnb Properties in Manneville-la-Raoult (2025)
Benchmark your potential! Explore examples of top-performing Airbnb properties in Manneville-la-Raoultbased on Trailing Twelve Month (TTM) revenue. Analyze their characteristics, revenue, occupancy rate, and ADR to understand what drives success in this market.

Fleurs De Mai Cottage Heated Pool Playgrounds View
Entire Place • 4 bedrooms
Gite for up to 6 with private garden
Entire Place • 3 bedrooms
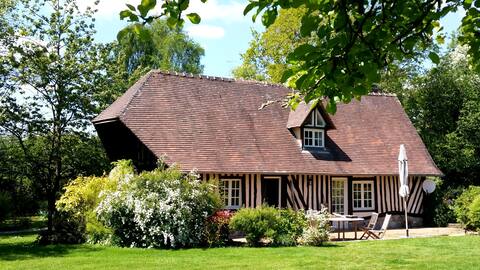
Normandy cottage 10 minutes from Honfleur
Entire Place • 2 bedrooms
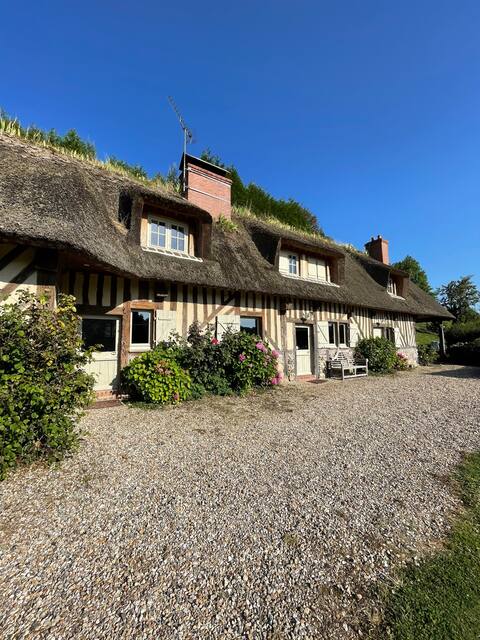
La Maison des Souvenirs
Entire Place • 3 bedrooms
Normandy house with swimming pool and wooded garden
Entire Place • 3 bedrooms
2-person cottage 30 m2 10 minutes from Honfleur
Entire Place • 1 bedroom
Note: Performance varies based on location, size, amenities, seasonality, and management quality. Data reflects the past 12 months.
Top Performing Airbnb Hosts in Manneville-la-Raoult (2025)
Learn from the best! This table showcases top-performing Airbnb hosts in Manneville-la-Raoult based on the number of properties managed and estimated total revenue over the past year. Analyze their scale and performance metrics.
| Host Name | Properties | Grossing Revenue | Stay Reviews | Avg Rating |
|---|---|---|---|---|
| Laurent | 5 | $109,539 | 20 | 3.77/5.0 |
| Evelyne | 2 | $62,108 | 185 | 4.98/5.0 |
| Chic Rentals | 1 | $60,945 | 30 | 4.97/5.0 |
| Mypacome | 1 | $29,754 | 3 | 5.00/5.0 |
| Fred | 1 | $29,161 | 6 | 4.83/5.0 |
| Moune | 1 | $22,928 | 26 | 4.92/5.0 |
| Louis | 1 | $21,156 | 64 | 4.63/5.0 |
| Catherine | 1 | $19,771 | 40 | 5.00/5.0 |
| Maryse | 1 | $19,455 | 38 | 4.95/5.0 |
| Pascal | 1 | $18,367 | 3 | 4.67/5.0 |
Analyzing the strategies of top hosts, such as their property selection, pricing, and guest communication, can offer valuable lessons for optimizing your own Airbnb operations in Manneville-la-Raoult.
Dive Deeper: Advanced Manneville-la-Raoult STR Market Data (2025)
Ready to unlock more insights? AirROI provides access to advanced metrics and comprehensive Airbnb data for Manneville-la-Raoult. Explore detailed analytics beyond this report to refine your investment strategy, optimize pricing, and maximize your vacation rental profits.
Explore Advanced MetricsManneville-la-Raoult Short-Term Rental Market Composition (2025): Property & Room Types
Room Type Distribution
Property Type Distribution
Market Composition Insights for Manneville-la-Raoult
- The Manneville-la-Raoult Airbnb market composition is heavily skewed towards Entire Home/Apt listings, which make up 83.3% of the 24 active rentals. This indicates strong guest preference for privacy and space.
- Looking at the property type distribution in Manneville-la-Raoult, House properties are the most common (75%), reflecting the local real estate landscape.
- Houses represent a significant 75% portion, catering likely to families or larger groups.
- The presence of 20.8% Hotel/Boutique listings indicates integration with traditional hospitality.
- Smaller segments like unique stays (combined 4.2%) offer potential for unique stay experiences.
Manneville-la-Raoult Airbnb Room Capacity Analysis (2025): Bedroom Distribution
Distribution of Listings by Number of Bedrooms
Room Capacity Insights for Manneville-la-Raoult
- The dominant room capacity in Manneville-la-Raoult is 1 bedroom listings, making up 33.3% of the market. This suggests a strong demand for properties suitable for couples or solo travelers.
- Together, 1 bedroom and 2 bedrooms properties represent 62.5% of the active Airbnb listings in Manneville-la-Raoult, indicating a high concentration in these sizes.
- A significant 33.3% of listings offer 3+ bedrooms, catering to larger groups and families seeking more space in Manneville-la-Raoult.
Manneville-la-Raoult Vacation Rental Guest Capacity Trends (2025)
Distribution of Listings by Guest Capacity
Guest Capacity Insights for Manneville-la-Raoult
- The most common guest capacity trend in Manneville-la-Raoult vacation rentals is listings accommodating 4 guests (33.3%). This suggests the primary traveler segment is likely small families or groups.
- Properties designed for 4 guests and 2 guests dominate the Manneville-la-Raoult STR market, accounting for 62.5% of listings.
- 33.4% of properties accommodate 6+ guests, serving the market segment for larger families or group travel in Manneville-la-Raoult.
- On average, properties in Manneville-la-Raoult are equipped to host 4.5 guests.
Manneville-la-Raoult Airbnb Booking Patterns (2025): Available vs. Booked Days
Available Days Distribution
Booked Days Distribution
Booking Pattern Insights for Manneville-la-Raoult
- The most common availability pattern in Manneville-la-Raoult falls within the 271-366 days range, representing 45.8% of listings. This suggests many properties have significant open periods on their calendars.
- Approximately 83.3% of listings show high availability (181+ days open annually), indicating potential for increased bookings or specific owner usage patterns.
- For booked days, the 91-180 days range is most frequent in Manneville-la-Raoult (37.5%), reflecting common guest stay durations or potential owner blocking patterns.
- A notable 16.7% of properties secure long booking periods (181+ days booked per year), highlighting successful long-term rental strategies or significant owner usage.
Manneville-la-Raoult Airbnb Minimum Stay Requirements Analysis
Distribution of Listings by Minimum Night Requirement
2 Nights
14 listings
66.7% of total
3 Nights
1 listings
4.8% of total
4-6 Nights
3 listings
14.3% of total
30+ Nights
3 listings
14.3% of total
Key Insights
- The most prevalent minimum stay requirement in Manneville-la-Raoult is 2 Nights, adopted by 66.7% of listings. This highlights the market's preference for shorter, flexible bookings.
- A strong majority (66.7%) of the Manneville-la-Raoult Airbnb data shows acceptance of very short stays (1-2 nights), indicating a dynamic, high-turnover market.
- A significant segment (14.3%) caters to monthly stays (30+ nights) in Manneville-la-Raoult, pointing to opportunities in the extended-stay market.
Recommendations
- Align with the market by considering a 2 Nights minimum stay, as 66.7% of Manneville-la-Raoult hosts use this setting.
- A 2-night minimum appears standard (66.7%). Consider this for weekends or peak periods.
- Explore offering discounts for stays of 30+ nights to attract the 14.3% of the market seeking extended stays.
- Adjust minimum nights based on seasonality – potentially shorter during low season and longer during peak demand periods in Manneville-la-Raoult.
Manneville-la-Raoult Airbnb Cancellation Policy Trends Analysis (2025)
Super Strict 60 Days
1 listings
5% of total
Flexible
3 listings
15% of total
Moderate
4 listings
20% of total
Firm
6 listings
30% of total
Strict
6 listings
30% of total
Cancellation Policy Insights for Manneville-la-Raoult
- The prevailing Airbnb cancellation policy trend in Manneville-la-Raoult is Firm, used by 30% of listings.
- A majority (60.0%) of hosts in Manneville-la-Raoult utilize Firm or Strict policies, indicating a market where hosts prioritize booking security.
Recommendations for Hosts
- Consider adopting a Firm policy to align with the 30% market standard in Manneville-la-Raoult.
- Regularly review your cancellation policy against competitors and market demand shifts in Manneville-la-Raoult.
Manneville-la-Raoult STR Booking Lead Time Analysis (2025)
Average Booking Lead Time by Month
Booking Lead Time Insights for Manneville-la-Raoult
- The overall average booking lead time for vacation rentals in Manneville-la-Raoult is 59 days.
- Guests book furthest in advance for stays during June (average 134 days), likely coinciding with peak travel demand or local events.
- The shortest booking windows occur for stays in February (average 11 days), indicating more last-minute travel plans during this time.
- Seasonally, Summer (107 days avg.) sees the longest lead times, while Spring (48 days avg.) has the shortest, reflecting typical travel planning cycles.
Recommendations for Hosts
- Use the overall average lead time (59 days) as a baseline for your pricing and availability strategy in Manneville-la-Raoult.
- For June stays, consider implementing length-of-stay discounts or slightly higher rates for bookings made less than 134 days out to capitalize on advance planning.
- During February, focus on last-minute booking availability and promotions, as guests book with very short notice (11 days avg.).
- Target marketing efforts for the Summer season well in advance (at least 107 days) to capture early planners.
- Monitor your own booking lead times against these Manneville-la-Raoult averages to identify opportunities for dynamic pricing adjustments.
Popular & Essential Airbnb Amenities in Manneville-la-Raoult (2025)
Amenity Prevalence
Amenity Insights for Manneville-la-Raoult
- Essential amenities in Manneville-la-Raoult that guests expect include: Kitchen, Free parking on premises. Lacking these (any) could significantly impact bookings.
- Popular amenities like Smoke alarm, Heating, TV are common but not universal. Offering these can provide a competitive edge.
Recommendations for Hosts
- Ensure your listing includes all essential amenities for Manneville-la-Raoult: Kitchen, Free parking on premises.
- Consider adding popular differentiators like Smoke alarm or Heating to increase appeal.
- Highlight unique or less common amenities you offer (e.g., hot tub, dedicated workspace, EV charger) in your listing description and photos.
- Regularly check competitor amenities in Manneville-la-Raoult to stay competitive.
Manneville-la-Raoult Airbnb Guest Demographics & Profile Analysis (2025)
Guest Profile Summary for Manneville-la-Raoult
- The typical guest profile for Airbnb in Manneville-la-Raoult consists of primarily domestic travelers (68%), often arriving from nearby Paris, typically belonging to the Post-2000s (Gen Z/Alpha) group (50%), primarily speaking English or French.
- Domestic travelers account for 68.2% of guests.
- Key international markets include France (68.2%) and Netherlands (9.3%).
- Top languages spoken are English (38.6%) followed by French (34.6%).
- A significant demographic segment is the Post-2000s (Gen Z/Alpha) group, representing 50% of guests.
Recommendations for Hosts
- Target domestic marketing efforts towards travelers from Paris and Amsterdam.
- Tailor amenities and listing descriptions to appeal to the dominant Post-2000s (Gen Z/Alpha) demographic (e.g., highlight fast WiFi, smart home features, local guides).
- Highlight unique local experiences or amenities relevant to the primary guest profile.
- Consider seasonal promotions aligned with peak travel times for key origin markets.
Nearby Short-Term Rental Market Comparison
How does the Manneville-la-Raoult Airbnb market stack up against its neighbors? Compare key performance metrics like average monthly revenue, ADR, and occupancy rates in surrounding areas to understand the broader regional STR landscape.
| Market | Active Properties | Monthly Revenue | Daily Rate | Avg. Occupancy |
|---|---|---|---|---|
| La Poterie-Cap-d'Antifer | 11 | $5,076 | $293.95 | 55% |
| Bonneville-sur-Touques | 16 | $3,903 | $367.00 | 40% |
| Luneray | 12 | $3,745 | $526.24 | 42% |
| La Couture-Boussey | 12 | $3,620 | $378.08 | 28% |
| Roedean | 47 | $3,494 | $257.09 | 47% |
| Saint-Étienne-la-Thillaye | 24 | $3,459 | $325.89 | 42% |
| Cricquebœuf | 10 | $3,417 | $268.29 | 46% |
| Caumont | 11 | $3,350 | $286.17 | 49% |
| Moulins-le-Carbonnel | 11 | $3,213 | $320.85 | 35% |
| Gonneville-en-Auge | 12 | $3,061 | $235.90 | 40% |