Les Loges Airbnb Market Analysis 2025: Short Term Rental Data & Vacation Rental Statistics in Normandy, France
Is Airbnb profitable in Les Loges in 2025? Explore comprehensive Airbnb analytics for Les Loges, Normandy, France to uncover income potential. This 2025 STR market report for Les Loges, based on AirROI data from April 2024 to March 2025, reveals key trends in the niche market of 32 active listings.
Whether you're considering an Airbnb investment in Les Loges, optimizing your existing vacation rental, or exploring rental arbitrage opportunities, understanding the Les Loges Airbnb data is crucial. Leveraging the low regulation environment is key to maximizing your short term rental income potential. Let's dive into the specifics.
Key Les Loges Airbnb Performance Metrics Overview
Monthly Airbnb Revenue Variations & Income Potential in Les Loges (2025)
Understanding the monthly revenue variations for Airbnb listings in Les Loges is key to maximizing your short term rental income potential. Seasonality significantly impacts earnings. Our analysis, based on data from the past 12 months, shows that the peak revenue month for STRs in Les Loges is typically August, while January often presents the lowest earnings, highlighting opportunities for strategic pricing adjustments during shoulder and low seasons. Explore the typical Airbnb income in Les Loges across different performance tiers:
- Best-in-class properties (Top 10%) achieve $3,220+ monthly, often utilizing dynamic pricing and superior guest experiences.
- Strong performing properties (Top 25%) earn $1,905 or more, indicating effective management and desirable locations/amenities.
- Typical properties (Median) generate around $1,154 per month, representing the average market performance.
- Entry-level properties (Bottom 25%) see earnings around $619, often with potential for optimization.
Average Monthly Airbnb Earnings Trend in Les Loges
Les Loges Airbnb Occupancy Rate Trends (2025)
Maximize your bookings by understanding the Les Loges STR occupancy trends. Seasonal demand shifts significantly influence how often properties are booked. Typically, Augustsees the highest demand (peak season occupancy), while February experiences the lowest (low season). Effective strategies, like adjusting minimum stays or offering promotions, can boost occupancy during slower periods. Here's how different property tiers perform in Les Loges:
- Best-in-class properties (Top 10%) achieve 68%+ occupancy, indicating high desirability and potentially optimized availability.
- Strong performing properties (Top 25%) maintain 52% or higher occupancy, suggesting good market fit and guest satisfaction.
- Typical properties (Median) have an occupancy rate around 37%.
- Entry-level properties (Bottom 25%) average 19% occupancy, potentially facing higher vacancy.
Average Monthly Occupancy Rate Trend in Les Loges
Average Daily Rate (ADR) Airbnb Trends in Les Loges (2025)
Effective short term rental pricing strategy in Les Loges involves understanding monthly ADR fluctuations. The Average Daily Rate (ADR) for Airbnb in Les Loges typically peaks in July and dips lowest during March. Leveraging Airbnb dynamic pricing tools or strategies based on this seasonality can significantly boost revenue. Here's a look at the typical nightly rates achieved:
- Best-in-class properties (Top 10%) command rates of $217+ per night, often due to premium features or locations.
- Strong performing properties (Top 25%) achieve nightly rates of $123 or more.
- Typical properties (Median) charge around $95 per night.
- Entry-level properties (Bottom 25%) earn around $71 per night.
Average Daily Rate (ADR) Trend by Month in Les Loges
Get Live Les Loges Market Intelligence 👇

Explore Real-time Analytics
Airbnb Seasonality Analysis & Trends in Les Loges (2025)
Peak Season (August, May, June)
- Revenue averages $2,200 per month
- Occupancy rates average 51.1%
- Daily rates average $114
Shoulder Season
- Revenue averages $1,553 per month
- Occupancy maintains around 38.7%
- Daily rates hold near $109
Low Season (January, February, November)
- Revenue drops to average $791 per month
- Occupancy decreases to average 23.9%
- Daily rates adjust to average $106
Seasonality Insights for Les Loges
- The Airbnb seasonality in Les Loges shows highly seasonal trends requiring careful strategy. While the sections above show seasonal averages, it's also insightful to look at the extremes:
- During the high season, the absolute peak month showcases Les Loges's highest earning potential, with monthly revenues capable of climbing to $2,298, occupancy reaching a high of 63.4%, and ADRs peaking at $115.
- Conversely, the slowest single month of the year, typically falling within the low season, marks the market's lowest point. In this month, revenue might dip to $709, occupancy could drop to 23.1%, and ADRs may adjust down to $102.
- Understanding both the seasonal averages and these monthly peaks and troughs in revenue, occupancy, and ADR is crucial for maximizing your Airbnb profit potential in Les Loges.
Seasonal Strategies for Maximizing Profit
- Peak Season: Maximize revenue through premium pricing and potentially longer minimum stays. Ensure high availability.
- Low Season: Offer competitive pricing, special promotions (e.g., extended stay discounts), and flexible cancellation policies. Target off-season travelers like remote workers or budget-conscious guests.
- Shoulder Seasons: Implement dynamic pricing that balances peak and low rates. Target weekend travelers or specific events. Offer slightly more flexible terms than peak season.
- Regularly analyze your own performance against these Les Loges seasonality benchmarks and adjust your pricing and availability strategy accordingly.
Best Areas for Airbnb Investment in Les Loges (2025)
Exploring the top neighborhoods for short-term rentals in Les Loges? This section highlights key areas, outlining why they are attractive for hosts and guests, along with notable local attractions. Consider these locations based on your target guest profile and investment strategy.
| Neighborhood / Area | Why Host Here? (Target Guests & Appeal) | Key Attractions & Landmarks |
|---|---|---|
| Saint-Malo | Historic port city known for its well-preserved walled city and beautiful beaches. A prime location for tourists exploring the coast of Brittany and Normandy. | Saint-Malo Citadel, Grand Bé Island, Fort National, Dinan River, Saint-Malo Beach, Église Saint-Vincent |
| Honfleur | Charming harbor town with picturesque streets and historic buildings. Popular among artists and tourists looking for a quintessential Normandy experience with great dining and art galleries. | Vieux Bassin, Saint-Catherine's Church, Musee Eugene Boudin, Jardin des Personnalités, Honfleur's Old Port |
| Deauville | Luxurious seaside resort known for its beautiful beaches and horse racing. Attracts affluent visitors looking for upscale amenities and a classic beach experience. | Deauville Beach, Casino de Deauville, Les Planches, Deauville-La Touques Racecourse, Deauville International Centre |
| Étretat | Famous for its stunning chalk cliffs and natural arches, making it a favorite among nature lovers and photographers. A serene escape for guests wanting to experience natural beauty. | Étretat Cliffs, Falaise d'Aval, Aiguille Creuse, Étretat Beach, Grands Galets |
| Rouen | Historic city known for its medieval architecture and rich history. Great for travelers who want to explore Normandy's culture and heritage, with easy access to nearby attractions. | Rouen Cathedral, Gros Horloge, Musee des Beaux-Arts, Palais de Justice, Place du Vieux-Marche |
| Caen | Significant historical city with Norman heritage, including the famous Caen Memorial. Ideal for those interested in history and World War II culture. | Caen Memorial Museum, Château de Caen, Abbaye aux Hommes, Abbaye aux Dames, Jardin des Plantes |
| Bayeux | Known for its historic tapestry and charming medieval town. A must-visit for those interested in the history of the Norman Conquest. | Bayeux Tapestry, Notre-Dame de Bayeux, Catherine de Valois Garden, Bayeux Museum, British War Cemetery |
| Lisieux | A center of pilgrimage with a beautiful basilica and historical significance. Attracts religious tourists and those interested in French culture. | Basilique Sainte-Thérèse, Lisieux Cathedral, Musee d'Art et d'Histoire, Chateau de Saint-Germain, Les Jardins de la Maison de la Vue |
Understanding Airbnb License Requirements & STR Laws in Les Loges (2025)
While Les Loges, Normandy, France currently shows low STR regulations, specific Airbnb license requirements might still exist or change. Always verify the latest short term rental regulations and Airbnb license requirements directly with local government authorities for Les Loges to ensure full compliance before hosting.
(Source: AirROI data, 2025, based on 3% licensed listings)
Top Performing Airbnb Properties in Les Loges (2025)
Benchmark your potential! Explore examples of top-performing Airbnb properties in Les Logesbased on Trailing Twelve Month (TTM) revenue. Analyze their characteristics, revenue, occupancy rate, and ADR to understand what drives success in this market.
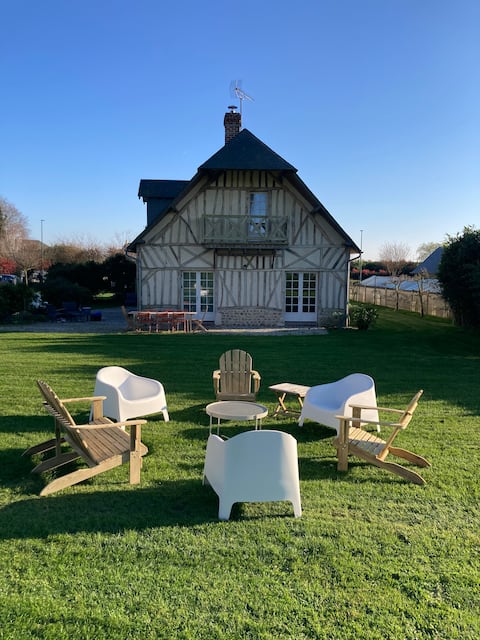
Chez Gaby, Normandy Villa near Etretat
Entire Place • 4 bedrooms
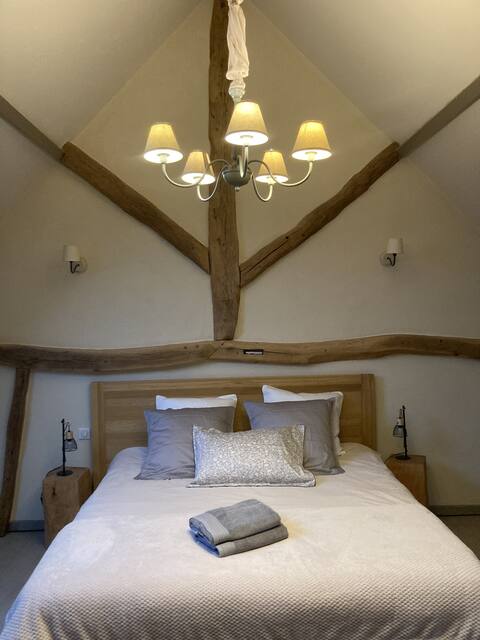
Chez Marguerite, Normandy villa near Etretat
Entire Place • 4 bedrooms
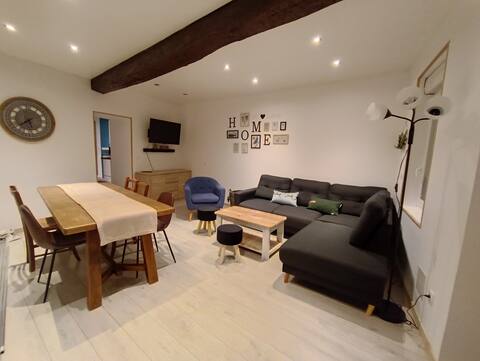
4 bedroom house near Etretat
Entire Place • 4 bedrooms
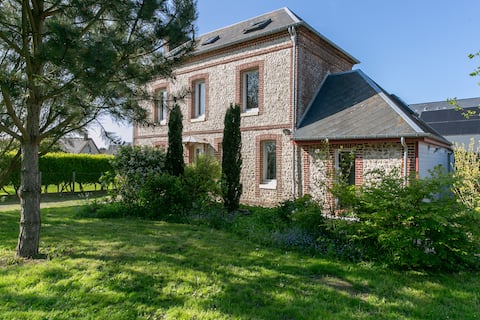
Pretty period house
Entire Place • 4 bedrooms
Country house 8 min Etretat
Entire Place • 2 bedrooms
Lodge 1 -7 min d 'Etretat Parking
Entire Place • N/A
Note: Performance varies based on location, size, amenities, seasonality, and management quality. Data reflects the past 12 months.
Top Performing Airbnb Hosts in Les Loges (2025)
Learn from the best! This table showcases top-performing Airbnb hosts in Les Loges based on the number of properties managed and estimated total revenue over the past year. Analyze their scale and performance metrics.
| Host Name | Properties | Grossing Revenue | Stay Reviews | Avg Rating |
|---|---|---|---|---|
| Delphine Et Jérôme | 2 | $102,840 | 64 | 4.94/5.0 |
| Lucie | 7 | $81,208 | 527 | 4.79/5.0 |
| Cassandre | 6 | $33,120 | 197 | 4.05/5.0 |
| Valerie | 1 | $25,864 | 12 | 4.75/5.0 |
| Emilia | 1 | $24,543 | 8 | 4.75/5.0 |
| Carole | 1 | $22,904 | 32 | 4.91/5.0 |
| Christiane | 2 | $17,485 | 22 | 4.92/5.0 |
| Fabien Et Senaã | 1 | $16,933 | 34 | 4.82/5.0 |
| Camping L'Aiguille Creuse | 2 | $15,958 | 74 | 4.63/5.0 |
| Emmanuel | 1 | $13,666 | 39 | 4.28/5.0 |
Analyzing the strategies of top hosts, such as their property selection, pricing, and guest communication, can offer valuable lessons for optimizing your own Airbnb operations in Les Loges.
Dive Deeper: Advanced Les Loges STR Market Data (2025)
Ready to unlock more insights? AirROI provides access to advanced metrics and comprehensive Airbnb data for Les Loges. Explore detailed analytics beyond this report to refine your investment strategy, optimize pricing, and maximize your vacation rental profits.
Explore Advanced MetricsLes Loges Short-Term Rental Market Composition (2025): Property & Room Types
Room Type Distribution
Property Type Distribution
Market Composition Insights for Les Loges
- The Les Loges Airbnb market composition is heavily skewed towards Entire Home/Apt listings, which make up 78.1% of the 32 active rentals. This indicates strong guest preference for privacy and space.
- Looking at the property type distribution in Les Loges, House properties are the most common (62.5%), reflecting the local real estate landscape.
- Houses represent a significant 62.5% portion, catering likely to families or larger groups.
- The presence of 21.9% Hotel/Boutique listings indicates integration with traditional hospitality.
Les Loges Airbnb Room Capacity Analysis (2025): Bedroom Distribution
Distribution of Listings by Number of Bedrooms
Room Capacity Insights for Les Loges
- The dominant room capacity in Les Loges is 1 bedroom listings, making up 37.5% of the market. This suggests a strong demand for properties suitable for couples or solo travelers.
- Together, 1 bedroom and 2 bedrooms properties represent 59.4% of the active Airbnb listings in Les Loges, indicating a high concentration in these sizes.
Les Loges Vacation Rental Guest Capacity Trends (2025)
Distribution of Listings by Guest Capacity
Guest Capacity Insights for Les Loges
- The most common guest capacity trend in Les Loges vacation rentals is listings accommodating 4 guests (31.3%). This suggests the primary traveler segment is likely small families or groups.
- Properties designed for 4 guests and 2 guests dominate the Les Loges STR market, accounting for 59.4% of listings.
- 15.6% of properties accommodate 6+ guests, serving the market segment for larger families or group travel in Les Loges.
- On average, properties in Les Loges are equipped to host 3.6 guests.
Les Loges Airbnb Booking Patterns (2025): Available vs. Booked Days
Available Days Distribution
Booked Days Distribution
Booking Pattern Insights for Les Loges
- The most common availability pattern in Les Loges falls within the 181-270 days range, representing 46.9% of listings. This suggests many properties have significant open periods on their calendars.
- Approximately 84.4% of listings show high availability (181+ days open annually), indicating potential for increased bookings or specific owner usage patterns.
- For booked days, the 91-180 days range is most frequent in Les Loges (46.9%), reflecting common guest stay durations or potential owner blocking patterns.
- A notable 15.6% of properties secure long booking periods (181+ days booked per year), highlighting successful long-term rental strategies or significant owner usage.
Les Loges Airbnb Minimum Stay Requirements Analysis
Distribution of Listings by Minimum Night Requirement
1 Night
20 listings
64.5% of total
2 Nights
7 listings
22.6% of total
3 Nights
1 listings
3.2% of total
4-6 Nights
1 listings
3.2% of total
30+ Nights
2 listings
6.5% of total
Key Insights
- The most prevalent minimum stay requirement in Les Loges is 1 Night, adopted by 64.5% of listings. This highlights the market's preference for shorter, flexible bookings.
- A strong majority (87.1%) of the Les Loges Airbnb data shows acceptance of very short stays (1-2 nights), indicating a dynamic, high-turnover market.
Recommendations
- Align with the market by considering a 1 Night minimum stay, as 64.5% of Les Loges hosts use this setting.
- Explore offering discounts for stays of 30+ nights to attract the 6.5% of the market seeking extended stays.
- Adjust minimum nights based on seasonality – potentially shorter during low season and longer during peak demand periods in Les Loges.
Les Loges Airbnb Cancellation Policy Trends Analysis (2025)
Flexible
11 listings
36.7% of total
Moderate
12 listings
40% of total
Firm
3 listings
10% of total
Strict
4 listings
13.3% of total
Cancellation Policy Insights for Les Loges
- The prevailing Airbnb cancellation policy trend in Les Loges is Moderate, used by 40% of listings.
- The market strongly favors guest-friendly terms, with 76.7% of listings offering Flexible or Moderate policies. This suggests guests in Les Loges may expect booking flexibility.
Recommendations for Hosts
- Consider adopting a Moderate policy to align with the 40% market standard in Les Loges.
- Using a Strict policy might deter some guests, as only 13.3% of listings use it. Evaluate if potential revenue protection outweighs possible lower booking rates.
- Regularly review your cancellation policy against competitors and market demand shifts in Les Loges.
Les Loges STR Booking Lead Time Analysis (2025)
Average Booking Lead Time by Month
Booking Lead Time Insights for Les Loges
- The overall average booking lead time for vacation rentals in Les Loges is 50 days.
- Guests book furthest in advance for stays during May (average 67 days), likely coinciding with peak travel demand or local events.
- The shortest booking windows occur for stays in November (average 19 days), indicating more last-minute travel plans during this time.
- Seasonally, Summer (47 days avg.) sees the longest lead times, while Fall (32 days avg.) has the shortest, reflecting typical travel planning cycles.
Recommendations for Hosts
- Use the overall average lead time (50 days) as a baseline for your pricing and availability strategy in Les Loges.
- For May stays, consider implementing length-of-stay discounts or slightly higher rates for bookings made less than 67 days out to capitalize on advance planning.
- Target marketing efforts for the Summer season well in advance (at least 47 days) to capture early planners.
- Monitor your own booking lead times against these Les Loges averages to identify opportunities for dynamic pricing adjustments.
Popular & Essential Airbnb Amenities in Les Loges (2025)
Amenity Prevalence
Amenity Insights for Les Loges
- Essential amenities in Les Loges that guests expect include: Free parking on premises. Lacking these (this) could significantly impact bookings.
- Popular amenities like Wifi, Heating, TV are common but not universal. Offering these can provide a competitive edge.
- Warning: Wifi is not universally provided but is considered essential globally. Ensure reliable Wifi is offered.
Recommendations for Hosts
- Ensure your listing includes all essential amenities for Les Loges: Free parking on premises.
- Prioritize adding missing essentials: Free parking on premises.
- Consider adding popular differentiators like Wifi or Heating to increase appeal.
- Highlight unique or less common amenities you offer (e.g., hot tub, dedicated workspace, EV charger) in your listing description and photos.
- Regularly check competitor amenities in Les Loges to stay competitive.
Les Loges Airbnb Guest Demographics & Profile Analysis (2025)
Guest Profile Summary for Les Loges
- The typical guest profile for Airbnb in Les Loges consists of primarily domestic travelers (75%), often arriving from nearby Paris, typically belonging to the Post-2000s (Gen Z/Alpha) group (50%), primarily speaking French or English.
- Domestic travelers account for 74.8% of guests.
- Key international markets include France (74.8%) and Belgium (8.3%).
- Top languages spoken are French (39.6%) followed by English (34%).
- A significant demographic segment is the Post-2000s (Gen Z/Alpha) group, representing 50% of guests.
Recommendations for Hosts
- Target domestic marketing efforts towards travelers from Paris and Rennes.
- Tailor amenities and listing descriptions to appeal to the dominant Post-2000s (Gen Z/Alpha) demographic (e.g., highlight fast WiFi, smart home features, local guides).
- Highlight unique local experiences or amenities relevant to the primary guest profile.
- Consider seasonal promotions aligned with peak travel times for key origin markets.
Nearby Short-Term Rental Market Comparison
How does the Les Loges Airbnb market stack up against its neighbors? Compare key performance metrics like average monthly revenue, ADR, and occupancy rates in surrounding areas to understand the broader regional STR landscape.
| Market | Active Properties | Monthly Revenue | Daily Rate | Avg. Occupancy |
|---|---|---|---|---|
| La Poterie-Cap-d'Antifer | 11 | $5,076 | $293.95 | 55% |
| Bonneville-sur-Touques | 16 | $3,903 | $367.00 | 40% |
| Luneray | 12 | $3,745 | $526.24 | 42% |
| La Couture-Boussey | 12 | $3,620 | $378.08 | 28% |
| Roedean | 47 | $3,494 | $257.09 | 47% |
| Saint-Étienne-la-Thillaye | 24 | $3,459 | $325.89 | 42% |
| Cricquebœuf | 10 | $3,417 | $268.29 | 46% |
| Caumont | 11 | $3,350 | $286.17 | 49% |
| Moulins-le-Carbonnel | 11 | $3,213 | $320.85 | 35% |
| Gonneville-en-Auge | 12 | $3,061 | $235.90 | 40% |