Les Andelys Airbnb Market Analysis 2025: Short Term Rental Data & Vacation Rental Statistics in Normandy, France
Is Airbnb profitable in Les Andelys in 2025? Explore comprehensive Airbnb analytics for Les Andelys, Normandy, France to uncover income potential. This 2025 STR market report for Les Andelys, based on AirROI data from April 2024 to March 2025, reveals key trends in the niche market of 23 active listings.
Whether you're considering an Airbnb investment in Les Andelys, optimizing your existing vacation rental, or exploring rental arbitrage opportunities, understanding the Les Andelys Airbnb data is crucial. Leveraging the low regulation environment is key to maximizing your short term rental income potential. Let's dive into the specifics.
Key Les Andelys Airbnb Performance Metrics Overview
Monthly Airbnb Revenue Variations & Income Potential in Les Andelys (2025)
Understanding the monthly revenue variations for Airbnb listings in Les Andelys is key to maximizing your short term rental income potential. Seasonality significantly impacts earnings. Our analysis, based on data from the past 12 months, shows that the peak revenue month for STRs in Les Andelys is typically May, while February often presents the lowest earnings, highlighting opportunities for strategic pricing adjustments during shoulder and low seasons. Explore the typical Airbnb income in Les Andelys across different performance tiers:
- Best-in-class properties (Top 10%) achieve $4,999+ monthly, often utilizing dynamic pricing and superior guest experiences.
- Strong performing properties (Top 25%) earn $3,068 or more, indicating effective management and desirable locations/amenities.
- Typical properties (Median) generate around $1,403 per month, representing the average market performance.
- Entry-level properties (Bottom 25%) see earnings around $611, often with potential for optimization.
Average Monthly Airbnb Earnings Trend in Les Andelys
Les Andelys Airbnb Occupancy Rate Trends (2025)
Maximize your bookings by understanding the Les Andelys STR occupancy trends. Seasonal demand shifts significantly influence how often properties are booked. Typically, Julysees the highest demand (peak season occupancy), while February experiences the lowest (low season). Effective strategies, like adjusting minimum stays or offering promotions, can boost occupancy during slower periods. Here's how different property tiers perform in Les Andelys:
- Best-in-class properties (Top 10%) achieve 75%+ occupancy, indicating high desirability and potentially optimized availability.
- Strong performing properties (Top 25%) maintain 52% or higher occupancy, suggesting good market fit and guest satisfaction.
- Typical properties (Median) have an occupancy rate around 25%.
- Entry-level properties (Bottom 25%) average 13% occupancy, potentially facing higher vacancy.
Average Monthly Occupancy Rate Trend in Les Andelys
Average Daily Rate (ADR) Airbnb Trends in Les Andelys (2025)
Effective short term rental pricing strategy in Les Andelys involves understanding monthly ADR fluctuations. The Average Daily Rate (ADR) for Airbnb in Les Andelys typically peaks in December and dips lowest during April. Leveraging Airbnb dynamic pricing tools or strategies based on this seasonality can significantly boost revenue. Here's a look at the typical nightly rates achieved:
- Best-in-class properties (Top 10%) command rates of $478+ per night, often due to premium features or locations.
- Strong performing properties (Top 25%) achieve nightly rates of $205 or more.
- Typical properties (Median) charge around $131 per night.
- Entry-level properties (Bottom 25%) earn around $86 per night.
Average Daily Rate (ADR) Trend by Month in Les Andelys
Get Live Les Andelys Market Intelligence 👇

Explore Real-time Analytics
Airbnb Seasonality Analysis & Trends in Les Andelys (2025)
Peak Season (May, August, July)
- Revenue averages $2,837 per month
- Occupancy rates average 40.3%
- Daily rates average $200
Shoulder Season
- Revenue averages $2,327 per month
- Occupancy maintains around 33.8%
- Daily rates hold near $196
Low Season (January, February, March)
- Revenue drops to average $1,462 per month
- Occupancy decreases to average 29.3%
- Daily rates adjust to average $196
Seasonality Insights for Les Andelys
- The Airbnb seasonality in Les Andelys shows highly seasonal trends requiring careful strategy. While the sections above show seasonal averages, it's also insightful to look at the extremes:
- During the high season, the absolute peak month showcases Les Andelys's highest earning potential, with monthly revenues capable of climbing to $3,136, occupancy reaching a high of 42.4%, and ADRs peaking at $214.
- Conversely, the slowest single month of the year, typically falling within the low season, marks the market's lowest point. In this month, revenue might dip to $1,062, occupancy could drop to 23.9%, and ADRs may adjust down to $185.
- Understanding both the seasonal averages and these monthly peaks and troughs in revenue, occupancy, and ADR is crucial for maximizing your Airbnb profit potential in Les Andelys.
Seasonal Strategies for Maximizing Profit
- Peak Season: Maximize revenue through premium pricing and potentially longer minimum stays. Ensure high availability.
- Low Season: Offer competitive pricing, special promotions (e.g., extended stay discounts), and flexible cancellation policies. Target off-season travelers like remote workers or budget-conscious guests.
- Shoulder Seasons: Implement dynamic pricing that balances peak and low rates. Target weekend travelers or specific events. Offer slightly more flexible terms than peak season.
- Regularly analyze your own performance against these Les Andelys seasonality benchmarks and adjust your pricing and availability strategy accordingly.
Best Areas for Airbnb Investment in Les Andelys (2025)
Exploring the top neighborhoods for short-term rentals in Les Andelys? This section highlights key areas, outlining why they are attractive for hosts and guests, along with notable local attractions. Consider these locations based on your target guest profile and investment strategy.
| Neighborhood / Area | Why Host Here? (Target Guests & Appeal) | Key Attractions & Landmarks |
|---|---|---|
| Centre-ville de Les Andelys | Vibrant center of Les Andelys with historical architecture, cafes, and shops. It attracts tourists looking to explore the town's rich cultural heritage and enjoy local amenities. | Château Gaillard, Église Sainte-Jacques, Riverside walks along Seine, Local markets, Cafes and bistros |
| Les Andelys Riverside | Picturesque area along the Seine River, ideal for those seeking tranquillity and scenic views. Perfect for tourists wanting to enjoy nature and participate in outdoor activities. | Seine River excursions, Cycling paths, Picnic areas, Fishing spots |
| Coteaux de Les Andelys | Hilly area providing exceptional views of the Seine and the town below. Great for hosting guests who appreciate nature and scenic hiking trails. | Walking trails, Panoramic viewpoints, Nature parks |
| Nearby Château de la Roche-Guyon | A short drive from Les Andelys, this area offers a historic castle, attracting visitors who want to explore French history and architecture. | Château de la Roche-Guyon, Gardens, Guided tours |
| Local Vineyards | The surrounding vineyards offer wine tasting experiences, appealing to gastronomy tourists and wine enthusiasts. | Wine cellars, Tastings, Countryside views |
| Nearby Giverny | Renowned for Claude Monet's gardens, making it a popular day-trip destination. Ideal for arts and culture lovers. | Monet's Garden, Musée des Impressionnismes, Local art galleries |
| Historical sites | Les Andelys is rich in history, attracting tourists interested in medieval architecture and historical tours. | Historical walks, Local museums, Château Gaillard tours |
| Cultural events in Les Andelys | Throughout the year, the town hosts various cultural and music festivals, drawing visitors and creating vibrant community activity. | Annual festivals, Local exhibitions, Concerts |
Understanding Airbnb License Requirements & STR Laws in Les Andelys (2025)
While Les Andelys, Normandy, France currently shows low STR regulations, specific Airbnb license requirements might still exist or change. Always verify the latest short term rental regulations and Airbnb license requirements directly with local government authorities for Les Andelys to ensure full compliance before hosting.
(Source: AirROI data, 2025, finding no licensed listings among those analyzed)
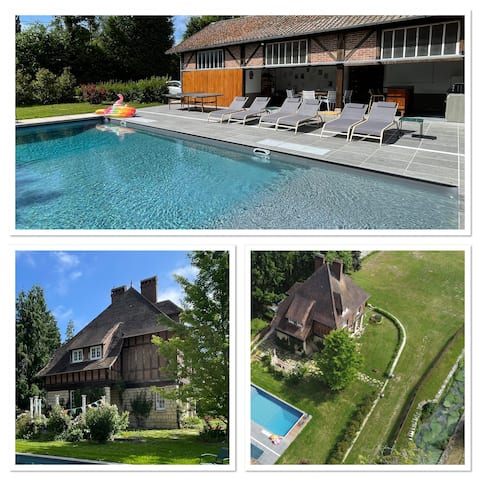
Top Performing Airbnb Properties in Les Andelys (2025)
Benchmark your potential! Explore examples of top-performing Airbnb properties in Les Andelysbased on Trailing Twelve Month (TTM) revenue. Analyze their characteristics, revenue, occupancy rate, and ADR to understand what drives success in this market.

La Maison Normandelys
Entire Place • 3 bedrooms
Villa Normande: nature, pool, sauna. Paris 1h
Entire Place • 5 bedrooms

2 Houses, Tennis lighted 7 bedr 6 Baths 22 guests
Entire Place • 7 bedrooms

House of greenery, at the foot of Château Gaillard
Entire Place • 3 bedrooms

Le Clos du Château
Entire Place • 5 bedrooms

Gite des Capucins, 6 pers, Ctr Historique/15mn A13
Entire Place • 2 bedrooms
Note: Performance varies based on location, size, amenities, seasonality, and management quality. Data reflects the past 12 months.
Top Performing Airbnb Hosts in Les Andelys (2025)
Learn from the best! This table showcases top-performing Airbnb hosts in Les Andelys based on the number of properties managed and estimated total revenue over the past year. Analyze their scale and performance metrics.
| Host Name | Properties | Grossing Revenue | Stay Reviews | Avg Rating |
|---|---|---|---|---|
| Anne-Sophie | 1 | $115,242 | 52 | 4.83/5.0 |
| Cyril Et Sandrine | 1 | $43,510 | 12 | 5.00/5.0 |
| Christian | 1 | $40,945 | 28 | 5.00/5.0 |
| Thi Minh Thu | 1 | $40,785 | 33 | 4.94/5.0 |
| Catherine | 1 | $39,036 | 24 | 4.96/5.0 |
| Adrien | 1 | $36,300 | 9 | 4.89/5.0 |
| Fabrice Et Anne | 1 | $34,063 | 5 | 4.80/5.0 |
| Jean-Christophe, | 1 | $31,151 | 13 | 4.77/5.0 |
| Laurence | 1 | $23,990 | 67 | 4.96/5.0 |
| Host #169646597 | 1 | $23,256 | 1 | 0.00/5.0 |
Analyzing the strategies of top hosts, such as their property selection, pricing, and guest communication, can offer valuable lessons for optimizing your own Airbnb operations in Les Andelys.
Dive Deeper: Advanced Les Andelys STR Market Data (2025)
Ready to unlock more insights? AirROI provides access to advanced metrics and comprehensive Airbnb data for Les Andelys. Explore detailed analytics beyond this report to refine your investment strategy, optimize pricing, and maximize your vacation rental profits.
Explore Advanced MetricsLes Andelys Short-Term Rental Market Composition (2025): Property & Room Types
Room Type Distribution
Property Type Distribution
Market Composition Insights for Les Andelys
- The Les Andelys Airbnb market composition is heavily skewed towards Entire Home/Apt listings, which make up 82.6% of the 23 active rentals. This indicates strong guest preference for privacy and space.
- Looking at the property type distribution in Les Andelys, House properties are the most common (65.2%), reflecting the local real estate landscape.
- Houses represent a significant 65.2% portion, catering likely to families or larger groups.
- The presence of 8.7% Hotel/Boutique listings indicates integration with traditional hospitality.
Les Andelys Airbnb Room Capacity Analysis (2025): Bedroom Distribution
Distribution of Listings by Number of Bedrooms
Room Capacity Insights for Les Andelys
- The dominant room capacity in Les Andelys is 1 bedroom listings, making up 21.7% of the market. This suggests a strong demand for properties suitable for couples or solo travelers.
- Together, 1 bedroom and 2 bedrooms properties represent 39.1% of the active Airbnb listings in Les Andelys, indicating a high concentration in these sizes.
- A significant 39.1% of listings offer 3+ bedrooms, catering to larger groups and families seeking more space in Les Andelys.
Les Andelys Vacation Rental Guest Capacity Trends (2025)
Distribution of Listings by Guest Capacity
Guest Capacity Insights for Les Andelys
- The most common guest capacity trend in Les Andelys vacation rentals is listings accommodating 8+ guests (30.4%). This suggests the primary traveler segment is likely larger groups.
- Properties designed for 8+ guests and 2 guests dominate the Les Andelys STR market, accounting for 47.8% of listings.
- 43.4% of properties accommodate 6+ guests, serving the market segment for larger families or group travel in Les Andelys.
- On average, properties in Les Andelys are equipped to host 4.7 guests.
Les Andelys Airbnb Booking Patterns (2025): Available vs. Booked Days
Available Days Distribution
Booked Days Distribution
Booking Pattern Insights for Les Andelys
- The most common availability pattern in Les Andelys falls within the 271-366 days range, representing 56.5% of listings. This suggests many properties have significant open periods on their calendars.
- Approximately 78.2% of listings show high availability (181+ days open annually), indicating potential for increased bookings or specific owner usage patterns.
- For booked days, the 31-90 days range is most frequent in Les Andelys (39.1%), reflecting common guest stay durations or potential owner blocking patterns.
- A notable 21.7% of properties secure long booking periods (181+ days booked per year), highlighting successful long-term rental strategies or significant owner usage.
Les Andelys Airbnb Minimum Stay Requirements Analysis
Distribution of Listings by Minimum Night Requirement
1 Night
10 listings
47.6% of total
2 Nights
7 listings
33.3% of total
3 Nights
2 listings
9.5% of total
4-6 Nights
1 listings
4.8% of total
30+ Nights
1 listings
4.8% of total
Key Insights
- The most prevalent minimum stay requirement in Les Andelys is 1 Night, adopted by 47.6% of listings. This highlights the market's preference for shorter, flexible bookings.
- A strong majority (80.9%) of the Les Andelys Airbnb data shows acceptance of very short stays (1-2 nights), indicating a dynamic, high-turnover market.
Recommendations
- Align with the market by considering a 1 Night minimum stay, as 47.6% of Les Andelys hosts use this setting.
- Adjust minimum nights based on seasonality – potentially shorter during low season and longer during peak demand periods in Les Andelys.
Les Andelys Airbnb Cancellation Policy Trends Analysis (2025)
Flexible
6 listings
31.6% of total
Moderate
10 listings
52.6% of total
Firm
2 listings
10.5% of total
Strict
1 listings
5.3% of total
Cancellation Policy Insights for Les Andelys
- The prevailing Airbnb cancellation policy trend in Les Andelys is Moderate, used by 52.6% of listings.
- The market strongly favors guest-friendly terms, with 84.2% of listings offering Flexible or Moderate policies. This suggests guests in Les Andelys may expect booking flexibility.
- Strict cancellation policies are quite rare (5.3%), potentially making listings with this policy less competitive unless justified by high demand or property type.
Recommendations for Hosts
- Consider adopting a Moderate policy to align with the 52.6% market standard in Les Andelys.
- Using a Strict policy might deter some guests, as only 5.3% of listings use it. Evaluate if potential revenue protection outweighs possible lower booking rates.
- Regularly review your cancellation policy against competitors and market demand shifts in Les Andelys.
Les Andelys STR Booking Lead Time Analysis (2025)
Average Booking Lead Time by Month
Booking Lead Time Insights for Les Andelys
- The overall average booking lead time for vacation rentals in Les Andelys is 46 days.
- Guests book furthest in advance for stays during May (average 118 days), likely coinciding with peak travel demand or local events.
- The shortest booking windows occur for stays in February (average 24 days), indicating more last-minute travel plans during this time.
- Seasonally, Summer (71 days avg.) sees the longest lead times, while Winter (35 days avg.) has the shortest, reflecting typical travel planning cycles.
Recommendations for Hosts
- Use the overall average lead time (46 days) as a baseline for your pricing and availability strategy in Les Andelys.
- For May stays, consider implementing length-of-stay discounts or slightly higher rates for bookings made less than 118 days out to capitalize on advance planning.
- Target marketing efforts for the Summer season well in advance (at least 71 days) to capture early planners.
- Monitor your own booking lead times against these Les Andelys averages to identify opportunities for dynamic pricing adjustments.
Popular & Essential Airbnb Amenities in Les Andelys (2025)
Amenity Prevalence
Amenity Insights for Les Andelys
- Essential amenities in Les Andelys that guests expect include: Wifi, Heating, Hot water, Smoke alarm, TV. Lacking these (any) could significantly impact bookings.
- Popular amenities like Bed linens, Hangers, Kitchen are common but not universal. Offering these can provide a competitive edge.
Recommendations for Hosts
- Ensure your listing includes all essential amenities for Les Andelys: Wifi, Heating, Hot water, Smoke alarm, TV.
- Prioritize adding missing essentials: Hot water, Smoke alarm, TV.
- Consider adding popular differentiators like Bed linens or Hangers to increase appeal.
- Highlight unique or less common amenities you offer (e.g., hot tub, dedicated workspace, EV charger) in your listing description and photos.
- Regularly check competitor amenities in Les Andelys to stay competitive.
Les Andelys Airbnb Guest Demographics & Profile Analysis (2025)
Guest Profile Summary for Les Andelys
- The typical guest profile for Airbnb in Les Andelys consists of primarily domestic travelers (76%), often arriving from nearby Paris, typically belonging to the Post-2000s (Gen Z/Alpha) group (50%), primarily speaking French or English.
- Domestic travelers account for 76.1% of guests.
- Key international markets include France (76.1%) and United Kingdom (7.5%).
- Top languages spoken are French (42.7%) followed by English (34.8%).
- A significant demographic segment is the Post-2000s (Gen Z/Alpha) group, representing 50% of guests.
Recommendations for Hosts
- Target domestic marketing efforts towards travelers from Paris and England.
- Tailor amenities and listing descriptions to appeal to the dominant Post-2000s (Gen Z/Alpha) demographic (e.g., highlight fast WiFi, smart home features, local guides).
- Highlight unique local experiences or amenities relevant to the primary guest profile.
- Consider seasonal promotions aligned with peak travel times for key origin markets.
Nearby Short-Term Rental Market Comparison
How does the Les Andelys Airbnb market stack up against its neighbors? Compare key performance metrics like average monthly revenue, ADR, and occupancy rates in surrounding areas to understand the broader regional STR landscape.
| Market | Active Properties | Monthly Revenue | Daily Rate | Avg. Occupancy |
|---|---|---|---|---|
| Lo-Reninge | 12 | $6,193 | $432.10 | 49% |
| Morienval | 10 | $5,794 | $400.84 | 32% |
| La Poterie-Cap-d'Antifer | 11 | $5,076 | $293.95 | 55% |
| Bonneville-sur-Touques | 16 | $3,903 | $367.00 | 40% |
| Luneray | 12 | $3,745 | $526.24 | 42% |
| La Couture-Boussey | 12 | $3,620 | $378.08 | 28% |
| Dourdan | 15 | $3,576 | $223.06 | 52% |
| Rosoy-en-Multien | 15 | $3,558 | $367.61 | 51% |
| Saint-Étienne-la-Thillaye | 24 | $3,459 | $325.89 | 42% |
| Cricquebœuf | 10 | $3,417 | $268.29 | 46% |