Le Val-Saint-Père Airbnb Market Analysis 2025: Short Term Rental Data & Vacation Rental Statistics in Normandy, France
Is Airbnb profitable in Le Val-Saint-Père in 2025? Explore comprehensive Airbnb analytics for Le Val-Saint-Père, Normandy, France to uncover income potential. This 2025 STR market report for Le Val-Saint-Père, based on AirROI data from April 2024 to March 2025, reveals key trends in the niche market of 31 active listings.
Whether you're considering an Airbnb investment in Le Val-Saint-Père, optimizing your existing vacation rental, or exploring rental arbitrage opportunities, understanding the Le Val-Saint-Père Airbnb data is crucial. Leveraging the low regulation environment is key to maximizing your short term rental income potential. Let's dive into the specifics.
Key Le Val-Saint-Père Airbnb Performance Metrics Overview
Monthly Airbnb Revenue Variations & Income Potential in Le Val-Saint-Père (2025)
Understanding the monthly revenue variations for Airbnb listings in Le Val-Saint-Père is key to maximizing your short term rental income potential. Seasonality significantly impacts earnings. Our analysis, based on data from the past 12 months, shows that the peak revenue month for STRs in Le Val-Saint-Père is typically August, while March often presents the lowest earnings, highlighting opportunities for strategic pricing adjustments during shoulder and low seasons. Explore the typical Airbnb income in Le Val-Saint-Père across different performance tiers:
- Best-in-class properties (Top 10%) achieve $3,437+ monthly, often utilizing dynamic pricing and superior guest experiences.
- Strong performing properties (Top 25%) earn $2,307 or more, indicating effective management and desirable locations/amenities.
- Typical properties (Median) generate around $1,417 per month, representing the average market performance.
- Entry-level properties (Bottom 25%) see earnings around $776, often with potential for optimization.
Average Monthly Airbnb Earnings Trend in Le Val-Saint-Père
Le Val-Saint-Père Airbnb Occupancy Rate Trends (2025)
Maximize your bookings by understanding the Le Val-Saint-Père STR occupancy trends. Seasonal demand shifts significantly influence how often properties are booked. Typically, Augustsees the highest demand (peak season occupancy), while January experiences the lowest (low season). Effective strategies, like adjusting minimum stays or offering promotions, can boost occupancy during slower periods. Here's how different property tiers perform in Le Val-Saint-Père:
- Best-in-class properties (Top 10%) achieve 82%+ occupancy, indicating high desirability and potentially optimized availability.
- Strong performing properties (Top 25%) maintain 65% or higher occupancy, suggesting good market fit and guest satisfaction.
- Typical properties (Median) have an occupancy rate around 39%.
- Entry-level properties (Bottom 25%) average 19% occupancy, potentially facing higher vacancy.
Average Monthly Occupancy Rate Trend in Le Val-Saint-Père
Average Daily Rate (ADR) Airbnb Trends in Le Val-Saint-Père (2025)
Effective short term rental pricing strategy in Le Val-Saint-Père involves understanding monthly ADR fluctuations. The Average Daily Rate (ADR) for Airbnb in Le Val-Saint-Père typically peaks in July and dips lowest during March. Leveraging Airbnb dynamic pricing tools or strategies based on this seasonality can significantly boost revenue. Here's a look at the typical nightly rates achieved:
- Best-in-class properties (Top 10%) command rates of $286+ per night, often due to premium features or locations.
- Strong performing properties (Top 25%) achieve nightly rates of $145 or more.
- Typical properties (Median) charge around $103 per night.
- Entry-level properties (Bottom 25%) earn around $76 per night.
Average Daily Rate (ADR) Trend by Month in Le Val-Saint-Père
Get Live Le Val-Saint-Père Market Intelligence 👇

Explore Real-time Analytics
Airbnb Seasonality Analysis & Trends in Le Val-Saint-Père (2025)
Peak Season (August, July, May)
- Revenue averages $2,609 per month
- Occupancy rates average 55.4%
- Daily rates average $140
Shoulder Season
- Revenue averages $1,704 per month
- Occupancy maintains around 42.4%
- Daily rates hold near $135
Low Season (January, March, November)
- Revenue drops to average $1,185 per month
- Occupancy decreases to average 34.0%
- Daily rates adjust to average $131
Seasonality Insights for Le Val-Saint-Père
- The Airbnb seasonality in Le Val-Saint-Père shows highly seasonal trends requiring careful strategy. While the sections above show seasonal averages, it's also insightful to look at the extremes:
- During the high season, the absolute peak month showcases Le Val-Saint-Père's highest earning potential, with monthly revenues capable of climbing to $2,911, occupancy reaching a high of 63.3%, and ADRs peaking at $142.
- Conversely, the slowest single month of the year, typically falling within the low season, marks the market's lowest point. In this month, revenue might dip to $1,071, occupancy could drop to 31.2%, and ADRs may adjust down to $128.
- Understanding both the seasonal averages and these monthly peaks and troughs in revenue, occupancy, and ADR is crucial for maximizing your Airbnb profit potential in Le Val-Saint-Père.
Seasonal Strategies for Maximizing Profit
- Peak Season: Maximize revenue through premium pricing and potentially longer minimum stays. Ensure high availability.
- Low Season: Offer competitive pricing, special promotions (e.g., extended stay discounts), and flexible cancellation policies. Target off-season travelers like remote workers or budget-conscious guests.
- Shoulder Seasons: Implement dynamic pricing that balances peak and low rates. Target weekend travelers or specific events. Offer slightly more flexible terms than peak season.
- Regularly analyze your own performance against these Le Val-Saint-Père seasonality benchmarks and adjust your pricing and availability strategy accordingly.
Best Areas for Airbnb Investment in Le Val-Saint-Père (2025)
Exploring the top neighborhoods for short-term rentals in Le Val-Saint-Père? This section highlights key areas, outlining why they are attractive for hosts and guests, along with notable local attractions. Consider these locations based on your target guest profile and investment strategy.
| Neighborhood / Area | Why Host Here? (Target Guests & Appeal) | Key Attractions & Landmarks |
|---|---|---|
| Mont Saint-Michel | Iconic UNESCO World Heritage site, attracting millions of tourists every year. A romantic destination with stunning views and rich history, perfect for cultural and scenic stays. | Mont Saint-Michel Abbey, Musee Historique, Les Remparts, Eglise Saint-Pierre, La Grande Rue |
| Granville | Picturesque coastal town known as the 'Monaco of the North'. Offers beautiful beaches, maritime heritage, and a vibrant town center, ideal for attracting vacationers and families. | Granville Casino, Christian Dior Museum, Granville Beach, Fortifications, Promenade du Plat Gousset |
| Avranches | A charming town with a rich history and proximity to Mont Saint-Michel. Attractions draw visitors interested in medieval history and scenic countryside. | Scriptorial d'Avranches Museum, Avranches Abbey, Jardin des Plantes, Mont Saint-Michel views |
| Saint-Malo | Historic coastal city with well-preserved ramparts and a famous beach. Popular with tourists for its history and seaside attractions. | Saint-Malo Fortress, Grand Bé, Porte Saint-Vincent, St. Vincent's Cathedral, Solidor Tower |
| Caen | City rich in history, offers a mix of cultural and historical attractions. Ideal for those interested in World War II history and French history. | Caen Memorial Museum, Chateau de Caen, Abbey of Saint-Étienne, Abbey of Saint-Ouen, Jardin des plantes |
| Carentan | Gateway to the D-Day beaches, attracts history buffs and military enthusiasts. Offers a charming town atmosphere and close proximity to key historical sites. | Museum of the Battle of Normandy, The Church of Carentan, Cité de la Mer |
| Cherbourg | Major port city with maritime heritage and access to beautiful coastline. Popular with tourists visiting the nearby islands and beaches. | Cité de la Mer, La Hague, Cherbourg Harbour, Fort du Roule, Bassin du Commerce |
| Colombelles | Small town close to Caen, offering a unique charm and access to Normandy's historical landscape. A quieter alternative for tourists seeking tranquility. | Parc des Hautes Deules, Colombelles Town Hall, Local markets |
Understanding Airbnb License Requirements & STR Laws in Le Val-Saint-Père (2025)
While Le Val-Saint-Père, Normandy, France currently shows low STR regulations, specific Airbnb license requirements might still exist or change. Always verify the latest short term rental regulations and Airbnb license requirements directly with local government authorities for Le Val-Saint-Père to ensure full compliance before hosting.
(Source: AirROI data, 2025, finding no licensed listings among those analyzed)
Top Performing Airbnb Properties in Le Val-Saint-Père (2025)
Benchmark your potential! Explore examples of top-performing Airbnb properties in Le Val-Saint-Pèrebased on Trailing Twelve Month (TTM) revenue. Analyze their characteristics, revenue, occupancy rate, and ADR to understand what drives success in this market.

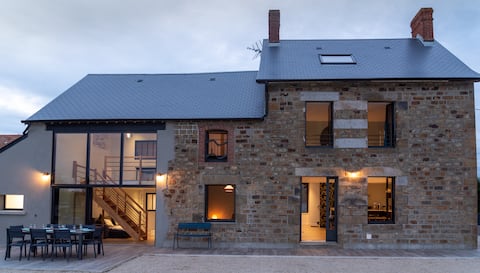
Family home in the Bay of Mt St Michel
Entire Place • 5 bedrooms
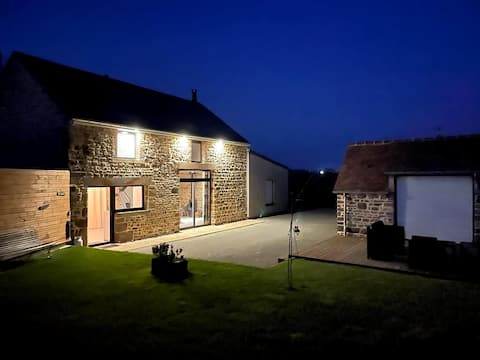
Large longère, in the Bay of Mont Saint Michel.
Entire Place • 4 bedrooms
Gite de la Maraîcherie
Entire Place • 5 bedrooms
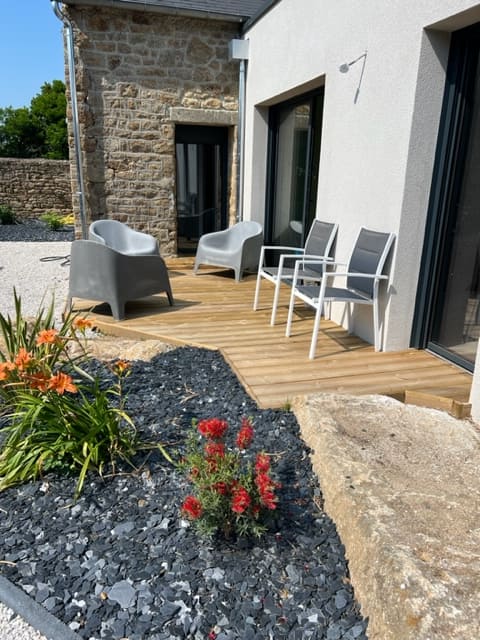
Maison en Baie du Mont St Michel
Entire Place • 3 bedrooms
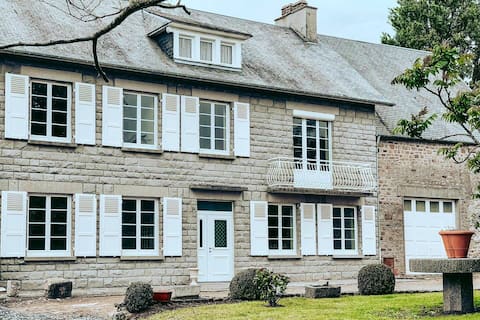
🏡 La Butte - Avranches overlooking Le Mont St Michel
Entire Place • 4 bedrooms
Cottage La Petit guette
Entire Place • 2 bedrooms
Note: Performance varies based on location, size, amenities, seasonality, and management quality. Data reflects the past 12 months.
Top Performing Airbnb Hosts in Le Val-Saint-Père (2025)
Learn from the best! This table showcases top-performing Airbnb hosts in Le Val-Saint-Père based on the number of properties managed and estimated total revenue over the past year. Analyze their scale and performance metrics.
| Host Name | Properties | Grossing Revenue | Stay Reviews | Avg Rating |
|---|---|---|---|---|
| Sylvie | 1 | $49,047 | 115 | 4.90/5.0 |
| Marie-Aude Et Régis | 1 | $46,378 | 85 | 4.99/5.0 |
| Isabelle | 2 | $31,372 | 49 | 4.97/5.0 |
| Dorothée Et Julien | 1 | $30,511 | 154 | 4.94/5.0 |
| Jerome | 1 | $26,844 | 11 | 4.82/5.0 |
| Chaumont | 1 | $25,197 | 15 | 5.00/5.0 |
| Pauline Et Karine | 1 | $24,763 | 25 | 4.64/5.0 |
| Manon | 1 | $23,249 | 220 | 4.91/5.0 |
| Francois | 1 | $22,779 | 18 | 4.78/5.0 |
| Dee | 1 | $22,237 | 222 | 4.94/5.0 |
Analyzing the strategies of top hosts, such as their property selection, pricing, and guest communication, can offer valuable lessons for optimizing your own Airbnb operations in Le Val-Saint-Père.
Dive Deeper: Advanced Le Val-Saint-Père STR Market Data (2025)
Ready to unlock more insights? AirROI provides access to advanced metrics and comprehensive Airbnb data for Le Val-Saint-Père. Explore detailed analytics beyond this report to refine your investment strategy, optimize pricing, and maximize your vacation rental profits.
Explore Advanced MetricsLe Val-Saint-Père Short-Term Rental Market Composition (2025): Property & Room Types
Room Type Distribution
Property Type Distribution
Market Composition Insights for Le Val-Saint-Père
- The Le Val-Saint-Père Airbnb market composition is heavily skewed towards Entire Home/Apt listings, which make up 77.4% of the 31 active rentals. This indicates strong guest preference for privacy and space.
- Looking at the property type distribution in Le Val-Saint-Père, House properties are the most common (67.7%), reflecting the local real estate landscape.
- Houses represent a significant 67.7% portion, catering likely to families or larger groups.
- The presence of 25.8% Hotel/Boutique listings indicates integration with traditional hospitality.
- Smaller segments like outdoor/unique, apartment/condo (combined 6.4%) offer potential for unique stay experiences.
Le Val-Saint-Père Airbnb Room Capacity Analysis (2025): Bedroom Distribution
Distribution of Listings by Number of Bedrooms
Room Capacity Insights for Le Val-Saint-Père
- The dominant room capacity in Le Val-Saint-Père is 1 bedroom listings, making up 32.3% of the market. This suggests a strong demand for properties suitable for couples or solo travelers.
- Together, 1 bedroom and 2 bedrooms properties represent 54.9% of the active Airbnb listings in Le Val-Saint-Père, indicating a high concentration in these sizes.
- A significant 29.1% of listings offer 3+ bedrooms, catering to larger groups and families seeking more space in Le Val-Saint-Père.
Le Val-Saint-Père Vacation Rental Guest Capacity Trends (2025)
Distribution of Listings by Guest Capacity
Guest Capacity Insights for Le Val-Saint-Père
- The most common guest capacity trend in Le Val-Saint-Père vacation rentals is listings accommodating 4 guests (25.8%). This suggests the primary traveler segment is likely small families or groups.
- Properties designed for 4 guests and 8+ guests dominate the Le Val-Saint-Père STR market, accounting for 45.2% of listings.
- 35.5% of properties accommodate 6+ guests, serving the market segment for larger families or group travel in Le Val-Saint-Père.
- On average, properties in Le Val-Saint-Père are equipped to host 4.2 guests.
Le Val-Saint-Père Airbnb Booking Patterns (2025): Available vs. Booked Days
Available Days Distribution
Booked Days Distribution
Booking Pattern Insights for Le Val-Saint-Père
- The most common availability pattern in Le Val-Saint-Père falls within the 181-270 days range, representing 35.5% of listings. This suggests many properties have significant open periods on their calendars.
- Approximately 67.8% of listings show high availability (181+ days open annually), indicating potential for increased bookings or specific owner usage patterns.
- For booked days, the 181-270 days range is most frequent in Le Val-Saint-Père (32.3%), reflecting common guest stay durations or potential owner blocking patterns.
- A notable 35.5% of properties secure long booking periods (181+ days booked per year), highlighting successful long-term rental strategies or significant owner usage.
Le Val-Saint-Père Airbnb Minimum Stay Requirements Analysis
Distribution of Listings by Minimum Night Requirement
1 Night
9 listings
30% of total
2 Nights
15 listings
50% of total
3 Nights
4 listings
13.3% of total
4-6 Nights
2 listings
6.7% of total
Key Insights
- The most prevalent minimum stay requirement in Le Val-Saint-Père is 2 Nights, adopted by 50% of listings. This highlights the market's preference for shorter, flexible bookings.
- A strong majority (80.0%) of the Le Val-Saint-Père Airbnb data shows acceptance of very short stays (1-2 nights), indicating a dynamic, high-turnover market.
Recommendations
- Align with the market by considering a 2 Nights minimum stay, as 50% of Le Val-Saint-Père hosts use this setting.
- Adjust minimum nights based on seasonality – potentially shorter during low season and longer during peak demand periods in Le Val-Saint-Père.
Le Val-Saint-Père Airbnb Cancellation Policy Trends Analysis (2025)
Flexible
4 listings
13.3% of total
Moderate
11 listings
36.7% of total
Firm
9 listings
30% of total
Strict
6 listings
20% of total
Cancellation Policy Insights for Le Val-Saint-Père
- The prevailing Airbnb cancellation policy trend in Le Val-Saint-Père is Moderate, used by 36.7% of listings.
- There's a relatively balanced mix between guest-friendly (50.0%) and stricter (50.0%) policies, offering choices for different guest needs.
Recommendations for Hosts
- Consider adopting a Moderate policy to align with the 36.7% market standard in Le Val-Saint-Père.
- Regularly review your cancellation policy against competitors and market demand shifts in Le Val-Saint-Père.
Le Val-Saint-Père STR Booking Lead Time Analysis (2025)
Average Booking Lead Time by Month
Booking Lead Time Insights for Le Val-Saint-Père
- The overall average booking lead time for vacation rentals in Le Val-Saint-Père is 72 days.
- Guests book furthest in advance for stays during July (average 135 days), likely coinciding with peak travel demand or local events.
- The shortest booking windows occur for stays in February (average 37 days), indicating more last-minute travel plans during this time.
- Seasonally, Summer (119 days avg.) sees the longest lead times, while Winter (44 days avg.) has the shortest, reflecting typical travel planning cycles.
Recommendations for Hosts
- Use the overall average lead time (72 days) as a baseline for your pricing and availability strategy in Le Val-Saint-Père.
- For July stays, consider implementing length-of-stay discounts or slightly higher rates for bookings made less than 135 days out to capitalize on advance planning.
- Target marketing efforts for the Summer season well in advance (at least 119 days) to capture early planners.
- Monitor your own booking lead times against these Le Val-Saint-Père averages to identify opportunities for dynamic pricing adjustments.
Popular & Essential Airbnb Amenities in Le Val-Saint-Père (2025)
Amenity Prevalence
Amenity Insights for Le Val-Saint-Père
- Popular amenities like Heating, TV, Dishes and silverware are common but not universal. Offering these can provide a competitive edge.
Recommendations for Hosts
- Consider adding popular differentiators like Heating or TV to increase appeal.
- Highlight unique or less common amenities you offer (e.g., hot tub, dedicated workspace, EV charger) in your listing description and photos.
- Regularly check competitor amenities in Le Val-Saint-Père to stay competitive.
Le Val-Saint-Père Airbnb Guest Demographics & Profile Analysis (2025)
Guest Profile Summary for Le Val-Saint-Père
- The typical guest profile for Airbnb in Le Val-Saint-Père consists of primarily domestic travelers (72%), often arriving from nearby Paris, typically belonging to the Post-2000s (Gen Z/Alpha) group (50%), primarily speaking French or English.
- Domestic travelers account for 71.6% of guests.
- Key international markets include France (71.6%) and United Kingdom (5.1%).
- Top languages spoken are French (37.9%) followed by English (35.7%).
- A significant demographic segment is the Post-2000s (Gen Z/Alpha) group, representing 50% of guests.
Recommendations for Hosts
- Target domestic marketing efforts towards travelers from Paris and Nantes.
- Tailor amenities and listing descriptions to appeal to the dominant Post-2000s (Gen Z/Alpha) demographic (e.g., highlight fast WiFi, smart home features, local guides).
- Highlight unique local experiences or amenities relevant to the primary guest profile.
- Consider seasonal promotions aligned with peak travel times for key origin markets.
Nearby Short-Term Rental Market Comparison
How does the Le Val-Saint-Père Airbnb market stack up against its neighbors? Compare key performance metrics like average monthly revenue, ADR, and occupancy rates in surrounding areas to understand the broader regional STR landscape.
| Market | Active Properties | Monthly Revenue | Daily Rate | Avg. Occupancy |
|---|---|---|---|---|
| St Martin | 14 | $4,074 | $436.70 | 51% |
| Moulins-le-Carbonnel | 11 | $3,213 | $320.85 | 35% |
| Gonneville-en-Auge | 12 | $3,061 | $235.90 | 40% |
| Vallon-sur-Gée | 11 | $2,913 | $379.01 | 30% |
| Saint Lawrence | 11 | $2,911 | $317.86 | 52% |
| Auberville | 22 | $2,777 | $249.63 | 36% |
| St Ouen | 15 | $2,635 | $339.51 | 51% |
| Chambellay | 11 | $2,525 | $255.24 | 34% |
| St Clement | 14 | $2,522 | $219.76 | 51% |
| Grouville | 21 | $2,510 | $218.40 | 52% |