La Cerlangue Airbnb Market Analysis 2025: Short Term Rental Data & Vacation Rental Statistics in Normandy, France
Is Airbnb profitable in La Cerlangue in 2025? Explore comprehensive Airbnb analytics for La Cerlangue, Normandy, France to uncover income potential. This 2025 STR market report for La Cerlangue, based on AirROI data from April 2024 to March 2025, reveals key trends in the niche market of 21 active listings.
Whether you're considering an Airbnb investment in La Cerlangue, optimizing your existing vacation rental, or exploring rental arbitrage opportunities, understanding the La Cerlangue Airbnb data is crucial. Understanding the local regulations is key to maximizing your short term rental income potential. Let's dive into the specifics.
Key La Cerlangue Airbnb Performance Metrics Overview
Monthly Airbnb Revenue Variations & Income Potential in La Cerlangue (2025)
Understanding the monthly revenue variations for Airbnb listings in La Cerlangue is key to maximizing your short term rental income potential. Seasonality significantly impacts earnings. Our analysis, based on data from the past 12 months, shows that the peak revenue month for STRs in La Cerlangue is typically August, while January often presents the lowest earnings, highlighting opportunities for strategic pricing adjustments during shoulder and low seasons. Explore the typical Airbnb income in La Cerlangue across different performance tiers:
- Best-in-class properties (Top 10%) achieve $5,673+ monthly, often utilizing dynamic pricing and superior guest experiences.
- Strong performing properties (Top 25%) earn $1,902 or more, indicating effective management and desirable locations/amenities.
- Typical properties (Median) generate around $832 per month, representing the average market performance.
- Entry-level properties (Bottom 25%) see earnings around $461, often with potential for optimization.
Average Monthly Airbnb Earnings Trend in La Cerlangue
La Cerlangue Airbnb Occupancy Rate Trends (2025)
Maximize your bookings by understanding the La Cerlangue STR occupancy trends. Seasonal demand shifts significantly influence how often properties are booked. Typically, Augustsees the highest demand (peak season occupancy), while December experiences the lowest (low season). Effective strategies, like adjusting minimum stays or offering promotions, can boost occupancy during slower periods. Here's how different property tiers perform in La Cerlangue:
- Best-in-class properties (Top 10%) achieve 63%+ occupancy, indicating high desirability and potentially optimized availability.
- Strong performing properties (Top 25%) maintain 44% or higher occupancy, suggesting good market fit and guest satisfaction.
- Typical properties (Median) have an occupancy rate around 26%.
- Entry-level properties (Bottom 25%) average 13% occupancy, potentially facing higher vacancy.
Average Monthly Occupancy Rate Trend in La Cerlangue
Average Daily Rate (ADR) Airbnb Trends in La Cerlangue (2025)
Effective short term rental pricing strategy in La Cerlangue involves understanding monthly ADR fluctuations. The Average Daily Rate (ADR) for Airbnb in La Cerlangue typically peaks in December and dips lowest during March. Leveraging Airbnb dynamic pricing tools or strategies based on this seasonality can significantly boost revenue. Here's a look at the typical nightly rates achieved:
- Best-in-class properties (Top 10%) command rates of $362+ per night, often due to premium features or locations.
- Strong performing properties (Top 25%) achieve nightly rates of $132 or more.
- Typical properties (Median) charge around $95 per night.
- Entry-level properties (Bottom 25%) earn around $71 per night.
Average Daily Rate (ADR) Trend by Month in La Cerlangue
Get Live La Cerlangue Market Intelligence 👇

Explore Real-time Analytics
Airbnb Seasonality Analysis & Trends in La Cerlangue (2025)
Peak Season (August, July, May)
- Revenue averages $3,048 per month
- Occupancy rates average 46.2%
- Daily rates average $168
Shoulder Season
- Revenue averages $1,917 per month
- Occupancy maintains around 27.9%
- Daily rates hold near $163
Low Season (January, February, December)
- Revenue drops to average $1,468 per month
- Occupancy decreases to average 23.5%
- Daily rates adjust to average $164
Seasonality Insights for La Cerlangue
- The Airbnb seasonality in La Cerlangue shows highly seasonal trends requiring careful strategy. While the sections above show seasonal averages, it's also insightful to look at the extremes:
- During the high season, the absolute peak month showcases La Cerlangue's highest earning potential, with monthly revenues capable of climbing to $3,662, occupancy reaching a high of 54.0%, and ADRs peaking at $175.
- Conversely, the slowest single month of the year, typically falling within the low season, marks the market's lowest point. In this month, revenue might dip to $1,008, occupancy could drop to 20.0%, and ADRs may adjust down to $153.
- Understanding both the seasonal averages and these monthly peaks and troughs in revenue, occupancy, and ADR is crucial for maximizing your Airbnb profit potential in La Cerlangue.
Seasonal Strategies for Maximizing Profit
- Peak Season: Maximize revenue through premium pricing and potentially longer minimum stays. Ensure high availability.
- Low Season: Offer competitive pricing, special promotions (e.g., extended stay discounts), and flexible cancellation policies. Target off-season travelers like remote workers or budget-conscious guests.
- Shoulder Seasons: Implement dynamic pricing that balances peak and low rates. Target weekend travelers or specific events. Offer slightly more flexible terms than peak season.
- Regularly analyze your own performance against these La Cerlangue seasonality benchmarks and adjust your pricing and availability strategy accordingly.
Best Areas for Airbnb Investment in La Cerlangue (2025)
Exploring the top neighborhoods for short-term rentals in La Cerlangue? This section highlights key areas, outlining why they are attractive for hosts and guests, along with notable local attractions. Consider these locations based on your target guest profile and investment strategy.
| Neighborhood / Area | Why Host Here? (Target Guests & Appeal) | Key Attractions & Landmarks |
|---|---|---|
| La Cerlangue Village Center | Charming village center with local amenities, making it appealing for both tourists and short-term rentals. Nearby attractions include local markets and French cuisine experiences. | Local Markets, Cafés and Bistros, Historical Buildings |
| Nearby Côte d'Albâtre | Known for stunning coastal views and beautiful cliffs. A favorite spot for nature lovers and beachgoers, ideal for Airbnb hosting during summer months. | Etretat Cliffs, Beach Access, Hiking Trails |
| Saint-Valery-en-Caux | A picturesque port town offering beautiful views and maritime activities, attracting visitors interested in history and the seaside. | Saint-Valery Harbour, Historical Sites, Beaches |
| Fécamp | Rich in history and culture, Fécamp offers historic sites and a scenic coastline. Popular for tourists looking to explore Normandy's heritage. | Palais Bénédictine, Fécamp Beach, Cultural Festivals |
| Rouen | While a bit further away, Rouen's vibrant city atmosphere and historical architecture make it a great option for attracting guests looking for city life amidst historical charm. | Rouen Cathedral, Joan of Arc Museum, Historic Center |
| Honfleur | A picturesque town known for its beautiful harbor and art scene, frequented by artists and tourists alike. A hotspot for Airbnb listings due to its romantic appeal. | Old Harbor, Art Galleries, Saint Catherine's Church |
| Dieppe | A coastal town famous for its beaches and historical significance, attracting visitors year-round. Great for hosting tourists looking for beach activities and history. | Dieppe Castle, Pebble Beach, Sea Activities |
| Cany-Barville | A smaller town close to nature and offering a tranquil setting. Popular among those seeking a quiet getaway, yet close enough to major attractions. | Rural Walking Trails, Local Culture, Nature Parks |
Understanding Airbnb License Requirements & STR Laws in La Cerlangue (2025)
With 14% of listings showing registration in 2025, understanding potential Airbnb license requirements is crucial in La Cerlangue. Always verify the latest short term rental regulations and Airbnb license requirements directly with local government authorities for La Cerlangue to ensure full compliance before hosting.
(Source: AirROI data, 2025, based on 14% licensed listings)
Top Performing Airbnb Properties in La Cerlangue (2025)
Benchmark your potential! Explore examples of top-performing Airbnb properties in La Cerlanguebased on Trailing Twelve Month (TTM) revenue. Analyze their characteristics, revenue, occupancy rate, and ADR to understand what drives success in this market.
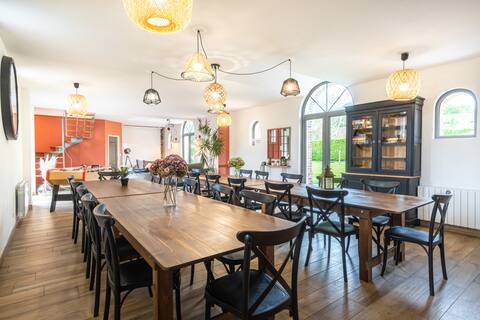
La Familiale 30persons between Etretat and Honfleur
Entire Place • 11 bedrooms
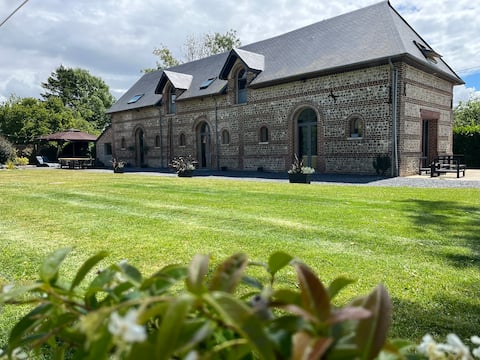
Les Guinguettes 15 pers between Etretat and Honfleur
Entire Place • 5 bedrooms

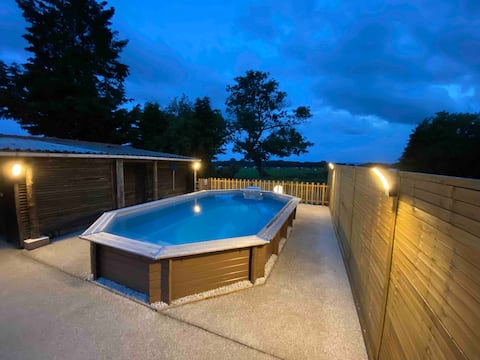
Le Pavillon gîte 15 pers between Etretat and Honfleur
Entire Place • 6 bedrooms
Gite La Paillotte
Entire Place • 4 bedrooms

Dormir dans une ferme d'alpagas en Normandie
Entire Place • 2 bedrooms

Bedroom Alabaster - Park view
Private Room • N/A
Note: Performance varies based on location, size, amenities, seasonality, and management quality. Data reflects the past 12 months.
Top Performing Airbnb Hosts in La Cerlangue (2025)
Learn from the best! This table showcases top-performing Airbnb hosts in La Cerlangue based on the number of properties managed and estimated total revenue over the past year. Analyze their scale and performance metrics.
| Host Name | Properties | Grossing Revenue | Stay Reviews | Avg Rating |
|---|---|---|---|---|
| Elise | 3 | $302,623 | 58 | 4.85/5.0 |
| Manoir | 7 | $63,657 | 134 | 4.99/5.0 |
| Lea | 1 | $43,437 | 35 | 4.89/5.0 |
| Host #37593818 | 1 | $17,899 | 83 | 4.98/5.0 |
| Catherine | 2 | $14,430 | 35 | 4.75/5.0 |
| Host #11480029 | 2 | $13,462 | 40 | 5.00/5.0 |
| Valérie | 1 | $10,252 | 13 | 4.85/5.0 |
| Viviane | 1 | $8,591 | 159 | 4.79/5.0 |
| Elly | 1 | $6,468 | 154 | 4.74/5.0 |
| Benjamin | 1 | $6,370 | 29 | 4.83/5.0 |
Analyzing the strategies of top hosts, such as their property selection, pricing, and guest communication, can offer valuable lessons for optimizing your own Airbnb operations in La Cerlangue.
Dive Deeper: Advanced La Cerlangue STR Market Data (2025)
Ready to unlock more insights? AirROI provides access to advanced metrics and comprehensive Airbnb data for La Cerlangue. Explore detailed analytics beyond this report to refine your investment strategy, optimize pricing, and maximize your vacation rental profits.
Explore Advanced MetricsLa Cerlangue Short-Term Rental Market Composition (2025): Property & Room Types
Room Type Distribution
Property Type Distribution
Market Composition Insights for La Cerlangue
- The La Cerlangue Airbnb market composition is heavily skewed towards Private Room listings, which make up 66.7% of the 21 active rentals. This indicates strong guest preference for privacy and space.
- Looking at the property type distribution in La Cerlangue, Hotel/Boutique properties are the most common (47.6%), reflecting the local real estate landscape.
- Houses represent a significant 28.6% portion, catering likely to families or larger groups.
- The presence of 47.6% Hotel/Boutique listings indicates integration with traditional hospitality.
- Smaller segments like others, apartment/condo (combined 9.6%) offer potential for unique stay experiences.
La Cerlangue Airbnb Room Capacity Analysis (2025): Bedroom Distribution
Distribution of Listings by Number of Bedrooms
Room Capacity Insights for La Cerlangue
- The dominant room capacity in La Cerlangue is 1 bedroom listings, making up 19% of the market. This suggests a strong demand for properties suitable for couples or solo travelers.
- Together, 1 bedroom and 5+ bedrooms properties represent 33.3% of the active Airbnb listings in La Cerlangue, indicating a high concentration in these sizes.
La Cerlangue Vacation Rental Guest Capacity Trends (2025)
Distribution of Listings by Guest Capacity
Guest Capacity Insights for La Cerlangue
- The most common guest capacity trend in La Cerlangue vacation rentals is listings accommodating 8+ guests (19%). This suggests the primary traveler segment is likely larger groups.
- Properties designed for 8+ guests and 2 guests dominate the La Cerlangue STR market, accounting for 33.3% of listings.
- 23.8% of properties accommodate 6+ guests, serving the market segment for larger families or group travel in La Cerlangue.
- On average, properties in La Cerlangue are equipped to host 2.6 guests.
La Cerlangue Airbnb Booking Patterns (2025): Available vs. Booked Days
Available Days Distribution
Booked Days Distribution
Booking Pattern Insights for La Cerlangue
- The most common availability pattern in La Cerlangue falls within the 181-270 days range, representing 52.4% of listings. This suggests many properties have significant open periods on their calendars.
- Approximately 95.3% of listings show high availability (181+ days open annually), indicating potential for increased bookings or specific owner usage patterns.
- For booked days, the 91-180 days range is most frequent in La Cerlangue (52.4%), reflecting common guest stay durations or potential owner blocking patterns.
- A notable 4.8% of properties secure long booking periods (181+ days booked per year), highlighting successful long-term rental strategies or significant owner usage.
La Cerlangue Airbnb Minimum Stay Requirements Analysis
Distribution of Listings by Minimum Night Requirement
1 Night
11 listings
61.1% of total
2 Nights
6 listings
33.3% of total
30+ Nights
1 listings
5.6% of total
Key Insights
- The most prevalent minimum stay requirement in La Cerlangue is 1 Night, adopted by 61.1% of listings. This highlights the market's preference for shorter, flexible bookings.
- A strong majority (94.4%) of the La Cerlangue Airbnb data shows acceptance of very short stays (1-2 nights), indicating a dynamic, high-turnover market.
Recommendations
- Align with the market by considering a 1 Night minimum stay, as 61.1% of La Cerlangue hosts use this setting.
- Explore offering discounts for stays of 30+ nights to attract the 5.6% of the market seeking extended stays.
- Adjust minimum nights based on seasonality – potentially shorter during low season and longer during peak demand periods in La Cerlangue.
La Cerlangue Airbnb Cancellation Policy Trends Analysis (2025)
Flexible
8 listings
38.1% of total
Moderate
2 listings
9.5% of total
Firm
7 listings
33.3% of total
Strict
4 listings
19% of total
Cancellation Policy Insights for La Cerlangue
- The prevailing Airbnb cancellation policy trend in La Cerlangue is Flexible, used by 38.1% of listings.
- A majority (52.3%) of hosts in La Cerlangue utilize Firm or Strict policies, indicating a market where hosts prioritize booking security.
Recommendations for Hosts
- Consider adopting a Flexible policy to align with the 38.1% market standard in La Cerlangue.
- Regularly review your cancellation policy against competitors and market demand shifts in La Cerlangue.
La Cerlangue STR Booking Lead Time Analysis (2025)
Average Booking Lead Time by Month
Booking Lead Time Insights for La Cerlangue
- The overall average booking lead time for vacation rentals in La Cerlangue is 69 days.
- Guests book furthest in advance for stays during May (average 123 days), likely coinciding with peak travel demand or local events.
- The shortest booking windows occur for stays in February (average 33 days), indicating more last-minute travel plans during this time.
- Seasonally, Spring (93 days avg.) sees the longest lead times, while Winter (65 days avg.) has the shortest, reflecting typical travel planning cycles.
Recommendations for Hosts
- Use the overall average lead time (69 days) as a baseline for your pricing and availability strategy in La Cerlangue.
- For May stays, consider implementing length-of-stay discounts or slightly higher rates for bookings made less than 123 days out to capitalize on advance planning.
- Target marketing efforts for the Spring season well in advance (at least 93 days) to capture early planners.
- Monitor your own booking lead times against these La Cerlangue averages to identify opportunities for dynamic pricing adjustments.
Popular & Essential Airbnb Amenities in La Cerlangue (2025)
Amenity Prevalence
Amenity Insights for La Cerlangue
- Essential amenities in La Cerlangue that guests expect include: Heating, Hot water, Smoke alarm, Free parking on premises, Wifi. Lacking these (any) could significantly impact bookings.
- Popular amenities like Outdoor dining area, Hair dryer, Outdoor furniture are common but not universal. Offering these can provide a competitive edge.
Recommendations for Hosts
- Ensure your listing includes all essential amenities for La Cerlangue: Heating, Hot water, Smoke alarm, Free parking on premises, Wifi.
- Prioritize adding missing essentials: Wifi.
- Consider adding popular differentiators like Outdoor dining area or Hair dryer to increase appeal.
- Highlight unique or less common amenities you offer (e.g., hot tub, dedicated workspace, EV charger) in your listing description and photos.
- Regularly check competitor amenities in La Cerlangue to stay competitive.
La Cerlangue Airbnb Guest Demographics & Profile Analysis (2025)
Guest Profile Summary for La Cerlangue
- The typical guest profile for Airbnb in La Cerlangue consists of primarily domestic travelers (71%), often arriving from nearby Paris, typically belonging to the Post-2000s (Gen Z/Alpha) group (50%), primarily speaking English or French.
- Domestic travelers account for 71.1% of guests.
- Key international markets include France (71.1%) and Germany (7.8%).
- Top languages spoken are English (39.1%) followed by French (33.3%).
- A significant demographic segment is the Post-2000s (Gen Z/Alpha) group, representing 50% of guests.
Recommendations for Hosts
- Target domestic marketing efforts towards travelers from Paris and Milan.
- Tailor amenities and listing descriptions to appeal to the dominant Post-2000s (Gen Z/Alpha) demographic (e.g., highlight fast WiFi, smart home features, local guides).
- Highlight unique local experiences or amenities relevant to the primary guest profile.
- Consider seasonal promotions aligned with peak travel times for key origin markets.
Nearby Short-Term Rental Market Comparison
How does the La Cerlangue Airbnb market stack up against its neighbors? Compare key performance metrics like average monthly revenue, ADR, and occupancy rates in surrounding areas to understand the broader regional STR landscape.
| Market | Active Properties | Monthly Revenue | Daily Rate | Avg. Occupancy |
|---|---|---|---|---|
| La Poterie-Cap-d'Antifer | 11 | $5,076 | $293.95 | 55% |
| Bonneville-sur-Touques | 16 | $3,903 | $367.00 | 40% |
| Luneray | 12 | $3,745 | $526.24 | 42% |
| La Couture-Boussey | 12 | $3,620 | $378.08 | 28% |
| Roedean | 47 | $3,494 | $257.09 | 47% |
| Saint-Étienne-la-Thillaye | 24 | $3,459 | $325.89 | 42% |
| Cricquebœuf | 10 | $3,417 | $268.29 | 46% |
| Caumont | 11 | $3,350 | $286.17 | 49% |
| Moulins-le-Carbonnel | 11 | $3,213 | $320.85 | 35% |
| Gonneville-en-Auge | 12 | $3,061 | $235.90 | 40% |