Genneville Airbnb Market Analysis 2025: Short Term Rental Data & Vacation Rental Statistics in Normandy, France
Is Airbnb profitable in Genneville in 2025? Explore comprehensive Airbnb analytics for Genneville, Normandy, France to uncover income potential. This 2025 STR market report for Genneville, based on AirROI data from April 2024 to March 2025, reveals key trends in the niche market of 23 active listings.
Whether you're considering an Airbnb investment in Genneville, optimizing your existing vacation rental, or exploring rental arbitrage opportunities, understanding the Genneville Airbnb data is crucial. Understanding the local regulations is key to maximizing your short term rental income potential. Let's dive into the specifics.
Key Genneville Airbnb Performance Metrics Overview
Monthly Airbnb Revenue Variations & Income Potential in Genneville (2025)
Understanding the monthly revenue variations for Airbnb listings in Genneville is key to maximizing your short term rental income potential. Seasonality significantly impacts earnings. Our analysis, based on data from the past 12 months, shows that the peak revenue month for STRs in Genneville is typically August, while January often presents the lowest earnings, highlighting opportunities for strategic pricing adjustments during shoulder and low seasons. Explore the typical Airbnb income in Genneville across different performance tiers:
- Best-in-class properties (Top 10%) achieve $5,582+ monthly, often utilizing dynamic pricing and superior guest experiences.
- Strong performing properties (Top 25%) earn $3,521 or more, indicating effective management and desirable locations/amenities.
- Typical properties (Median) generate around $2,158 per month, representing the average market performance.
- Entry-level properties (Bottom 25%) see earnings around $1,145, often with potential for optimization.
Average Monthly Airbnb Earnings Trend in Genneville
Genneville Airbnb Occupancy Rate Trends (2025)
Maximize your bookings by understanding the Genneville STR occupancy trends. Seasonal demand shifts significantly influence how often properties are booked. Typically, Augustsees the highest demand (peak season occupancy), while January experiences the lowest (low season). Effective strategies, like adjusting minimum stays or offering promotions, can boost occupancy during slower periods. Here's how different property tiers perform in Genneville:
- Best-in-class properties (Top 10%) achieve 78%+ occupancy, indicating high desirability and potentially optimized availability.
- Strong performing properties (Top 25%) maintain 62% or higher occupancy, suggesting good market fit and guest satisfaction.
- Typical properties (Median) have an occupancy rate around 36%.
- Entry-level properties (Bottom 25%) average 22% occupancy, potentially facing higher vacancy.
Average Monthly Occupancy Rate Trend in Genneville
Average Daily Rate (ADR) Airbnb Trends in Genneville (2025)
Effective short term rental pricing strategy in Genneville involves understanding monthly ADR fluctuations. The Average Daily Rate (ADR) for Airbnb in Genneville typically peaks in December and dips lowest during May. Leveraging Airbnb dynamic pricing tools or strategies based on this seasonality can significantly boost revenue. Here's a look at the typical nightly rates achieved:
- Best-in-class properties (Top 10%) command rates of $353+ per night, often due to premium features or locations.
- Strong performing properties (Top 25%) achieve nightly rates of $241 or more.
- Typical properties (Median) charge around $170 per night.
- Entry-level properties (Bottom 25%) earn around $113 per night.
Average Daily Rate (ADR) Trend by Month in Genneville
Get Live Genneville Market Intelligence 👇

Explore Real-time Analytics
Airbnb Seasonality Analysis & Trends in Genneville (2025)
Peak Season (August, July, May)
- Revenue averages $3,939 per month
- Occupancy rates average 57.3%
- Daily rates average $191
Shoulder Season
- Revenue averages $2,513 per month
- Occupancy maintains around 38.9%
- Daily rates hold near $194
Low Season (January, February, September)
- Revenue drops to average $1,751 per month
- Occupancy decreases to average 33.2%
- Daily rates adjust to average $194
Seasonality Insights for Genneville
- The Airbnb seasonality in Genneville shows highly seasonal trends requiring careful strategy. While the sections above show seasonal averages, it's also insightful to look at the extremes:
- During the high season, the absolute peak month showcases Genneville's highest earning potential, with monthly revenues capable of climbing to $4,588, occupancy reaching a high of 67.7%, and ADRs peaking at $209.
- Conversely, the slowest single month of the year, typically falling within the low season, marks the market's lowest point. In this month, revenue might dip to $1,380, occupancy could drop to 22.4%, and ADRs may adjust down to $182.
- Understanding both the seasonal averages and these monthly peaks and troughs in revenue, occupancy, and ADR is crucial for maximizing your Airbnb profit potential in Genneville.
Seasonal Strategies for Maximizing Profit
- Peak Season: Maximize revenue through premium pricing and potentially longer minimum stays. Ensure high availability.
- Low Season: Offer competitive pricing, special promotions (e.g., extended stay discounts), and flexible cancellation policies. Target off-season travelers like remote workers or budget-conscious guests.
- Shoulder Seasons: Implement dynamic pricing that balances peak and low rates. Target weekend travelers or specific events. Offer slightly more flexible terms than peak season.
- Regularly analyze your own performance against these Genneville seasonality benchmarks and adjust your pricing and availability strategy accordingly.
Best Areas for Airbnb Investment in Genneville (2025)
Exploring the top neighborhoods for short-term rentals in Genneville? This section highlights key areas, outlining why they are attractive for hosts and guests, along with notable local attractions. Consider these locations based on your target guest profile and investment strategy.
| Neighborhood / Area | Why Host Here? (Target Guests & Appeal) | Key Attractions & Landmarks |
|---|---|---|
| Étretat | Famous for its stunning chalk cliffs and natural arches, Étretat attracts many tourists looking for breathtaking views and coastal walks. Ideal for visitors interested in photography, hiking, and beach activities. | Étretat Cliffs, Etretat Beach, Aiguille Etretat, Chapelle Notre-Dame de la Garde, Le Clos Arsène Lupin |
| Deauville | Known as the 'Queen of the Normandy Beaches', Deauville is a glamorous seaside resort with a beautiful beach, luxury hotels, and a vibrant atmosphere, making it popular among upscale travelers. | Deauville Beach, Deauville Casino, Promenade des Planches, Deauville International Film Festival, Port de Deauville |
| Honfleur | A picturesque town with historic harbor and colorful wooden houses that charm many visitors. Honfleur's artistic history and beautiful landscapes appeal to tourists looking for cultural experiences. | Vieux Bassin, Sainte-Catherine Church, Honfleur Museum of Modern Art, Naturospace, Maisons Satie |
| Rouen | The historic capital of Normandy known for its medieval architecture and rich history. Rouen is ideal for visitors interested in arts, culture, and gastronomy. | Rouen Cathedral, Gros-Horloge, Church of Saint-Maclou, Musée des Beaux-Arts, Rue du Gros-Horloge |
| Caen | An important historic city that played a significant role during World War II. Caen offers a blend of history and modern amenities, attracting those interested in culture and learning. | Caen Memorial Museum, Château de Caen, Abbaye aux Hommes, Abbaye aux Dames, Pegasus Bridge |
| Lisieux | Famous for its Basilica and as a pilgrimage site, Lisieux attracts visitors interested in religious history and architecture. The town also offers a quiet charm and beautiful gardens. | Basilique Sainte-Thérèse, Les Jardins de la Paix, Musee d'Art et d'Histoire, La Ferme de Billy, La Cave de Lisieux |
| Bayeux | Renowned for the Bayeux Tapestry, this city is a hub for those interested in medieval history. Bayeux's picturesque streets and historical sites draw many tourists. | Bayeux Tapestry Museum, Cathedral of Bayeux, British Military Cemetery, Battle of Normandy Museum, Place Charles de Gaulle |
| Villerville | A charming coastal village close to Trouville and Deauville, Villerville offers a tranquil setting with beautiful sea views and is perfect for family vacations. | Villerville Beach, Chemin des Douaniers, Villerville Cliffs, Local restaurants, Picturesque streets |
Understanding Airbnb License Requirements & STR Laws in Genneville (2025)
With 17% of listings showing registration in 2025, understanding potential Airbnb license requirements is crucial in Genneville. Always verify the latest short term rental regulations and Airbnb license requirements directly with local government authorities for Genneville to ensure full compliance before hosting.
(Source: AirROI data, 2025, based on 17% licensed listings)
Top Performing Airbnb Properties in Genneville (2025)
Benchmark your potential! Explore examples of top-performing Airbnb properties in Gennevillebased on Trailing Twelve Month (TTM) revenue. Analyze their characteristics, revenue, occupancy rate, and ADR to understand what drives success in this market.
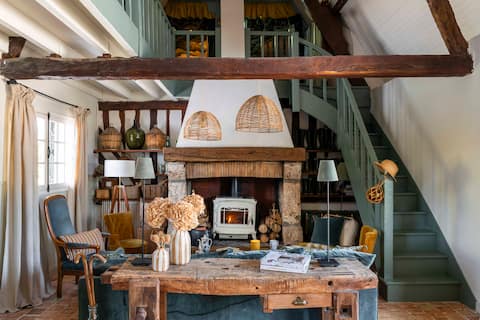
La Roquerie Cottage between Countryside and Sea
Entire Place • 3 bedrooms
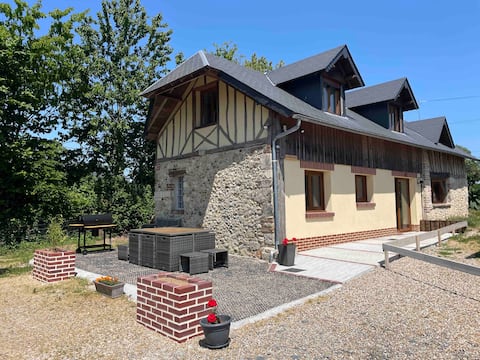
La charreterie a Genneville au Pays de Honfleur
Entire Place • 3 bedrooms

Charming restored 18th century press near Honfleur
Entire Place • 6 bedrooms
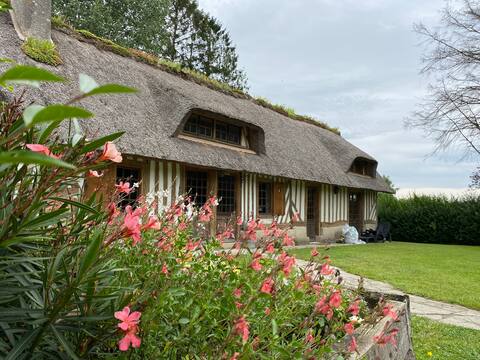
Normandy Chaumière surrounded by nature
Entire Place • 3 bedrooms

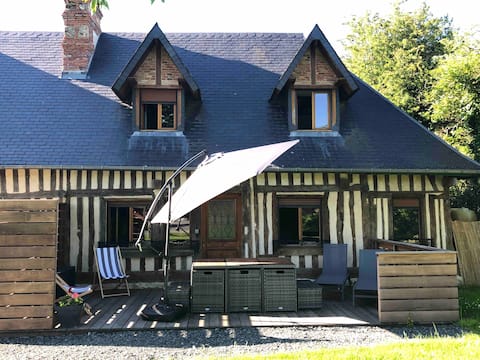
La Patte de Loup, 15 minutes from Honfleur.
Entire Place • 4 bedrooms
The stable, Honfleur Country
Entire Place • 2 bedrooms
Note: Performance varies based on location, size, amenities, seasonality, and management quality. Data reflects the past 12 months.
Top Performing Airbnb Hosts in Genneville (2025)
Learn from the best! This table showcases top-performing Airbnb hosts in Genneville based on the number of properties managed and estimated total revenue over the past year. Analyze their scale and performance metrics.
| Host Name | Properties | Grossing Revenue | Stay Reviews | Avg Rating |
|---|---|---|---|---|
| Helene | 4 | $135,015 | 138 | 4.90/5.0 |
| Léonardboulan | 3 | $108,483 | 855 | 4.78/5.0 |
| Aurelie | 1 | $97,578 | 32 | 4.94/5.0 |
| Celine | 3 | $51,135 | 306 | 4.84/5.0 |
| Pascal | 1 | $49,987 | 46 | 4.91/5.0 |
| Charlotte | 1 | $45,553 | 7 | 5.00/5.0 |
| Sylvie | 1 | $23,478 | 36 | 4.94/5.0 |
| Dominique | 1 | $22,657 | 33 | 4.36/5.0 |
| Marion | 1 | $22,641 | 121 | 4.66/5.0 |
| Stephane | 1 | $19,752 | 14 | 4.93/5.0 |
Analyzing the strategies of top hosts, such as their property selection, pricing, and guest communication, can offer valuable lessons for optimizing your own Airbnb operations in Genneville.
Dive Deeper: Advanced Genneville STR Market Data (2025)
Ready to unlock more insights? AirROI provides access to advanced metrics and comprehensive Airbnb data for Genneville. Explore detailed analytics beyond this report to refine your investment strategy, optimize pricing, and maximize your vacation rental profits.
Explore Advanced MetricsGenneville Short-Term Rental Market Composition (2025): Property & Room Types
Room Type Distribution
Property Type Distribution
Market Composition Insights for Genneville
- The Genneville Airbnb market composition is heavily skewed towards Entire Home/Apt listings, which make up 100% of the 23 active rentals. This indicates strong guest preference for privacy and space.
- Looking at the property type distribution in Genneville, House properties are the most common (73.9%), reflecting the local real estate landscape.
- Houses represent a significant 73.9% portion, catering likely to families or larger groups.
- Smaller segments like hotel/boutique, unique stays, outdoor/unique (combined 12.9%) offer potential for unique stay experiences.
Genneville Airbnb Room Capacity Analysis (2025): Bedroom Distribution
Distribution of Listings by Number of Bedrooms
Room Capacity Insights for Genneville
- The dominant room capacity in Genneville is 3 bedrooms listings, making up 21.7% of the market. This suggests a strong demand for properties suitable for families or small groups.
- Together, 3 bedrooms and 4 bedrooms properties represent 43.4% of the active Airbnb listings in Genneville, indicating a high concentration in these sizes.
- A significant 60.8% of listings offer 3+ bedrooms, catering to larger groups and families seeking more space in Genneville.
Genneville Vacation Rental Guest Capacity Trends (2025)
Distribution of Listings by Guest Capacity
Guest Capacity Insights for Genneville
- The most common guest capacity trend in Genneville vacation rentals is listings accommodating 8+ guests (39.1%). This suggests the primary traveler segment is likely larger groups.
- Properties designed for 8+ guests and 6 guests dominate the Genneville STR market, accounting for 65.2% of listings.
- 73.9% of properties accommodate 6+ guests, serving the market segment for larger families or group travel in Genneville.
- On average, properties in Genneville are equipped to host 6.1 guests.
Genneville Airbnb Booking Patterns (2025): Available vs. Booked Days
Available Days Distribution
Booked Days Distribution
Booking Pattern Insights for Genneville
- The most common availability pattern in Genneville falls within the 271-366 days range, representing 39.1% of listings. This suggests many properties have significant open periods on their calendars.
- Approximately 69.5% of listings show high availability (181+ days open annually), indicating potential for increased bookings or specific owner usage patterns.
- For booked days, the 91-180 days range is most frequent in Genneville (34.8%), reflecting common guest stay durations or potential owner blocking patterns.
- A notable 30.4% of properties secure long booking periods (181+ days booked per year), highlighting successful long-term rental strategies or significant owner usage.
Genneville Airbnb Minimum Stay Requirements Analysis
Distribution of Listings by Minimum Night Requirement
1 Night
6 listings
26.1% of total
2 Nights
7 listings
30.4% of total
3 Nights
4 listings
17.4% of total
4-6 Nights
1 listings
4.3% of total
30+ Nights
5 listings
21.7% of total
Key Insights
- The most prevalent minimum stay requirement in Genneville is 2 Nights, adopted by 30.4% of listings. This highlights the market's preference for shorter, flexible bookings.
- A significant segment (21.7%) caters to monthly stays (30+ nights) in Genneville, pointing to opportunities in the extended-stay market.
Recommendations
- Align with the market by considering a 2 Nights minimum stay, as 30.4% of Genneville hosts use this setting.
- If feasible, allowing 1-night stays, especially midweek or during low season, could capture last-minute bookings, as only 26.1% currently do.
- Explore offering discounts for stays of 30+ nights to attract the 21.7% of the market seeking extended stays.
- Adjust minimum nights based on seasonality – potentially shorter during low season and longer during peak demand periods in Genneville.
Genneville Airbnb Cancellation Policy Trends Analysis (2025)
Flexible
2 listings
9.1% of total
Moderate
7 listings
31.8% of total
Firm
9 listings
40.9% of total
Strict
4 listings
18.2% of total
Cancellation Policy Insights for Genneville
- The prevailing Airbnb cancellation policy trend in Genneville is Firm, used by 40.9% of listings.
- A majority (59.1%) of hosts in Genneville utilize Firm or Strict policies, indicating a market where hosts prioritize booking security.
Recommendations for Hosts
- Consider adopting a Firm policy to align with the 40.9% market standard in Genneville.
- Regularly review your cancellation policy against competitors and market demand shifts in Genneville.
Genneville STR Booking Lead Time Analysis (2025)
Average Booking Lead Time by Month
Booking Lead Time Insights for Genneville
- The overall average booking lead time for vacation rentals in Genneville is 54 days.
- Guests book furthest in advance for stays during June (average 93 days), likely coinciding with peak travel demand or local events.
- The shortest booking windows occur for stays in December (average 40 days), indicating more last-minute travel plans during this time.
- Seasonally, Summer (85 days avg.) sees the longest lead times, while Winter (41 days avg.) has the shortest, reflecting typical travel planning cycles.
Recommendations for Hosts
- Use the overall average lead time (54 days) as a baseline for your pricing and availability strategy in Genneville.
- For June stays, consider implementing length-of-stay discounts or slightly higher rates for bookings made less than 93 days out to capitalize on advance planning.
- Target marketing efforts for the Summer season well in advance (at least 85 days) to capture early planners.
- Monitor your own booking lead times against these Genneville averages to identify opportunities for dynamic pricing adjustments.
Popular & Essential Airbnb Amenities in Genneville (2025)
Amenity Prevalence
Amenity Insights for Genneville
- Essential amenities in Genneville that guests expect include: Hot water, Kitchen, Free parking on premises, TV, Coffee maker, Refrigerator. Lacking these (any) could significantly impact bookings.
- Popular amenities like Dishes and silverware, Microwave, Heating are common but not universal. Offering these can provide a competitive edge.
Recommendations for Hosts
- Ensure your listing includes all essential amenities for Genneville: Hot water, Kitchen, Free parking on premises, TV, Coffee maker, Refrigerator.
- Prioritize adding missing essentials: TV, Coffee maker, Refrigerator.
- Consider adding popular differentiators like Dishes and silverware or Microwave to increase appeal.
- Highlight unique or less common amenities you offer (e.g., hot tub, dedicated workspace, EV charger) in your listing description and photos.
- Regularly check competitor amenities in Genneville to stay competitive.
Genneville Airbnb Guest Demographics & Profile Analysis (2025)
Guest Profile Summary for Genneville
- The typical guest profile for Airbnb in Genneville consists of primarily domestic travelers (80%), often arriving from nearby Paris, typically belonging to the Post-2000s (Gen Z/Alpha) group (50%), primarily speaking French or English.
- Domestic travelers account for 80.0% of guests.
- Key international markets include France (80%) and United Kingdom (5.3%).
- Top languages spoken are French (48.7%) followed by English (29.7%).
- A significant demographic segment is the Post-2000s (Gen Z/Alpha) group, representing 50% of guests.
Recommendations for Hosts
- Target domestic marketing efforts towards travelers from Paris and Rouen.
- Tailor amenities and listing descriptions to appeal to the dominant Post-2000s (Gen Z/Alpha) demographic (e.g., highlight fast WiFi, smart home features, local guides).
- Highlight unique local experiences or amenities relevant to the primary guest profile.
- Consider seasonal promotions aligned with peak travel times for key origin markets.
Nearby Short-Term Rental Market Comparison
How does the Genneville Airbnb market stack up against its neighbors? Compare key performance metrics like average monthly revenue, ADR, and occupancy rates in surrounding areas to understand the broader regional STR landscape.
| Market | Active Properties | Monthly Revenue | Daily Rate | Avg. Occupancy |
|---|---|---|---|---|
| La Poterie-Cap-d'Antifer | 11 | $5,076 | $293.95 | 55% |
| Bonneville-sur-Touques | 16 | $3,903 | $367.00 | 40% |
| Luneray | 12 | $3,745 | $526.24 | 42% |
| La Couture-Boussey | 12 | $3,620 | $378.08 | 28% |
| Roedean | 47 | $3,494 | $257.09 | 47% |
| Saint-Étienne-la-Thillaye | 24 | $3,459 | $325.89 | 42% |
| Cricquebœuf | 10 | $3,417 | $268.29 | 46% |
| Caumont | 11 | $3,350 | $286.17 | 49% |
| Moulins-le-Carbonnel | 11 | $3,213 | $320.85 | 35% |
| Gonneville-en-Auge | 12 | $3,061 | $235.90 | 40% |