Fécamp Airbnb Market Analysis 2025: Short Term Rental Data & Vacation Rental Statistics in Normandy, France
Is Airbnb profitable in Fécamp in 2025? Explore comprehensive Airbnb analytics for Fécamp, Normandy, France to uncover income potential. This 2025 STR market report for Fécamp, based on AirROI data from April 2024 to March 2025, reveals key trends in the market of 415 active listings.
Whether you're considering an Airbnb investment in Fécamp, optimizing your existing vacation rental, or exploring rental arbitrage opportunities, understanding the Fécamp Airbnb data is crucial. Understanding the local regulations is key to maximizing your short term rental income potential. Let's dive into the specifics.
Key Fécamp Airbnb Performance Metrics Overview
Monthly Airbnb Revenue Variations & Income Potential in Fécamp (2025)
Understanding the monthly revenue variations for Airbnb listings in Fécamp is key to maximizing your short term rental income potential. Seasonality significantly impacts earnings. Our analysis, based on data from the past 12 months, shows that the peak revenue month for STRs in Fécamp is typically August, while March often presents the lowest earnings, highlighting opportunities for strategic pricing adjustments during shoulder and low seasons. Explore the typical Airbnb income in Fécamp across different performance tiers:
- Best-in-class properties (Top 10%) achieve $2,825+ monthly, often utilizing dynamic pricing and superior guest experiences.
- Strong performing properties (Top 25%) earn $1,991 or more, indicating effective management and desirable locations/amenities.
- Typical properties (Median) generate around $1,299 per month, representing the average market performance.
- Entry-level properties (Bottom 25%) see earnings around $776, often with potential for optimization.
Average Monthly Airbnb Earnings Trend in Fécamp
Fécamp Airbnb Occupancy Rate Trends (2025)
Maximize your bookings by understanding the Fécamp STR occupancy trends. Seasonal demand shifts significantly influence how often properties are booked. Typically, Augustsees the highest demand (peak season occupancy), while January experiences the lowest (low season). Effective strategies, like adjusting minimum stays or offering promotions, can boost occupancy during slower periods. Here's how different property tiers perform in Fécamp:
- Best-in-class properties (Top 10%) achieve 77%+ occupancy, indicating high desirability and potentially optimized availability.
- Strong performing properties (Top 25%) maintain 62% or higher occupancy, suggesting good market fit and guest satisfaction.
- Typical properties (Median) have an occupancy rate around 43%.
- Entry-level properties (Bottom 25%) average 26% occupancy, potentially facing higher vacancy.
Average Monthly Occupancy Rate Trend in Fécamp
Average Daily Rate (ADR) Airbnb Trends in Fécamp (2025)
Effective short term rental pricing strategy in Fécamp involves understanding monthly ADR fluctuations. The Average Daily Rate (ADR) for Airbnb in Fécamp typically peaks in July and dips lowest during March. Leveraging Airbnb dynamic pricing tools or strategies based on this seasonality can significantly boost revenue. Here's a look at the typical nightly rates achieved:
- Best-in-class properties (Top 10%) command rates of $155+ per night, often due to premium features or locations.
- Strong performing properties (Top 25%) achieve nightly rates of $117 or more.
- Typical properties (Median) charge around $89 per night.
- Entry-level properties (Bottom 25%) earn around $69 per night.
Average Daily Rate (ADR) Trend by Month in Fécamp
Get Live Fécamp Market Intelligence 👇

Explore Real-time Analytics
Airbnb Seasonality Analysis & Trends in Fécamp (2025)
Peak Season (August, July, May)
- Revenue averages $2,375 per month
- Occupancy rates average 64.2%
- Daily rates average $109
Shoulder Season
- Revenue averages $1,495 per month
- Occupancy maintains around 42.6%
- Daily rates hold near $103
Low Season (January, February, March)
- Revenue drops to average $846 per month
- Occupancy decreases to average 30.2%
- Daily rates adjust to average $96
Seasonality Insights for Fécamp
- The Airbnb seasonality in Fécamp shows highly seasonal trends requiring careful strategy. While the sections above show seasonal averages, it's also insightful to look at the extremes:
- During the high season, the absolute peak month showcases Fécamp's highest earning potential, with monthly revenues capable of climbing to $2,683, occupancy reaching a high of 74.6%, and ADRs peaking at $111.
- Conversely, the slowest single month of the year, typically falling within the low season, marks the market's lowest point. In this month, revenue might dip to $788, occupancy could drop to 26.0%, and ADRs may adjust down to $95.
- Understanding both the seasonal averages and these monthly peaks and troughs in revenue, occupancy, and ADR is crucial for maximizing your Airbnb profit potential in Fécamp.
Seasonal Strategies for Maximizing Profit
- Peak Season: Maximize revenue through premium pricing and potentially longer minimum stays. Ensure high availability.
- Low Season: Offer competitive pricing, special promotions (e.g., extended stay discounts), and flexible cancellation policies. Target off-season travelers like remote workers or budget-conscious guests.
- Shoulder Seasons: Implement dynamic pricing that balances peak and low rates. Target weekend travelers or specific events. Offer slightly more flexible terms than peak season.
- Regularly analyze your own performance against these Fécamp seasonality benchmarks and adjust your pricing and availability strategy accordingly.
Best Areas for Airbnb Investment in Fécamp (2025)
Exploring the top neighborhoods for short-term rentals in Fécamp? This section highlights key areas, outlining why they are attractive for hosts and guests, along with notable local attractions. Consider these locations based on your target guest profile and investment strategy.
| Neighborhood / Area | Why Host Here? (Target Guests & Appeal) | Key Attractions & Landmarks |
|---|---|---|
| Port de Fécamp | A picturesque harbor area with a vibrant atmosphere, perfect for tourists who enjoy seafood cuisine and maritime scenery. It's a significant draw for visitors seeking picturesque views and a relaxing seaside experience. | Fécamp Beach, Le Palais des Congrès, Fishing Port, Gastronomy Tours, Les Falaises des Vaches Noires |
| Cliffs of Etretat | Famous for its stunning limestone cliffs and natural arches, this area attracts tourists for hiking and photography. A prime location for hosting guests who enjoy nature and outdoor activities. | Etretat Cliffs, Chapelle Notre-Dame de la Garde, Etretat Golf, Seashore Walks, Local Art Galleries |
| Old Town Fécamp | Historic part of Fécamp with charming old buildings and narrow streets. Ideal for visitors interested in history and culture, with several local shops and cafes. | Abbey of the Holy Trinity, Museum of Fécamp, Local Artisan Shops, Cafés and Restaurants, Historic Architecture |
| La Vallette | A beautiful area known for its natural beaches and gardens, great for families and those looking to relax by the sea. Attracts visitors for its peaceful environment and beach amenities. | Fécamp Gardens, La Vallette Beach, Water Activities, Picnic Areas, Scenic Paths |
| Fécamp Lighthouse | A landmark that offers beautiful views over the coast and the surrounding area. A great spot for tourists interested in maritime heritage and views. | The Lighthouse, Coastal Views, Nearby Walking Trails, Photography Spots, Historical Tours |
| Les Havres de Fécamp | A serene area with luxury accommodations and beautiful surroundings, catering to tourists seeking upscale experiences and comfort. | Waterfront Homes, Spa and Wellness Centers, Fine Dining, Yachting Activities, Nature Trails |
| Fécamp Marina | A popular spot for boating enthusiasts and fishermen, providing an authentic maritime experience. Ideal for those looking to enjoy the local maritime culture. | Boat Rentals, Fishing Tours, Maritime Museum, Water Sports Activities, Fishing Markets |
| Normandy Coast | A larger area that encompasses beautiful beaches and stunning landscapes, appealing to nature lovers and historical enthusiasts. Great for guests looking for adventure and exploration. | D-Day Beaches, Historical Sites, Scenic Drives, Cultural Heritage Tours, Outdoor Adventures |
Understanding Airbnb License Requirements & STR Laws in Fécamp (2025)
With 12% of listings showing registration in 2025, understanding potential Airbnb license requirements is crucial in Fécamp. Always verify the latest short term rental regulations and Airbnb license requirements directly with local government authorities for Fécamp to ensure full compliance before hosting.
(Source: AirROI data, 2025, based on 12% licensed listings)
Top Performing Airbnb Properties in Fécamp (2025)
Benchmark your potential! Explore examples of top-performing Airbnb properties in Fécampbased on Trailing Twelve Month (TTM) revenue. Analyze their characteristics, revenue, occupancy rate, and ADR to understand what drives success in this market.
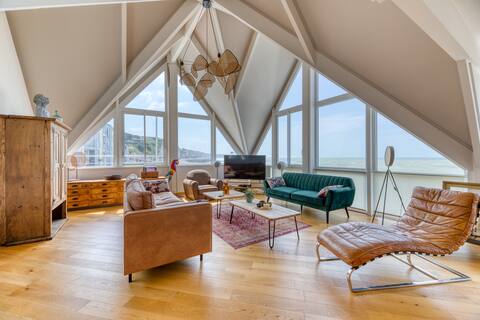
Le poseidon apartment sea view
Entire Place • 4 bedrooms

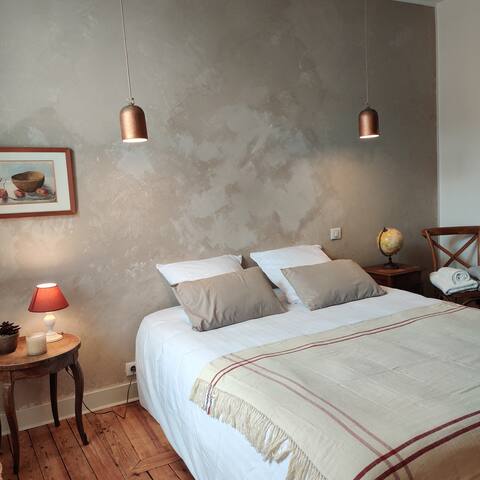
Le Panorama, fabulous open sea view.
Entire Place • 4 bedrooms
Nice fisherman's house 6/8 pers
Entire Place • 4 bedrooms
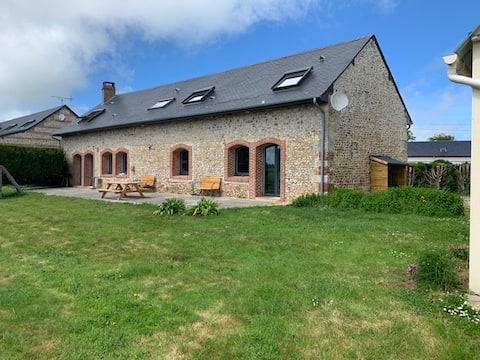
Family home 5 min to the sea
Entire Place • 5 bedrooms
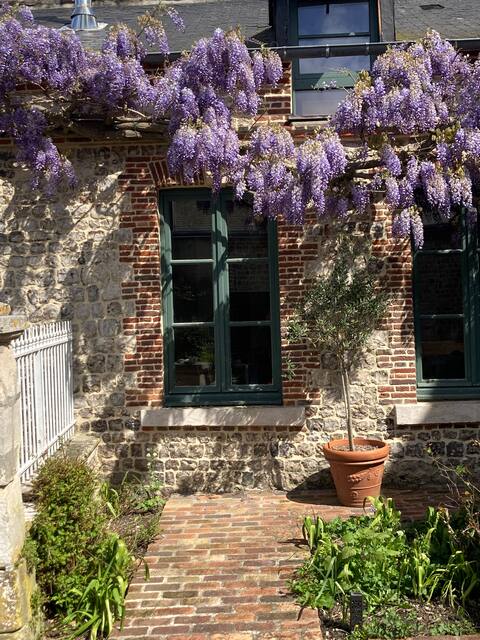
Beautiful 18th century house with garden
Entire Place • 5 bedrooms
"La Villa du Cap" - Sea view 2/8 guests
Entire Place • 4 bedrooms
Note: Performance varies based on location, size, amenities, seasonality, and management quality. Data reflects the past 12 months.
Top Performing Airbnb Hosts in Fécamp (2025)
Learn from the best! This table showcases top-performing Airbnb hosts in Fécamp based on the number of properties managed and estimated total revenue over the past year. Analyze their scale and performance metrics.
| Host Name | Properties | Grossing Revenue | Stay Reviews | Avg Rating |
|---|---|---|---|---|
| Sophie Et Samuel | 6 | $258,832 | 640 | 4.88/5.0 |
| Yohann | 6 | $183,502 | 116 | 4.73/5.0 |
| Christelle | 4 | $158,716 | 344 | 4.62/5.0 |
| Florian | 10 | $140,358 | 1179 | 4.48/5.0 |
| Miguel | 4 | $135,061 | 1313 | 4.86/5.0 |
| Giovanni | 3 | $105,410 | 9 | 3.33/5.0 |
| Conciergerie LH | 4 | $102,107 | 99 | 4.66/5.0 |
| Amandine | 4 | $86,450 | 98 | 4.86/5.0 |
| Edwige | 4 | $80,967 | 760 | 4.93/5.0 |
| Corinne | 3 | $79,099 | 92 | 4.91/5.0 |
Analyzing the strategies of top hosts, such as their property selection, pricing, and guest communication, can offer valuable lessons for optimizing your own Airbnb operations in Fécamp.
Dive Deeper: Advanced Fécamp STR Market Data (2025)
Ready to unlock more insights? AirROI provides access to advanced metrics and comprehensive Airbnb data for Fécamp. Explore detailed analytics beyond this report to refine your investment strategy, optimize pricing, and maximize your vacation rental profits.
Explore Advanced MetricsFécamp Short-Term Rental Market Composition (2025): Property & Room Types
Room Type Distribution
Property Type Distribution
Market Composition Insights for Fécamp
- The Fécamp Airbnb market composition is heavily skewed towards Entire Home/Apt listings, which make up 93.3% of the 415 active rentals. This indicates strong guest preference for privacy and space.
- Looking at the property type distribution in Fécamp, House properties are the most common (48.4%), reflecting the local real estate landscape.
- Houses represent a significant 48.4% portion, catering likely to families or larger groups.
- Smaller segments like hotel/boutique, others, outdoor/unique, unique stays (combined 3.8%) offer potential for unique stay experiences.
Fécamp Airbnb Room Capacity Analysis (2025): Bedroom Distribution
Distribution of Listings by Number of Bedrooms
Room Capacity Insights for Fécamp
- The dominant room capacity in Fécamp is 2 bedrooms listings, making up 32.5% of the market. This suggests a strong demand for properties suitable for couples or solo travelers.
- Together, 2 bedrooms and 1 bedroom properties represent 64.5% of the active Airbnb listings in Fécamp, indicating a high concentration in these sizes.
- A significant 24.5% of listings offer 3+ bedrooms, catering to larger groups and families seeking more space in Fécamp.
Fécamp Vacation Rental Guest Capacity Trends (2025)
Distribution of Listings by Guest Capacity
Guest Capacity Insights for Fécamp
- The most common guest capacity trend in Fécamp vacation rentals is listings accommodating 4 guests (34.5%). This suggests the primary traveler segment is likely small families or groups.
- Properties designed for 4 guests and 2 guests dominate the Fécamp STR market, accounting for 57.2% of listings.
- 27.5% of properties accommodate 6+ guests, serving the market segment for larger families or group travel in Fécamp.
- On average, properties in Fécamp are equipped to host 4.1 guests.
Fécamp Airbnb Booking Patterns (2025): Available vs. Booked Days
Available Days Distribution
Booked Days Distribution
Booking Pattern Insights for Fécamp
- The most common availability pattern in Fécamp falls within the 181-270 days range, representing 41.2% of listings. This suggests many properties have significant open periods on their calendars.
- Approximately 65.3% of listings show high availability (181+ days open annually), indicating potential for increased bookings or specific owner usage patterns.
- For booked days, the 91-180 days range is most frequent in Fécamp (42.4%), reflecting common guest stay durations or potential owner blocking patterns.
- A notable 36.2% of properties secure long booking periods (181+ days booked per year), highlighting successful long-term rental strategies or significant owner usage.
Fécamp Airbnb Minimum Stay Requirements Analysis
Distribution of Listings by Minimum Night Requirement
1 Night
104 listings
26.5% of total
2 Nights
190 listings
48.5% of total
3 Nights
27 listings
6.9% of total
4-6 Nights
16 listings
4.1% of total
7-29 Nights
2 listings
0.5% of total
30+ Nights
53 listings
13.5% of total
Key Insights
- The most prevalent minimum stay requirement in Fécamp is 2 Nights, adopted by 48.5% of listings. This highlights the market's preference for shorter, flexible bookings.
- A strong majority (75.0%) of the Fécamp Airbnb data shows acceptance of very short stays (1-2 nights), indicating a dynamic, high-turnover market.
- A significant segment (13.5%) caters to monthly stays (30+ nights) in Fécamp, pointing to opportunities in the extended-stay market.
Recommendations
- Align with the market by considering a 2 Nights minimum stay, as 48.5% of Fécamp hosts use this setting.
- If feasible, allowing 1-night stays, especially midweek or during low season, could capture last-minute bookings, as only 26.5% currently do.
- Explore offering discounts for stays of 30+ nights to attract the 13.5% of the market seeking extended stays.
- Adjust minimum nights based on seasonality – potentially shorter during low season and longer during peak demand periods in Fécamp.
Fécamp Airbnb Cancellation Policy Trends Analysis (2025)
Flexible
107 listings
27.4% of total
Moderate
139 listings
35.6% of total
Firm
55 listings
14.1% of total
Strict
89 listings
22.8% of total
Cancellation Policy Insights for Fécamp
- The prevailing Airbnb cancellation policy trend in Fécamp is Moderate, used by 35.6% of listings.
- There's a relatively balanced mix between guest-friendly (63.0%) and stricter (36.9%) policies, offering choices for different guest needs.
Recommendations for Hosts
- Consider adopting a Moderate policy to align with the 35.6% market standard in Fécamp.
- Regularly review your cancellation policy against competitors and market demand shifts in Fécamp.
Fécamp STR Booking Lead Time Analysis (2025)
Average Booking Lead Time by Month
Booking Lead Time Insights for Fécamp
- The overall average booking lead time for vacation rentals in Fécamp is 43 days.
- Guests book furthest in advance for stays during July (average 83 days), likely coinciding with peak travel demand or local events.
- The shortest booking windows occur for stays in February (average 22 days), indicating more last-minute travel plans during this time.
- Seasonally, Summer (72 days avg.) sees the longest lead times, while Fall (33 days avg.) has the shortest, reflecting typical travel planning cycles.
Recommendations for Hosts
- Use the overall average lead time (43 days) as a baseline for your pricing and availability strategy in Fécamp.
- For July stays, consider implementing length-of-stay discounts or slightly higher rates for bookings made less than 83 days out to capitalize on advance planning.
- Target marketing efforts for the Summer season well in advance (at least 72 days) to capture early planners.
- Monitor your own booking lead times against these Fécamp averages to identify opportunities for dynamic pricing adjustments.
Popular & Essential Airbnb Amenities in Fécamp (2025)
Amenity Prevalence
Amenity Insights for Fécamp
- Essential amenities in Fécamp that guests expect include: Heating. Lacking these (this) could significantly impact bookings.
- Popular amenities like Kitchen, Hot water, Wifi are common but not universal. Offering these can provide a competitive edge.
- Warning: Wifi is not universally provided but is considered essential globally. Ensure reliable Wifi is offered.
Recommendations for Hosts
- Ensure your listing includes all essential amenities for Fécamp: Heating.
- Prioritize adding missing essentials: Heating.
- Consider adding popular differentiators like Kitchen or Hot water to increase appeal.
- Highlight unique or less common amenities you offer (e.g., hot tub, dedicated workspace, EV charger) in your listing description and photos.
- Regularly check competitor amenities in Fécamp to stay competitive.
Fécamp Airbnb Guest Demographics & Profile Analysis (2025)
Guest Profile Summary for Fécamp
- The typical guest profile for Airbnb in Fécamp consists of primarily domestic travelers (78%), often arriving from nearby Paris, typically belonging to the Post-2000s (Gen Z/Alpha) group (50%), primarily speaking French or English.
- Domestic travelers account for 78.1% of guests.
- Key international markets include France (78.1%) and Germany (6.4%).
- Top languages spoken are French (40.9%) followed by English (32.8%).
- A significant demographic segment is the Post-2000s (Gen Z/Alpha) group, representing 50% of guests.
Recommendations for Hosts
- Target domestic marketing efforts towards travelers from Paris and Lille.
- Tailor amenities and listing descriptions to appeal to the dominant Post-2000s (Gen Z/Alpha) demographic (e.g., highlight fast WiFi, smart home features, local guides).
- Highlight unique local experiences or amenities relevant to the primary guest profile.
- Consider seasonal promotions aligned with peak travel times for key origin markets.
Nearby Short-Term Rental Market Comparison
How does the Fécamp Airbnb market stack up against its neighbors? Compare key performance metrics like average monthly revenue, ADR, and occupancy rates in surrounding areas to understand the broader regional STR landscape.
| Market | Active Properties | Monthly Revenue | Daily Rate | Avg. Occupancy |
|---|---|---|---|---|
| La Poterie-Cap-d'Antifer | 11 | $5,076 | $293.95 | 55% |
| Bonneville-sur-Touques | 16 | $3,903 | $367.00 | 40% |
| Luneray | 12 | $3,745 | $526.24 | 42% |
| La Couture-Boussey | 12 | $3,620 | $378.08 | 28% |
| Roedean | 47 | $3,494 | $257.09 | 47% |
| Saint-Étienne-la-Thillaye | 24 | $3,459 | $325.89 | 42% |
| Cricquebœuf | 10 | $3,417 | $268.29 | 46% |
| Caumont | 11 | $3,350 | $286.17 | 49% |
| Moulins-le-Carbonnel | 11 | $3,213 | $320.85 | 35% |
| Gonneville-en-Auge | 12 | $3,061 | $235.90 | 40% |