Fourneville Airbnb Market Analysis 2025: Short Term Rental Data & Vacation Rental Statistics in Normandy, France
Is Airbnb profitable in Fourneville in 2025? Explore comprehensive Airbnb analytics for Fourneville, Normandy, France to uncover income potential. This 2025 STR market report for Fourneville, based on AirROI data from April 2024 to March 2025, reveals key trends in the niche market of 25 active listings.
Whether you're considering an Airbnb investment in Fourneville, optimizing your existing vacation rental, or exploring rental arbitrage opportunities, understanding the Fourneville Airbnb data is crucial. Understanding the local regulations is key to maximizing your short term rental income potential. Let's dive into the specifics.
Key Fourneville Airbnb Performance Metrics Overview
Monthly Airbnb Revenue Variations & Income Potential in Fourneville (2025)
Understanding the monthly revenue variations for Airbnb listings in Fourneville is key to maximizing your short term rental income potential. Seasonality significantly impacts earnings. Our analysis, based on data from the past 12 months, shows that the peak revenue month for STRs in Fourneville is typically August, while February often presents the lowest earnings, highlighting opportunities for strategic pricing adjustments during shoulder and low seasons. Explore the typical Airbnb income in Fourneville across different performance tiers:
- Best-in-class properties (Top 10%) achieve $4,745+ monthly, often utilizing dynamic pricing and superior guest experiences.
- Strong performing properties (Top 25%) earn $3,097 or more, indicating effective management and desirable locations/amenities.
- Typical properties (Median) generate around $1,781 per month, representing the average market performance.
- Entry-level properties (Bottom 25%) see earnings around $888, often with potential for optimization.
Average Monthly Airbnb Earnings Trend in Fourneville
Fourneville Airbnb Occupancy Rate Trends (2025)
Maximize your bookings by understanding the Fourneville STR occupancy trends. Seasonal demand shifts significantly influence how often properties are booked. Typically, Augustsees the highest demand (peak season occupancy), while January experiences the lowest (low season). Effective strategies, like adjusting minimum stays or offering promotions, can boost occupancy during slower periods. Here's how different property tiers perform in Fourneville:
- Best-in-class properties (Top 10%) achieve 71%+ occupancy, indicating high desirability and potentially optimized availability.
- Strong performing properties (Top 25%) maintain 55% or higher occupancy, suggesting good market fit and guest satisfaction.
- Typical properties (Median) have an occupancy rate around 38%.
- Entry-level properties (Bottom 25%) average 19% occupancy, potentially facing higher vacancy.
Average Monthly Occupancy Rate Trend in Fourneville
Average Daily Rate (ADR) Airbnb Trends in Fourneville (2025)
Effective short term rental pricing strategy in Fourneville involves understanding monthly ADR fluctuations. The Average Daily Rate (ADR) for Airbnb in Fourneville typically peaks in December and dips lowest during April. Leveraging Airbnb dynamic pricing tools or strategies based on this seasonality can significantly boost revenue. Here's a look at the typical nightly rates achieved:
- Best-in-class properties (Top 10%) command rates of $326+ per night, often due to premium features or locations.
- Strong performing properties (Top 25%) achieve nightly rates of $183 or more.
- Typical properties (Median) charge around $114 per night.
- Entry-level properties (Bottom 25%) earn around $88 per night.
Average Daily Rate (ADR) Trend by Month in Fourneville
Get Live Fourneville Market Intelligence 👇

Explore Real-time Analytics
Airbnb Seasonality Analysis & Trends in Fourneville (2025)
Peak Season (August, July, May)
- Revenue averages $3,542 per month
- Occupancy rates average 59.9%
- Daily rates average $157
Shoulder Season
- Revenue averages $2,235 per month
- Occupancy maintains around 38.1%
- Daily rates hold near $155
Low Season (January, February, March)
- Revenue drops to average $1,024 per month
- Occupancy decreases to average 23.0%
- Daily rates adjust to average $155
Seasonality Insights for Fourneville
- The Airbnb seasonality in Fourneville shows highly seasonal trends requiring careful strategy. While the sections above show seasonal averages, it's also insightful to look at the extremes:
- During the high season, the absolute peak month showcases Fourneville's highest earning potential, with monthly revenues capable of climbing to $4,133, occupancy reaching a high of 75.3%, and ADRs peaking at $165.
- Conversely, the slowest single month of the year, typically falling within the low season, marks the market's lowest point. In this month, revenue might dip to $987, occupancy could drop to 19.4%, and ADRs may adjust down to $146.
- Understanding both the seasonal averages and these monthly peaks and troughs in revenue, occupancy, and ADR is crucial for maximizing your Airbnb profit potential in Fourneville.
Seasonal Strategies for Maximizing Profit
- Peak Season: Maximize revenue through premium pricing and potentially longer minimum stays. Ensure high availability.
- Low Season: Offer competitive pricing, special promotions (e.g., extended stay discounts), and flexible cancellation policies. Target off-season travelers like remote workers or budget-conscious guests.
- Shoulder Seasons: Implement dynamic pricing that balances peak and low rates. Target weekend travelers or specific events. Offer slightly more flexible terms than peak season.
- Regularly analyze your own performance against these Fourneville seasonality benchmarks and adjust your pricing and availability strategy accordingly.
Best Areas for Airbnb Investment in Fourneville (2025)
Exploring the top neighborhoods for short-term rentals in Fourneville? This section highlights key areas, outlining why they are attractive for hosts and guests, along with notable local attractions. Consider these locations based on your target guest profile and investment strategy.
| Neighborhood / Area | Why Host Here? (Target Guests & Appeal) | Key Attractions & Landmarks |
|---|---|---|
| Honfleur | A charming historic town with picturesque streets, known for its art scene and beautiful port. It's a popular destination for tourists, making it a great area for Airbnb hosting. | Vieux Bassin, Saint Catherine's Church, Honfleur Modern Art Museum, Naturospace, Pont de Normandie |
| Deauville | Famous for its beach, casino, and film festival, Deauville attracts many high-profile visitors and is a favorite among Parisians. It's attractive for those looking to invest in luxury vacation rentals. | Deauville Beach, Les Planches, Casino Barrière, Deauville American Film Festival, Golf Barrière |
| Trouville-sur-Mer | Known for its vibrant markets and seafood restaurants, Trouville offers a more laid-back beach experience. It’s ideal for families and couples looking for a seaside getaway. | Trouville Beach, Fish Market, Casino de Trouville, Deauville Marina, The Villa Montebello |
| Étretat | Famous for its stunning white cliffs and natural arches, Étretat is a scenic location ideal for nature lovers and outdoor activities. Its breathtaking views draw in tourists year-round. | Étretat Cliffs, Étretat Beach, The Gardens of Étretat, The Valley of the Flowers, The Chapel of Notre-Dame de la Gardette |
| Le Havre | A UNESCO World Heritage site recognized for its modernist architecture, Le Havre offers a unique urban experience with a rich cultural life, making it appealing for urban tourists. | The Floating Gardens, The Museum of Modern Art, The Church of Saint Joseph, Le Havre Beach, St. Vincent Church |
| Lillebonne | A lesser-known location with a rich Roman history, Lillebonne attracts history enthusiasts and those interested in exploring ancient ruins and local culture. | Roman Theater, Museum of Lillebonne, Saint-Denis Church, Archaeological site, The Ancient Roman amphitheater |
| Yport | A small coastal village with stunning natural landscapes, Yport offers a quiet retreat away from bustling tourist areas. Perfect for those seeking to provide a peaceful holiday experience. | Yport Beach, Cliffs of Yport, The Grotto of Yport, Hiking Trails, Local seafood restaurants |
| Fécamp | Known for its historical abbey and maritime heritage, Fécamp attracts visitors interested in history, culture, and beautiful coastal scenery, making it a prime location for rentals. | Fécamp Abbey, The Benedictine Palace, The coastline walks, Local museums, Fishing port |
Understanding Airbnb License Requirements & STR Laws in Fourneville (2025)
With 24% of listings showing registration in 2025, understanding potential Airbnb license requirements is crucial in Fourneville. Always verify the latest short term rental regulations and Airbnb license requirements directly with local government authorities for Fourneville to ensure full compliance before hosting.
(Source: AirROI data, 2025, based on 24% licensed listings)
Top Performing Airbnb Properties in Fourneville (2025)
Benchmark your potential! Explore examples of top-performing Airbnb properties in Fournevillebased on Trailing Twelve Month (TTM) revenue. Analyze their characteristics, revenue, occupancy rate, and ADR to understand what drives success in this market.
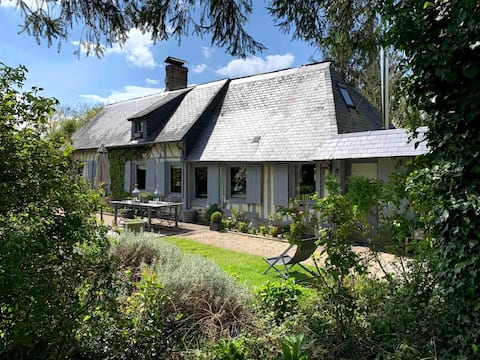
Normandy Cottage 5 MIN FROM HONFLEUR
Entire Place • 5 bedrooms
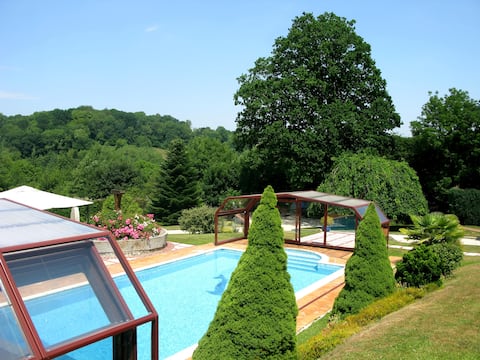
House and apartment with pool in Honfleur
Entire Place • 4 bedrooms
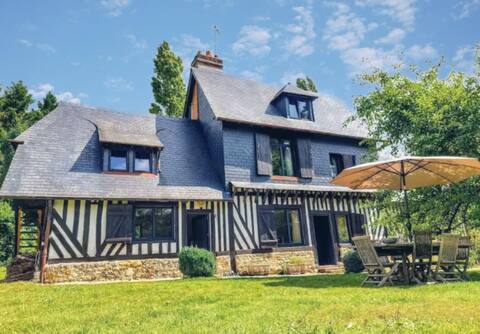
Normandy cottage between Honfleur-Deauville: L'Orange
Entire Place • 4 bedrooms
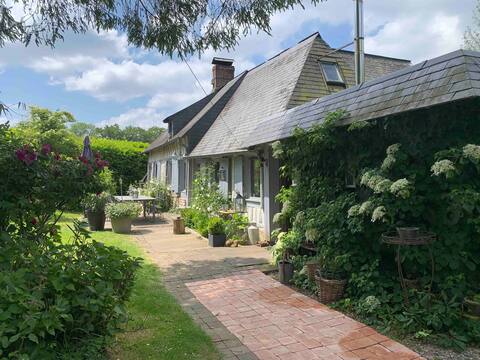
NORMANDY HOUSE 5 MIN FROM HONFLEUR
Entire Place • 3 bedrooms
La Petite Campagne - Idylliq Collection
Entire Place • 4 bedrooms

Large house 12 pers, 5 km Honfleur and beaches
Entire Place • 4 bedrooms
Note: Performance varies based on location, size, amenities, seasonality, and management quality. Data reflects the past 12 months.
Top Performing Airbnb Hosts in Fourneville (2025)
Learn from the best! This table showcases top-performing Airbnb hosts in Fourneville based on the number of properties managed and estimated total revenue over the past year. Analyze their scale and performance metrics.
| Host Name | Properties | Grossing Revenue | Stay Reviews | Avg Rating |
|---|---|---|---|---|
| Veronique | 3 | $129,511 | 472 | 4.79/5.0 |
| Cedric | 2 | $82,286 | 41 | 4.71/5.0 |
| Florence | 1 | $51,038 | 8 | 4.88/5.0 |
| Collection Idylliq | 1 | $36,237 | 21 | 4.81/5.0 |
| Béatrice | 1 | $35,843 | 209 | 4.80/5.0 |
| Fabrice | 1 | $32,838 | 49 | 4.78/5.0 |
| Arne Et Agnès | 1 | $30,854 | 77 | 4.99/5.0 |
| Vincent | 1 | $29,791 | 50 | 4.88/5.0 |
| Brigitte | 1 | $28,238 | 58 | 4.90/5.0 |
| Anne | 1 | $24,355 | 33 | 4.91/5.0 |
Analyzing the strategies of top hosts, such as their property selection, pricing, and guest communication, can offer valuable lessons for optimizing your own Airbnb operations in Fourneville.
Dive Deeper: Advanced Fourneville STR Market Data (2025)
Ready to unlock more insights? AirROI provides access to advanced metrics and comprehensive Airbnb data for Fourneville. Explore detailed analytics beyond this report to refine your investment strategy, optimize pricing, and maximize your vacation rental profits.
Explore Advanced MetricsFourneville Short-Term Rental Market Composition (2025): Property & Room Types
Room Type Distribution
Property Type Distribution
Market Composition Insights for Fourneville
- The Fourneville Airbnb market composition is heavily skewed towards Entire Home/Apt listings, which make up 96% of the 25 active rentals. This indicates strong guest preference for privacy and space.
- Looking at the property type distribution in Fourneville, House properties are the most common (84%), reflecting the local real estate landscape.
- Houses represent a significant 84% portion, catering likely to families or larger groups.
- The presence of 8% Hotel/Boutique listings indicates integration with traditional hospitality.
Fourneville Airbnb Room Capacity Analysis (2025): Bedroom Distribution
Distribution of Listings by Number of Bedrooms
Room Capacity Insights for Fourneville
- The dominant room capacity in Fourneville is 2 bedrooms listings, making up 40% of the market. This suggests a strong demand for properties suitable for couples or solo travelers.
- Together, 2 bedrooms and 1 bedroom properties represent 64.0% of the active Airbnb listings in Fourneville, indicating a high concentration in these sizes.
- A significant 32.0% of listings offer 3+ bedrooms, catering to larger groups and families seeking more space in Fourneville.
Fourneville Vacation Rental Guest Capacity Trends (2025)
Distribution of Listings by Guest Capacity
Guest Capacity Insights for Fourneville
- The most common guest capacity trend in Fourneville vacation rentals is listings accommodating 4 guests (36%). This suggests the primary traveler segment is likely small families or groups.
- Properties designed for 4 guests and 8+ guests dominate the Fourneville STR market, accounting for 60.0% of listings.
- 36.0% of properties accommodate 6+ guests, serving the market segment for larger families or group travel in Fourneville.
- On average, properties in Fourneville are equipped to host 5.0 guests.
Fourneville Airbnb Booking Patterns (2025): Available vs. Booked Days
Available Days Distribution
Booked Days Distribution
Booking Pattern Insights for Fourneville
- The most common availability pattern in Fourneville falls within the 271-366 days range, representing 36% of listings. This suggests many properties have significant open periods on their calendars.
- Approximately 68.0% of listings show high availability (181+ days open annually), indicating potential for increased bookings or specific owner usage patterns.
- For booked days, the 91-180 days range is most frequent in Fourneville (36%), reflecting common guest stay durations or potential owner blocking patterns.
- A notable 32.0% of properties secure long booking periods (181+ days booked per year), highlighting successful long-term rental strategies or significant owner usage.
Fourneville Airbnb Minimum Stay Requirements Analysis
Distribution of Listings by Minimum Night Requirement
1 Night
3 listings
12% of total
2 Nights
15 listings
60% of total
3 Nights
2 listings
8% of total
4-6 Nights
3 listings
12% of total
30+ Nights
2 listings
8% of total
Key Insights
- The most prevalent minimum stay requirement in Fourneville is 2 Nights, adopted by 60% of listings. This highlights the market's preference for shorter, flexible bookings.
- A strong majority (72.0%) of the Fourneville Airbnb data shows acceptance of very short stays (1-2 nights), indicating a dynamic, high-turnover market.
Recommendations
- Align with the market by considering a 2 Nights minimum stay, as 60% of Fourneville hosts use this setting.
- If feasible, allowing 1-night stays, especially midweek or during low season, could capture last-minute bookings, as only 12% currently do.
- A 2-night minimum appears standard (60%). Consider this for weekends or peak periods.
- Explore offering discounts for stays of 30+ nights to attract the 8% of the market seeking extended stays.
- Adjust minimum nights based on seasonality – potentially shorter during low season and longer during peak demand periods in Fourneville.
Fourneville Airbnb Cancellation Policy Trends Analysis (2025)
Flexible
2 listings
8% of total
Moderate
8 listings
32% of total
Firm
7 listings
28% of total
Strict
8 listings
32% of total
Cancellation Policy Insights for Fourneville
- The prevailing Airbnb cancellation policy trend in Fourneville is Moderate, used by 32% of listings.
- A majority (60.0%) of hosts in Fourneville utilize Firm or Strict policies, indicating a market where hosts prioritize booking security.
Recommendations for Hosts
- Consider adopting a Moderate policy to align with the 32% market standard in Fourneville.
- With 32% using Strict terms, this is a viable option in Fourneville, particularly for high-value properties or during peak demand periods.
- Regularly review your cancellation policy against competitors and market demand shifts in Fourneville.
Fourneville STR Booking Lead Time Analysis (2025)
Average Booking Lead Time by Month
Booking Lead Time Insights for Fourneville
- The overall average booking lead time for vacation rentals in Fourneville is 48 days.
- Guests book furthest in advance for stays during July (average 73 days), likely coinciding with peak travel demand or local events.
- The shortest booking windows occur for stays in March (average 28 days), indicating more last-minute travel plans during this time.
- Seasonally, Summer (68 days avg.) sees the longest lead times, while Spring (48 days avg.) has the shortest, reflecting typical travel planning cycles.
Recommendations for Hosts
- Use the overall average lead time (48 days) as a baseline for your pricing and availability strategy in Fourneville.
- For July stays, consider implementing length-of-stay discounts or slightly higher rates for bookings made less than 73 days out to capitalize on advance planning.
- Target marketing efforts for the Summer season well in advance (at least 68 days) to capture early planners.
- Monitor your own booking lead times against these Fourneville averages to identify opportunities for dynamic pricing adjustments.
Popular & Essential Airbnb Amenities in Fourneville (2025)
Amenity Prevalence
Amenity Insights for Fourneville
- Essential amenities in Fourneville that guests expect include: Heating, Free parking on premises, Kitchen, Refrigerator, TV, Dishes and silverware. Lacking these (any) could significantly impact bookings.
- Popular amenities like Coffee maker, Cooking basics, Hair dryer are common but not universal. Offering these can provide a competitive edge.
Recommendations for Hosts
- Ensure your listing includes all essential amenities for Fourneville: Heating, Free parking on premises, Kitchen, Refrigerator, TV, Dishes and silverware.
- Prioritize adding missing essentials: Refrigerator, TV, Dishes and silverware.
- Consider adding popular differentiators like Coffee maker or Cooking basics to increase appeal.
- Highlight unique or less common amenities you offer (e.g., hot tub, dedicated workspace, EV charger) in your listing description and photos.
- Regularly check competitor amenities in Fourneville to stay competitive.
Fourneville Airbnb Guest Demographics & Profile Analysis (2025)
Guest Profile Summary for Fourneville
- The typical guest profile for Airbnb in Fourneville consists of primarily domestic travelers (69%), often arriving from nearby Paris, typically belonging to the Post-2000s (Gen Z/Alpha) group (50%), primarily speaking English or French.
- Domestic travelers account for 69.4% of guests.
- Key international markets include France (69.4%) and Netherlands (9.3%).
- Top languages spoken are English (37.6%) followed by French (33%).
- A significant demographic segment is the Post-2000s (Gen Z/Alpha) group, representing 50% of guests.
Recommendations for Hosts
- Target domestic marketing efforts towards travelers from Paris and Brussels.
- Tailor amenities and listing descriptions to appeal to the dominant Post-2000s (Gen Z/Alpha) demographic (e.g., highlight fast WiFi, smart home features, local guides).
- Highlight unique local experiences or amenities relevant to the primary guest profile.
- Consider seasonal promotions aligned with peak travel times for key origin markets.
Nearby Short-Term Rental Market Comparison
How does the Fourneville Airbnb market stack up against its neighbors? Compare key performance metrics like average monthly revenue, ADR, and occupancy rates in surrounding areas to understand the broader regional STR landscape.
| Market | Active Properties | Monthly Revenue | Daily Rate | Avg. Occupancy |
|---|---|---|---|---|
| La Poterie-Cap-d'Antifer | 11 | $5,076 | $293.95 | 55% |
| Bonneville-sur-Touques | 16 | $3,903 | $367.00 | 40% |
| Luneray | 12 | $3,745 | $526.24 | 42% |
| La Couture-Boussey | 12 | $3,620 | $378.08 | 28% |
| Roedean | 47 | $3,494 | $257.09 | 47% |
| Saint-Étienne-la-Thillaye | 24 | $3,459 | $325.89 | 42% |
| Cricquebœuf | 10 | $3,417 | $268.29 | 46% |
| Caumont | 11 | $3,350 | $286.17 | 49% |
| Moulins-le-Carbonnel | 11 | $3,213 | $320.85 | 35% |
| Gonneville-en-Auge | 12 | $3,061 | $235.90 | 40% |