Dragey-Ronthon Airbnb Market Analysis 2025: Short Term Rental Data & Vacation Rental Statistics in Normandy, France
Is Airbnb profitable in Dragey-Ronthon in 2025? Explore comprehensive Airbnb analytics for Dragey-Ronthon, Normandy, France to uncover income potential. This 2025 STR market report for Dragey-Ronthon, based on AirROI data from April 2024 to March 2025, reveals key trends in the niche market of 34 active listings.
Whether you're considering an Airbnb investment in Dragey-Ronthon, optimizing your existing vacation rental, or exploring rental arbitrage opportunities, understanding the Dragey-Ronthon Airbnb data is crucial. Understanding the local regulations is key to maximizing your short term rental income potential. Let's dive into the specifics.
Key Dragey-Ronthon Airbnb Performance Metrics Overview
Monthly Airbnb Revenue Variations & Income Potential in Dragey-Ronthon (2025)
Understanding the monthly revenue variations for Airbnb listings in Dragey-Ronthon is key to maximizing your short term rental income potential. Seasonality significantly impacts earnings. Our analysis, based on data from the past 12 months, shows that the peak revenue month for STRs in Dragey-Ronthon is typically August, while March often presents the lowest earnings, highlighting opportunities for strategic pricing adjustments during shoulder and low seasons. Explore the typical Airbnb income in Dragey-Ronthon across different performance tiers:
- Best-in-class properties (Top 10%) achieve $5,633+ monthly, often utilizing dynamic pricing and superior guest experiences.
- Strong performing properties (Top 25%) earn $2,590 or more, indicating effective management and desirable locations/amenities.
- Typical properties (Median) generate around $1,332 per month, representing the average market performance.
- Entry-level properties (Bottom 25%) see earnings around $718, often with potential for optimization.
Average Monthly Airbnb Earnings Trend in Dragey-Ronthon
Dragey-Ronthon Airbnb Occupancy Rate Trends (2025)
Maximize your bookings by understanding the Dragey-Ronthon STR occupancy trends. Seasonal demand shifts significantly influence how often properties are booked. Typically, Augustsees the highest demand (peak season occupancy), while March experiences the lowest (low season). Effective strategies, like adjusting minimum stays or offering promotions, can boost occupancy during slower periods. Here's how different property tiers perform in Dragey-Ronthon:
- Best-in-class properties (Top 10%) achieve 74%+ occupancy, indicating high desirability and potentially optimized availability.
- Strong performing properties (Top 25%) maintain 53% or higher occupancy, suggesting good market fit and guest satisfaction.
- Typical properties (Median) have an occupancy rate around 35%.
- Entry-level properties (Bottom 25%) average 21% occupancy, potentially facing higher vacancy.
Average Monthly Occupancy Rate Trend in Dragey-Ronthon
Average Daily Rate (ADR) Airbnb Trends in Dragey-Ronthon (2025)
Effective short term rental pricing strategy in Dragey-Ronthon involves understanding monthly ADR fluctuations. The Average Daily Rate (ADR) for Airbnb in Dragey-Ronthon typically peaks in July and dips lowest during February. Leveraging Airbnb dynamic pricing tools or strategies based on this seasonality can significantly boost revenue. Here's a look at the typical nightly rates achieved:
- Best-in-class properties (Top 10%) command rates of $292+ per night, often due to premium features or locations.
- Strong performing properties (Top 25%) achieve nightly rates of $146 or more.
- Typical properties (Median) charge around $102 per night.
- Entry-level properties (Bottom 25%) earn around $77 per night.
Average Daily Rate (ADR) Trend by Month in Dragey-Ronthon
Get Live Dragey-Ronthon Market Intelligence 👇

Explore Real-time Analytics
Airbnb Seasonality Analysis & Trends in Dragey-Ronthon (2025)
Peak Season (August, June, May)
- Revenue averages $3,654 per month
- Occupancy rates average 54.2%
- Daily rates average $148
Shoulder Season
- Revenue averages $2,470 per month
- Occupancy maintains around 36.7%
- Daily rates hold near $147
Low Season (January, February, March)
- Revenue drops to average $1,388 per month
- Occupancy decreases to average 26.7%
- Daily rates adjust to average $136
Seasonality Insights for Dragey-Ronthon
- The Airbnb seasonality in Dragey-Ronthon shows highly seasonal trends requiring careful strategy. While the sections above show seasonal averages, it's also insightful to look at the extremes:
- During the high season, the absolute peak month showcases Dragey-Ronthon's highest earning potential, with monthly revenues capable of climbing to $3,974, occupancy reaching a high of 76.3%, and ADRs peaking at $153.
- Conversely, the slowest single month of the year, typically falling within the low season, marks the market's lowest point. In this month, revenue might dip to $1,292, occupancy could drop to 24.7%, and ADRs may adjust down to $131.
- Understanding both the seasonal averages and these monthly peaks and troughs in revenue, occupancy, and ADR is crucial for maximizing your Airbnb profit potential in Dragey-Ronthon.
Seasonal Strategies for Maximizing Profit
- Peak Season: Maximize revenue through premium pricing and potentially longer minimum stays. Ensure high availability.
- Low Season: Offer competitive pricing, special promotions (e.g., extended stay discounts), and flexible cancellation policies. Target off-season travelers like remote workers or budget-conscious guests.
- Shoulder Seasons: Implement dynamic pricing that balances peak and low rates. Target weekend travelers or specific events. Offer slightly more flexible terms than peak season.
- Regularly analyze your own performance against these Dragey-Ronthon seasonality benchmarks and adjust your pricing and availability strategy accordingly.
Best Areas for Airbnb Investment in Dragey-Ronthon (2025)
Exploring the top neighborhoods for short-term rentals in Dragey-Ronthon? This section highlights key areas, outlining why they are attractive for hosts and guests, along with notable local attractions. Consider these locations based on your target guest profile and investment strategy.
| Neighborhood / Area | Why Host Here? (Target Guests & Appeal) | Key Attractions & Landmarks |
|---|---|---|
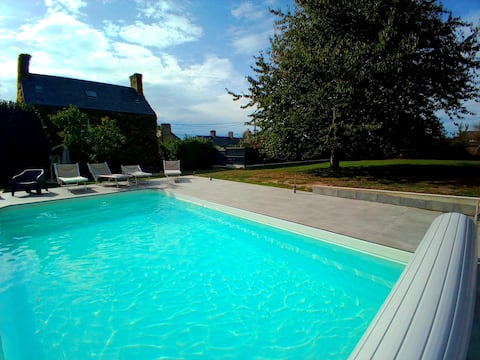
| Dragey-Ronthon Beach | A beautiful coastal area known for its stunning views of the Mont Saint-Michel bay. Ideal for tourists seeking beach access and scenic landscapes. | Mont Saint-Michel, Dragey Beach, Local seafood restaurants, Coastal hiking trails, Cultural events and festivals |
| Mont Saint-Michel | A UNESCO World Heritage site, attracting millions of visitors each year. Ideal for Airbnb investors due to its iconic status and historical significance. | Mont Saint-Michel Abbey, Village of Mont Saint-Michel, Tidal flats, Historical museums, Local artisan shops |
| Granville | A charming nearby town known for its historic architecture and seaside attractions. Offers shopping, dining, and cultural experiences for visitors. | Granville Museum, Hollyhock Gardens, Granville's beaches, Fishing port, Festival of Granville |
| Jullouville | A need a small coastal resort town known for its family-friendly beaches and relaxed atmosphere. Attractive to families and vacationers. | Jullouville Beach, Water sports activities, Cafes and family restaurants, Children's playgrounds, Beach events |
| Saint-Pair-sur-Mer | A popular seaside destination with sandy beaches and a vibrant promenade. It's great for water sports and relaxation by the sea. | Saint-Pair-sur-Mer Beach, Coastal cycle paths, Seaside restaurants, Beach sports, Local markets |
| Carolles | A peaceful coastal village offering a quieter experience with stunning sea views and nature trails. Perfect for nature lovers and retreat seekers. | Carolles Beach, Walking paths along the coast, Quiet village atmosphere, Nature reserves, Picnic areas |
| Avranches | A historic town located nearby, known for its medieval architecture and proximity to Mont Saint-Michel. A hub for visitors exploring the area. | Abbatiale Saint-Gaultier, Museums of Avranches, Historic city center, Roche Torin viewpoint, Botanical garden |
| Sottrum | A picturesque village offering a blend of rural charm and access to the beautiful Normandy countryside, ideal for visitors seeking tranquility. | Local farms, Scenic walking paths, Historic buildings, Community events, Local markets |
Understanding Airbnb License Requirements & STR Laws in Dragey-Ronthon (2025)
With 12% of listings showing registration in 2025, understanding potential Airbnb license requirements is crucial in Dragey-Ronthon. Always verify the latest short term rental regulations and Airbnb license requirements directly with local government authorities for Dragey-Ronthon to ensure full compliance before hosting.
(Source: AirROI data, 2025, based on 12% licensed listings)
Top Performing Airbnb Properties in Dragey-Ronthon (2025)
Benchmark your potential! Explore examples of top-performing Airbnb properties in Dragey-Ronthonbased on Trailing Twelve Month (TTM) revenue. Analyze their characteristics, revenue, occupancy rate, and ADR to understand what drives success in this market.

The grange of Tissey with spa and sauna
Entire Place • 5 bedrooms

Spacious Maison de Maître-Baie du Mont St Michel
Entire Place • 6 bedrooms
Domaine des Tisseys overlooking Mont St Michel
Entire Place • 6 bedrooms

Villa Jacqueline, the bay of Mont-Saint-Michel
Entire Place • 3 bedrooms

Renovated townhouse Baie du Mont St Michel
Entire Place • 2 bedrooms
The Three MA'TS
Entire Place • 5 bedrooms
Note: Performance varies based on location, size, amenities, seasonality, and management quality. Data reflects the past 12 months.
Top Performing Airbnb Hosts in Dragey-Ronthon (2025)
Learn from the best! This table showcases top-performing Airbnb hosts in Dragey-Ronthon based on the number of properties managed and estimated total revenue over the past year. Analyze their scale and performance metrics.
| Host Name | Properties | Grossing Revenue | Stay Reviews | Avg Rating |
|---|---|---|---|---|
| Sabine | 1 | $195,494 | 64 | 4.95/5.0 |
| Les Cigognes Noires | 1 | $76,167 | 19 | 4.89/5.0 |
| Rachel | 2 | $71,346 | 50 | 4.92/5.0 |
| Mariya | 1 | $51,713 | 4 | 5.00/5.0 |
| Vanessa | 1 | $39,482 | 49 | 4.96/5.0 |
| Guy Et Gisèle | 1 | $39,005 | 39 | 4.92/5.0 |
| Cloé | 1 | $31,740 | 17 | 4.94/5.0 |
| Alexandre | 1 | $30,373 | 21 | 5.00/5.0 |
| Franziska | 2 | $29,427 | 81 | 4.99/5.0 |
| Olivier | 2 | $28,219 | 269 | 4.88/5.0 |
Analyzing the strategies of top hosts, such as their property selection, pricing, and guest communication, can offer valuable lessons for optimizing your own Airbnb operations in Dragey-Ronthon.
Dive Deeper: Advanced Dragey-Ronthon STR Market Data (2025)
Ready to unlock more insights? AirROI provides access to advanced metrics and comprehensive Airbnb data for Dragey-Ronthon. Explore detailed analytics beyond this report to refine your investment strategy, optimize pricing, and maximize your vacation rental profits.
Explore Advanced MetricsDragey-Ronthon Short-Term Rental Market Composition (2025): Property & Room Types
Room Type Distribution
Property Type Distribution
Market Composition Insights for Dragey-Ronthon
- The Dragey-Ronthon Airbnb market composition is heavily skewed towards Entire Home/Apt listings, which make up 91.2% of the 34 active rentals. This indicates strong guest preference for privacy and space.
- Looking at the property type distribution in Dragey-Ronthon, House properties are the most common (70.6%), reflecting the local real estate landscape.
- Houses represent a significant 70.6% portion, catering likely to families or larger groups.
- The presence of 8.8% Hotel/Boutique listings indicates integration with traditional hospitality.
- Smaller segments like unique stays (combined 2.9%) offer potential for unique stay experiences.
Dragey-Ronthon Airbnb Room Capacity Analysis (2025): Bedroom Distribution
Distribution of Listings by Number of Bedrooms
Room Capacity Insights for Dragey-Ronthon
- The dominant room capacity in Dragey-Ronthon is 1 bedroom listings, making up 26.5% of the market. This suggests a strong demand for properties suitable for couples or solo travelers.
- Together, 1 bedroom and 3 bedrooms properties represent 50.0% of the active Airbnb listings in Dragey-Ronthon, indicating a high concentration in these sizes.
- A significant 41.1% of listings offer 3+ bedrooms, catering to larger groups and families seeking more space in Dragey-Ronthon.
Dragey-Ronthon Vacation Rental Guest Capacity Trends (2025)
Distribution of Listings by Guest Capacity
Guest Capacity Insights for Dragey-Ronthon
- The most common guest capacity trend in Dragey-Ronthon vacation rentals is listings accommodating 2 guests (20.6%). This suggests the primary traveler segment is likely couples or solo travelers.
- Properties designed for 2 guests and 8+ guests dominate the Dragey-Ronthon STR market, accounting for 41.2% of listings.
- 47.1% of properties accommodate 6+ guests, serving the market segment for larger families or group travel in Dragey-Ronthon.
- On average, properties in Dragey-Ronthon are equipped to host 4.8 guests.
Dragey-Ronthon Airbnb Booking Patterns (2025): Available vs. Booked Days
Available Days Distribution
Booked Days Distribution
Booking Pattern Insights for Dragey-Ronthon
- The most common availability pattern in Dragey-Ronthon falls within the 181-270 days range, representing 44.1% of listings. This suggests many properties have significant open periods on their calendars.
- Approximately 79.4% of listings show high availability (181+ days open annually), indicating potential for increased bookings or specific owner usage patterns.
- For booked days, the 91-180 days range is most frequent in Dragey-Ronthon (44.1%), reflecting common guest stay durations or potential owner blocking patterns.
- A notable 20.5% of properties secure long booking periods (181+ days booked per year), highlighting successful long-term rental strategies or significant owner usage.
Dragey-Ronthon Airbnb Minimum Stay Requirements Analysis
Distribution of Listings by Minimum Night Requirement
1 Night
6 listings
17.6% of total
2 Nights
14 listings
41.2% of total
3 Nights
2 listings
5.9% of total
4-6 Nights
5 listings
14.7% of total
7-29 Nights
1 listings
2.9% of total
30+ Nights
6 listings
17.6% of total
Key Insights
- The most prevalent minimum stay requirement in Dragey-Ronthon is 2 Nights, adopted by 41.2% of listings. This highlights the market's preference for shorter, flexible bookings.
- A significant segment (17.6%) caters to monthly stays (30+ nights) in Dragey-Ronthon, pointing to opportunities in the extended-stay market.
Recommendations
- Align with the market by considering a 2 Nights minimum stay, as 41.2% of Dragey-Ronthon hosts use this setting.
- If feasible, allowing 1-night stays, especially midweek or during low season, could capture last-minute bookings, as only 17.6% currently do.
- A 2-night minimum appears standard (41.2%). Consider this for weekends or peak periods.
- Explore offering discounts for stays of 30+ nights to attract the 17.6% of the market seeking extended stays.
- Adjust minimum nights based on seasonality – potentially shorter during low season and longer during peak demand periods in Dragey-Ronthon.
Dragey-Ronthon Airbnb Cancellation Policy Trends Analysis (2025)
Flexible
4 listings
11.8% of total
Moderate
10 listings
29.4% of total
Firm
5 listings
14.7% of total
Strict
15 listings
44.1% of total
Cancellation Policy Insights for Dragey-Ronthon
- The prevailing Airbnb cancellation policy trend in Dragey-Ronthon is Strict, used by 44.1% of listings.
- A majority (58.8%) of hosts in Dragey-Ronthon utilize Firm or Strict policies, indicating a market where hosts prioritize booking security.
Recommendations for Hosts
- Consider adopting a Strict policy to align with the 44.1% market standard in Dragey-Ronthon.
- With 44.1% using Strict terms, this is a viable option in Dragey-Ronthon, particularly for high-value properties or during peak demand periods.
- Regularly review your cancellation policy against competitors and market demand shifts in Dragey-Ronthon.
Dragey-Ronthon STR Booking Lead Time Analysis (2025)
Average Booking Lead Time by Month
Booking Lead Time Insights for Dragey-Ronthon
- The overall average booking lead time for vacation rentals in Dragey-Ronthon is 60 days.
- Guests book furthest in advance for stays during July (average 101 days), likely coinciding with peak travel demand or local events.
- The shortest booking windows occur for stays in February (average 29 days), indicating more last-minute travel plans during this time.
- Seasonally, Summer (96 days avg.) sees the longest lead times, while Winter (36 days avg.) has the shortest, reflecting typical travel planning cycles.
Recommendations for Hosts
- Use the overall average lead time (60 days) as a baseline for your pricing and availability strategy in Dragey-Ronthon.
- For July stays, consider implementing length-of-stay discounts or slightly higher rates for bookings made less than 101 days out to capitalize on advance planning.
- Target marketing efforts for the Summer season well in advance (at least 96 days) to capture early planners.
- Monitor your own booking lead times against these Dragey-Ronthon averages to identify opportunities for dynamic pricing adjustments.
Popular & Essential Airbnb Amenities in Dragey-Ronthon (2025)
Amenity Prevalence
Amenity Insights for Dragey-Ronthon
- Essential amenities in Dragey-Ronthon that guests expect include: Free parking on premises. Lacking these (this) could significantly impact bookings.
- Popular amenities like Refrigerator, Hot water, Dishes and silverware are common but not universal. Offering these can provide a competitive edge.
- Warning: Wifi is not universally provided but is considered essential globally. Ensure reliable Wifi is offered.
Recommendations for Hosts
- Ensure your listing includes all essential amenities for Dragey-Ronthon: Free parking on premises.
- Consider adding popular differentiators like Refrigerator or Hot water to increase appeal.
- Highlight unique or less common amenities you offer (e.g., hot tub, dedicated workspace, EV charger) in your listing description and photos.
- Regularly check competitor amenities in Dragey-Ronthon to stay competitive.
Dragey-Ronthon Airbnb Guest Demographics & Profile Analysis (2025)
Guest Profile Summary for Dragey-Ronthon
- The typical guest profile for Airbnb in Dragey-Ronthon consists of primarily domestic travelers (68%), often arriving from nearby Paris, typically belonging to the Post-2000s (Gen Z/Alpha) group (50%), primarily speaking English or French.
- Domestic travelers account for 67.8% of guests.
- Key international markets include France (67.8%) and Germany (10.5%).
- Top languages spoken are English (34.5%) followed by French (34.1%).
- A significant demographic segment is the Post-2000s (Gen Z/Alpha) group, representing 50% of guests.
Recommendations for Hosts
- Target domestic marketing efforts towards travelers from Paris and Rennes.
- Tailor amenities and listing descriptions to appeal to the dominant Post-2000s (Gen Z/Alpha) demographic (e.g., highlight fast WiFi, smart home features, local guides).
- Highlight unique local experiences or amenities relevant to the primary guest profile.
- Consider seasonal promotions aligned with peak travel times for key origin markets.
Nearby Short-Term Rental Market Comparison
How does the Dragey-Ronthon Airbnb market stack up against its neighbors? Compare key performance metrics like average monthly revenue, ADR, and occupancy rates in surrounding areas to understand the broader regional STR landscape.
| Market | Active Properties | Monthly Revenue | Daily Rate | Avg. Occupancy |
|---|---|---|---|---|
| St Martin | 14 | $4,074 | $436.70 | 51% |
| Moulins-le-Carbonnel | 11 | $3,213 | $320.85 | 35% |
| Gonneville-en-Auge | 12 | $3,061 | $235.90 | 40% |
| Vallon-sur-Gée | 11 | $2,913 | $379.01 | 30% |
| Saint Lawrence | 11 | $2,911 | $317.86 | 52% |
| Auberville | 22 | $2,777 | $249.63 | 36% |
| St Ouen | 15 | $2,635 | $339.51 | 51% |
| Chambellay | 11 | $2,525 | $255.24 | 34% |
| St Clement | 14 | $2,522 | $219.76 | 51% |
| Grouville | 21 | $2,510 | $218.40 | 52% |