Champeaux Airbnb Market Analysis 2025: Short Term Rental Data & Vacation Rental Statistics in Normandy, France
Is Airbnb profitable in Champeaux in 2025? Explore comprehensive Airbnb analytics for Champeaux, Normandy, France to uncover income potential. This 2025 STR market report for Champeaux, based on AirROI data from April 2024 to March 2025, reveals key trends in the niche market of 21 active listings.
Whether you're considering an Airbnb investment in Champeaux, optimizing your existing vacation rental, or exploring rental arbitrage opportunities, understanding the Champeaux Airbnb data is crucial. Leveraging the low regulation environment is key to maximizing your short term rental income potential. Let's dive into the specifics.
Key Champeaux Airbnb Performance Metrics Overview
Monthly Airbnb Revenue Variations & Income Potential in Champeaux (2025)
Understanding the monthly revenue variations for Airbnb listings in Champeaux is key to maximizing your short term rental income potential. Seasonality significantly impacts earnings. Our analysis, based on data from the past 12 months, shows that the peak revenue month for STRs in Champeaux is typically May, while December often presents the lowest earnings, highlighting opportunities for strategic pricing adjustments during shoulder and low seasons. Explore the typical Airbnb income in Champeaux across different performance tiers:
- Best-in-class properties (Top 10%) achieve $4,520+ monthly, often utilizing dynamic pricing and superior guest experiences.
- Strong performing properties (Top 25%) earn $2,350 or more, indicating effective management and desirable locations/amenities.
- Typical properties (Median) generate around $1,164 per month, representing the average market performance.
- Entry-level properties (Bottom 25%) see earnings around $654, often with potential for optimization.
Average Monthly Airbnb Earnings Trend in Champeaux
Champeaux Airbnb Occupancy Rate Trends (2025)
Maximize your bookings by understanding the Champeaux STR occupancy trends. Seasonal demand shifts significantly influence how often properties are booked. Typically, Augustsees the highest demand (peak season occupancy), while January experiences the lowest (low season). Effective strategies, like adjusting minimum stays or offering promotions, can boost occupancy during slower periods. Here's how different property tiers perform in Champeaux:
- Best-in-class properties (Top 10%) achieve 70%+ occupancy, indicating high desirability and potentially optimized availability.
- Strong performing properties (Top 25%) maintain 52% or higher occupancy, suggesting good market fit and guest satisfaction.
- Typical properties (Median) have an occupancy rate around 34%.
- Entry-level properties (Bottom 25%) average 19% occupancy, potentially facing higher vacancy.
Average Monthly Occupancy Rate Trend in Champeaux
Average Daily Rate (ADR) Airbnb Trends in Champeaux (2025)
Effective short term rental pricing strategy in Champeaux involves understanding monthly ADR fluctuations. The Average Daily Rate (ADR) for Airbnb in Champeaux typically peaks in November and dips lowest during February. Leveraging Airbnb dynamic pricing tools or strategies based on this seasonality can significantly boost revenue. Here's a look at the typical nightly rates achieved:
- Best-in-class properties (Top 10%) command rates of $319+ per night, often due to premium features or locations.
- Strong performing properties (Top 25%) achieve nightly rates of $177 or more.
- Typical properties (Median) charge around $100 per night.
- Entry-level properties (Bottom 25%) earn around $76 per night.
Average Daily Rate (ADR) Trend by Month in Champeaux
Get Live Champeaux Market Intelligence 👇

Explore Real-time Analytics
Airbnb Seasonality Analysis & Trends in Champeaux (2025)
Peak Season (May, April, August)
- Revenue averages $3,454 per month
- Occupancy rates average 51.8%
- Daily rates average $169
Shoulder Season
- Revenue averages $2,129 per month
- Occupancy maintains around 36.1%
- Daily rates hold near $153
Low Season (September, October, December)
- Revenue drops to average $1,137 per month
- Occupancy decreases to average 27.2%
- Daily rates adjust to average $169
Seasonality Insights for Champeaux
- The Airbnb seasonality in Champeaux shows highly seasonal trends requiring careful strategy. While the sections above show seasonal averages, it's also insightful to look at the extremes:
- During the high season, the absolute peak month showcases Champeaux's highest earning potential, with monthly revenues capable of climbing to $3,534, occupancy reaching a high of 63.3%, and ADRs peaking at $171.
- Conversely, the slowest single month of the year, typically falling within the low season, marks the market's lowest point. In this month, revenue might dip to $1,035, occupancy could drop to 22.3%, and ADRs may adjust down to $133.
- Understanding both the seasonal averages and these monthly peaks and troughs in revenue, occupancy, and ADR is crucial for maximizing your Airbnb profit potential in Champeaux.
Seasonal Strategies for Maximizing Profit
- Peak Season: Maximize revenue through premium pricing and potentially longer minimum stays. Ensure high availability.
- Low Season: Offer competitive pricing, special promotions (e.g., extended stay discounts), and flexible cancellation policies. Target off-season travelers like remote workers or budget-conscious guests.
- Shoulder Seasons: Implement dynamic pricing that balances peak and low rates. Target weekend travelers or specific events. Offer slightly more flexible terms than peak season.
- Regularly analyze your own performance against these Champeaux seasonality benchmarks and adjust your pricing and availability strategy accordingly.
Best Areas for Airbnb Investment in Champeaux (2025)
Exploring the top neighborhoods for short-term rentals in Champeaux? This section highlights key areas, outlining why they are attractive for hosts and guests, along with notable local attractions. Consider these locations based on your target guest profile and investment strategy.
| Neighborhood / Area | Why Host Here? (Target Guests & Appeal) | Key Attractions & Landmarks |
|---|---|---|
| Mont Saint-Michel | Iconic UNESCO World Heritage site known for its breathtaking views and historical significance. A must-see destination for tourists attracting millions every year, making it an ideal location for Airbnb hosting. | Mont Saint-Michel Abbey, Eglise Saint-Pierre, La Merveille, Musee Historique, Baie du Mont Saint-Michel |
| Granville | A charming coastal town with beautiful beaches, known for its history in the Impressionist art movement. Offers strong appeal to beach-goers and art lovers. | Granville Museum, Christian Dior Museum, Les Sables de Granville, Jardin Malakoff |
| Carentan | A historic town with a rich World War II history, attracting history buffs and tourists interested in D-Day sites and museums. | Utah Beach Museum, D-Day Experience, Carentan à la Une, Market Town |
| Cherbourg | A vibrant port city with rich maritime history and cultural attractions. It attracts both tourists and business travelers, making it a suitable investment area. | Cité de la Mer, Cherbourg Harbour, Batterie du Roule, Musée Thomas Henry |
| Isigny-sur-Mer | Famous for its dairy products and close to the D-Day beaches, this town offers a rural charm and attracts visitors interested in gastronomy and history. | Isigny Ste Mère Cheese, D-Day beaches, Seine Bay, Les Jardins de la Dame de Noche |
| Deauville | A glamorous town known for its beach, horse racing, and film festivals. Popular with affluent tourists looking for luxury experiences. | Deauville Beach, Deauville Casino, Promenade des Planches, American Film Festival |
| Bayeux | Home to the famous Bayeux Tapestry and historic sites from the medieval era. A central location for tourists exploring Normandy's history. | Bayeux Tapestry Museum, Cathedral of Notre Dame, Battle of Normandy Memorial Museum |
| Étretat | Known for its stunning coastal cliffs and natural beauty, a favorite among nature lovers and photographers, making it a desirable location for vacation rentals. | The cliffs of Étretat, Église Notre-Dame, Falaises d'Étretat |
Understanding Airbnb License Requirements & STR Laws in Champeaux (2025)
While Champeaux, Normandy, France currently shows low STR regulations, specific Airbnb license requirements might still exist or change. Always verify the latest short term rental regulations and Airbnb license requirements directly with local government authorities for Champeaux to ensure full compliance before hosting.
(Source: AirROI data, 2025, finding no licensed listings among those analyzed)
Top Performing Airbnb Properties in Champeaux (2025)
Benchmark your potential! Explore examples of top-performing Airbnb properties in Champeauxbased on Trailing Twelve Month (TTM) revenue. Analyze their characteristics, revenue, occupancy rate, and ADR to understand what drives success in this market.
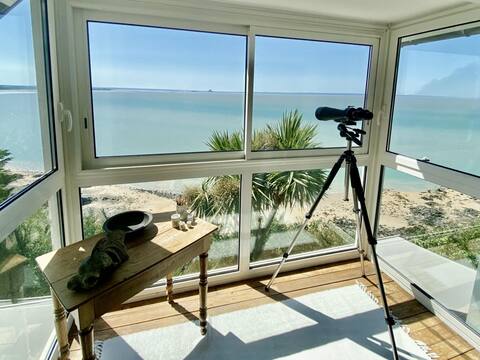
Cottage Pêcheur + Annexe 12pers vue Mont St Michel
Entire Place • 4 bedrooms
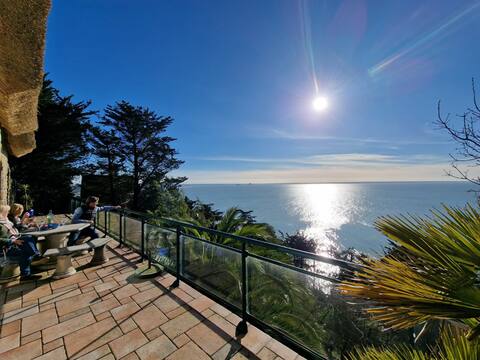
La Chaumière Vauban Sea View and Mont ST Michel
Entire Place • 5 bedrooms

La saunière - Chez Hélène
Entire Place • 3 bedrooms
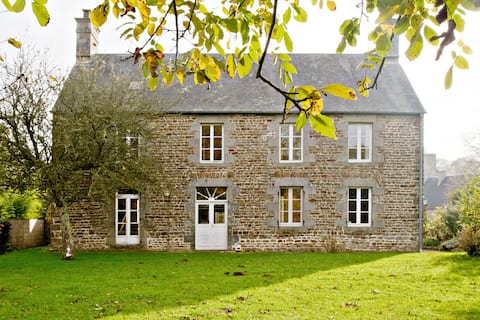
Large family home
Entire Place • 6 bedrooms
La petite saunière - Chez Hélène
Entire Place • 2 bedrooms
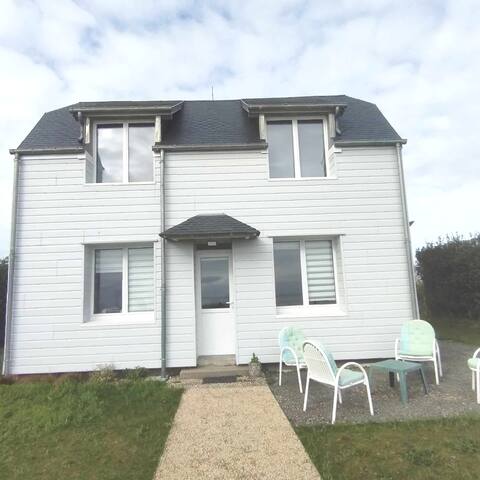
House overlooking Mt Saint Michel and its bay
Entire Place • 3 bedrooms
Note: Performance varies based on location, size, amenities, seasonality, and management quality. Data reflects the past 12 months.
Top Performing Airbnb Hosts in Champeaux (2025)
Learn from the best! This table showcases top-performing Airbnb hosts in Champeaux based on the number of properties managed and estimated total revenue over the past year. Analyze their scale and performance metrics.
| Host Name | Properties | Grossing Revenue | Stay Reviews | Avg Rating |
|---|---|---|---|---|
| Agence La Clef Decamp | 1 | $143,574 | 12 | 4.42/5.0 |
| Hélène | 3 | $71,837 | 195 | 4.97/5.0 |
| Marie | 1 | $38,407 | 4 | 4.75/5.0 |
| Caroline Ou François | 1 | $30,024 | 98 | 4.60/5.0 |
| Annick | 1 | $22,150 | 10 | 4.60/5.0 |
| Celine | 1 | $15,889 | 4 | 4.25/5.0 |
| Magali | 1 | $14,498 | 25 | 4.92/5.0 |
| Chantal | 1 | $13,682 | 48 | 4.88/5.0 |
| Yvonne | 2 | $12,969 | 173 | 4.92/5.0 |
| Rachel | 1 | $12,537 | 3 | 4.67/5.0 |
Analyzing the strategies of top hosts, such as their property selection, pricing, and guest communication, can offer valuable lessons for optimizing your own Airbnb operations in Champeaux.
Dive Deeper: Advanced Champeaux STR Market Data (2025)
Ready to unlock more insights? AirROI provides access to advanced metrics and comprehensive Airbnb data for Champeaux. Explore detailed analytics beyond this report to refine your investment strategy, optimize pricing, and maximize your vacation rental profits.
Explore Advanced MetricsChampeaux Short-Term Rental Market Composition (2025): Property & Room Types
Room Type Distribution
Property Type Distribution
Market Composition Insights for Champeaux
- The Champeaux Airbnb market composition is heavily skewed towards Entire Home/Apt listings, which make up 81% of the 21 active rentals. This indicates strong guest preference for privacy and space.
- Looking at the property type distribution in Champeaux, House properties are the most common (66.7%), reflecting the local real estate landscape.
- Houses represent a significant 66.7% portion, catering likely to families or larger groups.
- The presence of 19% Hotel/Boutique listings indicates integration with traditional hospitality.
Champeaux Airbnb Room Capacity Analysis (2025): Bedroom Distribution
Distribution of Listings by Number of Bedrooms
Room Capacity Insights for Champeaux
- The dominant room capacity in Champeaux is 1 bedroom listings, making up 28.6% of the market. This suggests a strong demand for properties suitable for couples or solo travelers.
- Together, 1 bedroom and 3 bedrooms properties represent 47.6% of the active Airbnb listings in Champeaux, indicating a high concentration in these sizes.
- A significant 42.8% of listings offer 3+ bedrooms, catering to larger groups and families seeking more space in Champeaux.
Champeaux Vacation Rental Guest Capacity Trends (2025)
Distribution of Listings by Guest Capacity
Guest Capacity Insights for Champeaux
- The most common guest capacity trend in Champeaux vacation rentals is listings accommodating 2 guests (23.8%). This suggests the primary traveler segment is likely couples or solo travelers.
- Properties designed for 2 guests and 8+ guests dominate the Champeaux STR market, accounting for 42.8% of listings.
- 42.8% of properties accommodate 6+ guests, serving the market segment for larger families or group travel in Champeaux.
- On average, properties in Champeaux are equipped to host 4.3 guests.
Champeaux Airbnb Booking Patterns (2025): Available vs. Booked Days
Available Days Distribution
Booked Days Distribution
Booking Pattern Insights for Champeaux
- The most common availability pattern in Champeaux falls within the 181-270 days range, representing 42.9% of listings. This suggests many properties have significant open periods on their calendars.
- Approximately 81.0% of listings show high availability (181+ days open annually), indicating potential for increased bookings or specific owner usage patterns.
- For booked days, the 91-180 days range is most frequent in Champeaux (42.9%), reflecting common guest stay durations or potential owner blocking patterns.
- A notable 19.0% of properties secure long booking periods (181+ days booked per year), highlighting successful long-term rental strategies or significant owner usage.
Champeaux Airbnb Minimum Stay Requirements Analysis
Distribution of Listings by Minimum Night Requirement
1 Night
4 listings
20% of total
2 Nights
4 listings
20% of total
3 Nights
3 listings
15% of total
4-6 Nights
4 listings
20% of total
7-29 Nights
1 listings
5% of total
30+ Nights
4 listings
20% of total
Key Insights
- The most prevalent minimum stay requirement in Champeaux is 1 Night, adopted by 20% of listings. This highlights the market's preference for shorter, flexible bookings.
- A significant segment (20%) caters to monthly stays (30+ nights) in Champeaux, pointing to opportunities in the extended-stay market.
Recommendations
- Align with the market by considering a 1 Night minimum stay, as 20% of Champeaux hosts use this setting.
- If feasible, allowing 1-night stays, especially midweek or during low season, could capture last-minute bookings, as only 20% currently do.
- Explore offering discounts for stays of 30+ nights to attract the 20% of the market seeking extended stays.
- Adjust minimum nights based on seasonality – potentially shorter during low season and longer during peak demand periods in Champeaux.
Champeaux Airbnb Cancellation Policy Trends Analysis (2025)
Flexible
2 listings
11.1% of total
Moderate
5 listings
27.8% of total
Firm
6 listings
33.3% of total
Strict
5 listings
27.8% of total
Cancellation Policy Insights for Champeaux
- The prevailing Airbnb cancellation policy trend in Champeaux is Firm, used by 33.3% of listings.
- A majority (61.1%) of hosts in Champeaux utilize Firm or Strict policies, indicating a market where hosts prioritize booking security.
Recommendations for Hosts
- Consider adopting a Firm policy to align with the 33.3% market standard in Champeaux.
- Regularly review your cancellation policy against competitors and market demand shifts in Champeaux.
Champeaux STR Booking Lead Time Analysis (2025)
Average Booking Lead Time by Month
Booking Lead Time Insights for Champeaux
- The overall average booking lead time for vacation rentals in Champeaux is 46 days.
- Guests book furthest in advance for stays during July (average 71 days), likely coinciding with peak travel demand or local events.
- The shortest booking windows occur for stays in March (average 19 days), indicating more last-minute travel plans during this time.
- Seasonally, Summer (58 days avg.) sees the longest lead times, while Winter (40 days avg.) has the shortest, reflecting typical travel planning cycles.
Recommendations for Hosts
- Use the overall average lead time (46 days) as a baseline for your pricing and availability strategy in Champeaux.
- For July stays, consider implementing length-of-stay discounts or slightly higher rates for bookings made less than 71 days out to capitalize on advance planning.
- Target marketing efforts for the Summer season well in advance (at least 58 days) to capture early planners.
- Monitor your own booking lead times against these Champeaux averages to identify opportunities for dynamic pricing adjustments.
Popular & Essential Airbnb Amenities in Champeaux (2025)
Amenity Prevalence
Amenity Insights for Champeaux
- Essential amenities in Champeaux that guests expect include: Free parking on premises, Heating, Kitchen, Hot water. Lacking these (any) could significantly impact bookings.
- Popular amenities like Refrigerator, Hangers, Dishes and silverware are common but not universal. Offering these can provide a competitive edge.
Recommendations for Hosts
- Ensure your listing includes all essential amenities for Champeaux: Free parking on premises, Heating, Kitchen, Hot water.
- Prioritize adding missing essentials: Free parking on premises, Heating, Kitchen, Hot water.
- Consider adding popular differentiators like Refrigerator or Hangers to increase appeal.
- Highlight unique or less common amenities you offer (e.g., hot tub, dedicated workspace, EV charger) in your listing description and photos.
- Regularly check competitor amenities in Champeaux to stay competitive.
Champeaux Airbnb Guest Demographics & Profile Analysis (2025)
Guest Profile Summary for Champeaux
- The typical guest profile for Airbnb in Champeaux consists of primarily domestic travelers (70%), often arriving from nearby Paris, typically belonging to the Post-2000s (Gen Z/Alpha) group (50%), primarily speaking English or French.
- Domestic travelers account for 69.6% of guests.
- Key international markets include France (69.6%) and Germany (8.8%).
- Top languages spoken are English (34%) followed by French (33%).
- A significant demographic segment is the Post-2000s (Gen Z/Alpha) group, representing 50% of guests.
Recommendations for Hosts
- Target domestic marketing efforts towards travelers from Paris and Rouen.
- Tailor amenities and listing descriptions to appeal to the dominant Post-2000s (Gen Z/Alpha) demographic (e.g., highlight fast WiFi, smart home features, local guides).
- Highlight unique local experiences or amenities relevant to the primary guest profile.
- Consider seasonal promotions aligned with peak travel times for key origin markets.
Nearby Short-Term Rental Market Comparison
How does the Champeaux Airbnb market stack up against its neighbors? Compare key performance metrics like average monthly revenue, ADR, and occupancy rates in surrounding areas to understand the broader regional STR landscape.
| Market | Active Properties | Monthly Revenue | Daily Rate | Avg. Occupancy |
|---|---|---|---|---|
| St Martin | 14 | $4,074 | $436.70 | 51% |
| Moulins-le-Carbonnel | 11 | $3,213 | $320.85 | 35% |
| Gonneville-en-Auge | 12 | $3,061 | $235.90 | 40% |
| Vallon-sur-Gée | 11 | $2,913 | $379.01 | 30% |
| Saint Lawrence | 11 | $2,911 | $317.86 | 52% |
| Auberville | 22 | $2,777 | $249.63 | 36% |
| St Ouen | 15 | $2,635 | $339.51 | 51% |
| Chambellay | 11 | $2,525 | $255.24 | 34% |
| St Clement | 14 | $2,522 | $219.76 | 51% |
| Grouville | 21 | $2,510 | $218.40 | 52% |