Blonville-sur-Mer Airbnb Market Analysis 2025: Short Term Rental Data & Vacation Rental Statistics in Normandy, France
Is Airbnb profitable in Blonville-sur-Mer in 2025? Explore comprehensive Airbnb analytics for Blonville-sur-Mer, Normandy, France to uncover income potential. This 2025 STR market report for Blonville-sur-Mer, based on AirROI data from April 2024 to March 2025, reveals key trends in the niche market of 188 active listings.
Whether you're considering an Airbnb investment in Blonville-sur-Mer, optimizing your existing vacation rental, or exploring rental arbitrage opportunities, understanding the Blonville-sur-Mer Airbnb data is crucial. Understanding the local regulations is key to maximizing your short term rental income potential. Let's dive into the specifics.
Key Blonville-sur-Mer Airbnb Performance Metrics Overview
Monthly Airbnb Revenue Variations & Income Potential in Blonville-sur-Mer (2025)
Understanding the monthly revenue variations for Airbnb listings in Blonville-sur-Mer is key to maximizing your short term rental income potential. Seasonality significantly impacts earnings. Our analysis, based on data from the past 12 months, shows that the peak revenue month for STRs in Blonville-sur-Mer is typically August, while January often presents the lowest earnings, highlighting opportunities for strategic pricing adjustments during shoulder and low seasons. Explore the typical Airbnb income in Blonville-sur-Mer across different performance tiers:
- Best-in-class properties (Top 10%) achieve $3,674+ monthly, often utilizing dynamic pricing and superior guest experiences.
- Strong performing properties (Top 25%) earn $2,294 or more, indicating effective management and desirable locations/amenities.
- Typical properties (Median) generate around $1,285 per month, representing the average market performance.
- Entry-level properties (Bottom 25%) see earnings around $695, often with potential for optimization.
Average Monthly Airbnb Earnings Trend in Blonville-sur-Mer
Blonville-sur-Mer Airbnb Occupancy Rate Trends (2025)
Maximize your bookings by understanding the Blonville-sur-Mer STR occupancy trends. Seasonal demand shifts significantly influence how often properties are booked. Typically, Augustsees the highest demand (peak season occupancy), while January experiences the lowest (low season). Effective strategies, like adjusting minimum stays or offering promotions, can boost occupancy during slower periods. Here's how different property tiers perform in Blonville-sur-Mer:
- Best-in-class properties (Top 10%) achieve 64%+ occupancy, indicating high desirability and potentially optimized availability.
- Strong performing properties (Top 25%) maintain 47% or higher occupancy, suggesting good market fit and guest satisfaction.
- Typical properties (Median) have an occupancy rate around 30%.
- Entry-level properties (Bottom 25%) average 16% occupancy, potentially facing higher vacancy.
Average Monthly Occupancy Rate Trend in Blonville-sur-Mer
Average Daily Rate (ADR) Airbnb Trends in Blonville-sur-Mer (2025)
Effective short term rental pricing strategy in Blonville-sur-Mer involves understanding monthly ADR fluctuations. The Average Daily Rate (ADR) for Airbnb in Blonville-sur-Mer typically peaks in July and dips lowest during March. Leveraging Airbnb dynamic pricing tools or strategies based on this seasonality can significantly boost revenue. Here's a look at the typical nightly rates achieved:
- Best-in-class properties (Top 10%) command rates of $320+ per night, often due to premium features or locations.
- Strong performing properties (Top 25%) achieve nightly rates of $179 or more.
- Typical properties (Median) charge around $119 per night.
- Entry-level properties (Bottom 25%) earn around $90 per night.
Average Daily Rate (ADR) Trend by Month in Blonville-sur-Mer
Get Live Blonville-sur-Mer Market Intelligence 👇

Explore Real-time Analytics
Airbnb Seasonality Analysis & Trends in Blonville-sur-Mer (2025)
Peak Season (August, July, May)
- Revenue averages $2,861 per month
- Occupancy rates average 50.4%
- Daily rates average $169
Shoulder Season
- Revenue averages $1,737 per month
- Occupancy maintains around 30.5%
- Daily rates hold near $162
Low Season (January, February, March)
- Revenue drops to average $898 per month
- Occupancy decreases to average 22.3%
- Daily rates adjust to average $154
Seasonality Insights for Blonville-sur-Mer
- The Airbnb seasonality in Blonville-sur-Mer shows highly seasonal trends requiring careful strategy. While the sections above show seasonal averages, it's also insightful to look at the extremes:
- During the high season, the absolute peak month showcases Blonville-sur-Mer's highest earning potential, with monthly revenues capable of climbing to $3,380, occupancy reaching a high of 65.7%, and ADRs peaking at $171.
- Conversely, the slowest single month of the year, typically falling within the low season, marks the market's lowest point. In this month, revenue might dip to $831, occupancy could drop to 19.1%, and ADRs may adjust down to $152.
- Understanding both the seasonal averages and these monthly peaks and troughs in revenue, occupancy, and ADR is crucial for maximizing your Airbnb profit potential in Blonville-sur-Mer.
Seasonal Strategies for Maximizing Profit
- Peak Season: Maximize revenue through premium pricing and potentially longer minimum stays. Ensure high availability.
- Low Season: Offer competitive pricing, special promotions (e.g., extended stay discounts), and flexible cancellation policies. Target off-season travelers like remote workers or budget-conscious guests.
- Shoulder Seasons: Implement dynamic pricing that balances peak and low rates. Target weekend travelers or specific events. Offer slightly more flexible terms than peak season.
- Regularly analyze your own performance against these Blonville-sur-Mer seasonality benchmarks and adjust your pricing and availability strategy accordingly.
Best Areas for Airbnb Investment in Blonville-sur-Mer (2025)
Exploring the top neighborhoods for short-term rentals in Blonville-sur-Mer? This section highlights key areas, outlining why they are attractive for hosts and guests, along with notable local attractions. Consider these locations based on your target guest profile and investment strategy.
| Neighborhood / Area | Why Host Here? (Target Guests & Appeal) | Key Attractions & Landmarks |
|---|---|---|
| Blonville Beach | A picturesque beach destination with beautiful sandy shores and access to water activities. Ideal for families and beachgoers in the summer. | Blonville Beach, Beach clubs, Water sports activities, Sunbathing spots, Seaside promenade |
| Downtown Blonville | The charming town center offers local shops, cafes, and cultural experiences. A great area for guests who want to explore local culture and cuisine. | Local boutiques, Cafes and bakeries, Markets, Cultural events, Historic architecture |
| Normandy Coast | Known for its stunning coastal views and historic significance, attracting visitors interested in history and nature. | Cliffs of Etretat, Historical sites, Nature trails, Scenic viewpoints, Photography spots |
| Deauville | A nearby upscale resort town known for its beautiful beaches and luxury amenities. Attracts upscale clientele seeking a glamorous beach vacation. | Casino Barriere, Deauville Beach, Deauville Marina, Horse racing events, Cultural festivals |
| Cabourg | A romantic seaside resort with a lovely beach and a charming town atmosphere, perfect for couples and families. | Cabourg Beach, Promenade Marcel Proust, Casino de Cabourg, Local seafood restaurants, Spa centers |
| Trouville-sur-Mer | A vibrant fishing port with a lively atmosphere, known for its seafood and beach activities. Popular with families and seafood lovers. | Trouville Beach, Fish market, Promenade, Water sports, Restaurants specializing in seafood |
| Houlgate | A quiet coastal town with family-friendly amenities and a lovely beach. Ideal for those seeking relaxation and tranquility. | Houlgate Beach, Historic villas, Nature walks, Cycling paths, Family parks |
| Villerville | A charming and tranquil village offering beautiful landscapes and views of the cliffs. Attracts those looking for peace and quiet. | Coastal walks, Cliff views, Art galleries, Local crafts, Wine tasting events |
Understanding Airbnb License Requirements & STR Laws in Blonville-sur-Mer (2025)
With 16% of listings showing registration in 2025, understanding potential Airbnb license requirements is crucial in Blonville-sur-Mer. Always verify the latest short term rental regulations and Airbnb license requirements directly with local government authorities for Blonville-sur-Mer to ensure full compliance before hosting.
(Source: AirROI data, 2025, based on 16% licensed listings)
Top Performing Airbnb Properties in Blonville-sur-Mer (2025)
Benchmark your potential! Explore examples of top-performing Airbnb properties in Blonville-sur-Merbased on Trailing Twelve Month (TTM) revenue. Analyze their characteristics, revenue, occupancy rate, and ADR to understand what drives success in this market.
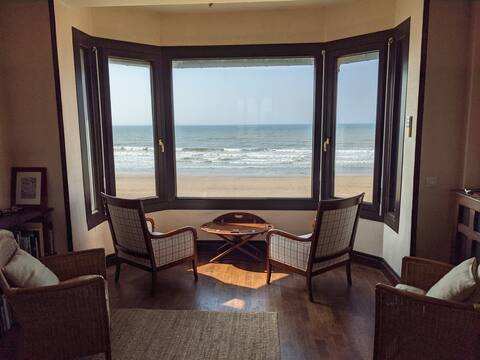
Big house on the seafront
Entire Place • 5 bedrooms
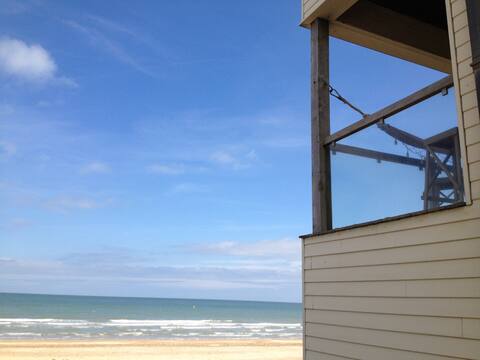
Stunning Beach house
Entire Place • 4 bedrooms

Superb holiday home 500 m from the beach
Entire Place • 8 bedrooms
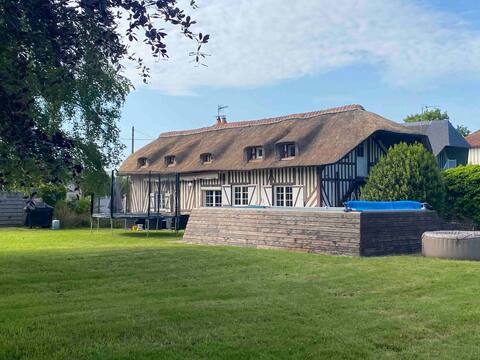
Chaumière with swimming pool near Deauville
Entire Place • 5 bedrooms
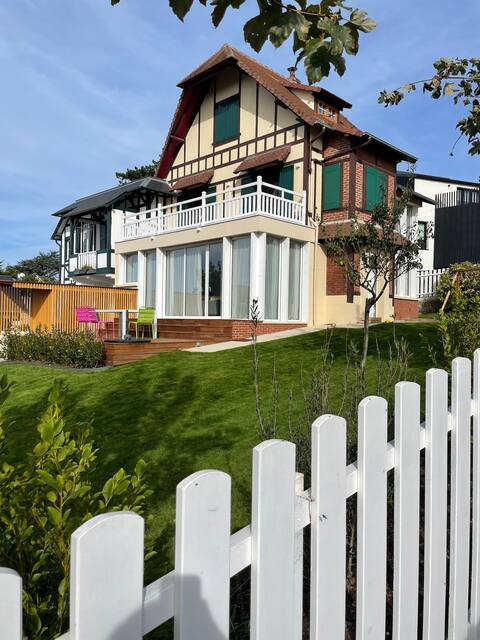
Villa located 300 meters from the beach
Entire Place • 5 bedrooms

House 3 min from the beach
Entire Place • 3 bedrooms
Note: Performance varies based on location, size, amenities, seasonality, and management quality. Data reflects the past 12 months.
Top Performing Airbnb Hosts in Blonville-sur-Mer (2025)
Learn from the best! This table showcases top-performing Airbnb hosts in Blonville-sur-Mer based on the number of properties managed and estimated total revenue over the past year. Analyze their scale and performance metrics.
| Host Name | Properties | Grossing Revenue | Stay Reviews | Avg Rating |
|---|---|---|---|---|
| Ghislaine | 1 | $91,924 | 22 | 4.95/5.0 |
| Mat | 1 | $82,010 | 162 | 4.85/5.0 |
| Maryline | 1 | $79,917 | 16 | 5.00/5.0 |
| Sabine Et Sébastien | 3 | $78,455 | 175 | 4.91/5.0 |
| Caroline | 1 | $74,350 | 3 | 4.67/5.0 |
| Véronique | 3 | $63,890 | 145 | 3.22/5.0 |
| Grégoire | 3 | $57,406 | 81 | 4.74/5.0 |
| Laura | 1 | $50,448 | 8 | 5.00/5.0 |
| Tiffany | 1 | $47,341 | 20 | 5.00/5.0 |
| Elisabeth | 2 | $45,048 | 12 | 5.00/5.0 |
Analyzing the strategies of top hosts, such as their property selection, pricing, and guest communication, can offer valuable lessons for optimizing your own Airbnb operations in Blonville-sur-Mer.
Dive Deeper: Advanced Blonville-sur-Mer STR Market Data (2025)
Ready to unlock more insights? AirROI provides access to advanced metrics and comprehensive Airbnb data for Blonville-sur-Mer. Explore detailed analytics beyond this report to refine your investment strategy, optimize pricing, and maximize your vacation rental profits.
Explore Advanced MetricsBlonville-sur-Mer Short-Term Rental Market Composition (2025): Property & Room Types
Room Type Distribution
Property Type Distribution
Market Composition Insights for Blonville-sur-Mer
- The Blonville-sur-Mer Airbnb market composition is heavily skewed towards Entire Home/Apt listings, which make up 98.4% of the 188 active rentals. This indicates strong guest preference for privacy and space.
- Looking at the property type distribution in Blonville-sur-Mer, Apartment/Condo properties are the most common (64.4%), reflecting the local real estate landscape.
- Houses represent a significant 31.9% portion, catering likely to families or larger groups.
- Smaller segments like outdoor/unique, hotel/boutique, others, unique stays (combined 3.7%) offer potential for unique stay experiences.
Blonville-sur-Mer Airbnb Room Capacity Analysis (2025): Bedroom Distribution
Distribution of Listings by Number of Bedrooms
Room Capacity Insights for Blonville-sur-Mer
- The dominant room capacity in Blonville-sur-Mer is 1 bedroom listings, making up 43.6% of the market. This suggests a strong demand for properties suitable for couples or solo travelers.
- Together, 1 bedroom and 2 bedrooms properties represent 63.8% of the active Airbnb listings in Blonville-sur-Mer, indicating a high concentration in these sizes.
- A significant 23.4% of listings offer 3+ bedrooms, catering to larger groups and families seeking more space in Blonville-sur-Mer.
Blonville-sur-Mer Vacation Rental Guest Capacity Trends (2025)
Distribution of Listings by Guest Capacity
Guest Capacity Insights for Blonville-sur-Mer
- The most common guest capacity trend in Blonville-sur-Mer vacation rentals is listings accommodating 4 guests (37.8%). This suggests the primary traveler segment is likely small families or groups.
- Properties designed for 4 guests and 2 guests dominate the Blonville-sur-Mer STR market, accounting for 60.1% of listings.
- 26.6% of properties accommodate 6+ guests, serving the market segment for larger families or group travel in Blonville-sur-Mer.
- On average, properties in Blonville-sur-Mer are equipped to host 4.3 guests.
Blonville-sur-Mer Airbnb Booking Patterns (2025): Available vs. Booked Days
Available Days Distribution
Booked Days Distribution
Booking Pattern Insights for Blonville-sur-Mer
- The most common availability pattern in Blonville-sur-Mer falls within the 271-366 days range, representing 54.8% of listings. This suggests many properties have significant open periods on their calendars.
- Approximately 85.7% of listings show high availability (181+ days open annually), indicating potential for increased bookings or specific owner usage patterns.
- For booked days, the 31-90 days range is most frequent in Blonville-sur-Mer (37.2%), reflecting common guest stay durations or potential owner blocking patterns.
- A notable 16.5% of properties secure long booking periods (181+ days booked per year), highlighting successful long-term rental strategies or significant owner usage.
Blonville-sur-Mer Airbnb Minimum Stay Requirements Analysis
Distribution of Listings by Minimum Night Requirement
1 Night
32 listings
18.4% of total
2 Nights
87 listings
50% of total
3 Nights
7 listings
4% of total
4-6 Nights
21 listings
12.1% of total
7-29 Nights
7 listings
4% of total
30+ Nights
20 listings
11.5% of total
Key Insights
- The most prevalent minimum stay requirement in Blonville-sur-Mer is 2 Nights, adopted by 50% of listings. This highlights the market's preference for shorter, flexible bookings.
- A strong majority (68.4%) of the Blonville-sur-Mer Airbnb data shows acceptance of very short stays (1-2 nights), indicating a dynamic, high-turnover market.
- A significant segment (11.5%) caters to monthly stays (30+ nights) in Blonville-sur-Mer, pointing to opportunities in the extended-stay market.
Recommendations
- Align with the market by considering a 2 Nights minimum stay, as 50% of Blonville-sur-Mer hosts use this setting.
- If feasible, allowing 1-night stays, especially midweek or during low season, could capture last-minute bookings, as only 18.4% currently do.
- A 2-night minimum appears standard (50%). Consider this for weekends or peak periods.
- Explore offering discounts for stays of 30+ nights to attract the 11.5% of the market seeking extended stays.
- Adjust minimum nights based on seasonality – potentially shorter during low season and longer during peak demand periods in Blonville-sur-Mer.
Blonville-sur-Mer Airbnb Cancellation Policy Trends Analysis (2025)
Flexible
34 listings
21.9% of total
Moderate
48 listings
31% of total
Firm
35 listings
22.6% of total
Strict
38 listings
24.5% of total
Cancellation Policy Insights for Blonville-sur-Mer
- The prevailing Airbnb cancellation policy trend in Blonville-sur-Mer is Moderate, used by 31% of listings.
- There's a relatively balanced mix between guest-friendly (52.9%) and stricter (47.1%) policies, offering choices for different guest needs.
Recommendations for Hosts
- Consider adopting a Moderate policy to align with the 31% market standard in Blonville-sur-Mer.
- Regularly review your cancellation policy against competitors and market demand shifts in Blonville-sur-Mer.
Blonville-sur-Mer STR Booking Lead Time Analysis (2025)
Average Booking Lead Time by Month
Booking Lead Time Insights for Blonville-sur-Mer
- The overall average booking lead time for vacation rentals in Blonville-sur-Mer is 45 days.
- Guests book furthest in advance for stays during July (average 78 days), likely coinciding with peak travel demand or local events.
- The shortest booking windows occur for stays in February (average 27 days), indicating more last-minute travel plans during this time.
- Seasonally, Summer (68 days avg.) sees the longest lead times, while Fall (36 days avg.) has the shortest, reflecting typical travel planning cycles.
Recommendations for Hosts
- Use the overall average lead time (45 days) as a baseline for your pricing and availability strategy in Blonville-sur-Mer.
- For July stays, consider implementing length-of-stay discounts or slightly higher rates for bookings made less than 78 days out to capitalize on advance planning.
- Target marketing efforts for the Summer season well in advance (at least 68 days) to capture early planners.
- Monitor your own booking lead times against these Blonville-sur-Mer averages to identify opportunities for dynamic pricing adjustments.
Popular & Essential Airbnb Amenities in Blonville-sur-Mer (2025)
Amenity Prevalence
Amenity Insights for Blonville-sur-Mer
- Essential amenities in Blonville-sur-Mer that guests expect include: Kitchen, Heating. Lacking these (any) could significantly impact bookings.
- Popular amenities like TV, Hot water, Smoke alarm are common but not universal. Offering these can provide a competitive edge.
Recommendations for Hosts
- Ensure your listing includes all essential amenities for Blonville-sur-Mer: Kitchen, Heating.
- Prioritize adding missing essentials: Kitchen, Heating.
- Consider adding popular differentiators like TV or Hot water to increase appeal.
- Highlight unique or less common amenities you offer (e.g., hot tub, dedicated workspace, EV charger) in your listing description and photos.
- Regularly check competitor amenities in Blonville-sur-Mer to stay competitive.
Blonville-sur-Mer Airbnb Guest Demographics & Profile Analysis (2025)
Guest Profile Summary for Blonville-sur-Mer
- The typical guest profile for Airbnb in Blonville-sur-Mer consists of primarily domestic travelers (85%), often arriving from nearby Paris, typically belonging to the Post-2000s (Gen Z/Alpha) group (50%), primarily speaking French or English.
- Domestic travelers account for 85.2% of guests.
- Key international markets include France (85.2%) and Germany (4.7%).
- Top languages spoken are French (43.5%) followed by English (33.8%).
- A significant demographic segment is the Post-2000s (Gen Z/Alpha) group, representing 50% of guests.
Recommendations for Hosts
- Target domestic marketing efforts towards travelers from Paris and Rouen.
- Tailor amenities and listing descriptions to appeal to the dominant Post-2000s (Gen Z/Alpha) demographic (e.g., highlight fast WiFi, smart home features, local guides).
- Highlight unique local experiences or amenities relevant to the primary guest profile.
- Consider seasonal promotions aligned with peak travel times for key origin markets.
Nearby Short-Term Rental Market Comparison
How does the Blonville-sur-Mer Airbnb market stack up against its neighbors? Compare key performance metrics like average monthly revenue, ADR, and occupancy rates in surrounding areas to understand the broader regional STR landscape.
| Market | Active Properties | Monthly Revenue | Daily Rate | Avg. Occupancy |
|---|---|---|---|---|
| La Poterie-Cap-d'Antifer | 11 | $5,076 | $293.95 | 55% |
| Bonneville-sur-Touques | 16 | $3,903 | $367.00 | 40% |
| Luneray | 12 | $3,745 | $526.24 | 42% |
| La Couture-Boussey | 12 | $3,620 | $378.08 | 28% |
| Roedean | 47 | $3,494 | $257.09 | 47% |
| Saint-Étienne-la-Thillaye | 24 | $3,459 | $325.89 | 42% |
| Cricquebœuf | 10 | $3,417 | $268.29 | 46% |
| Caumont | 11 | $3,350 | $286.17 | 49% |
| Moulins-le-Carbonnel | 11 | $3,213 | $320.85 | 35% |
| Gonneville-en-Auge | 12 | $3,061 | $235.90 | 40% |