Blainville-sur-Mer Airbnb Market Analysis 2025: Short Term Rental Data & Vacation Rental Statistics in Normandy, France
Is Airbnb profitable in Blainville-sur-Mer in 2025? Explore comprehensive Airbnb analytics for Blainville-sur-Mer, Normandy, France to uncover income potential. This 2025 STR market report for Blainville-sur-Mer, based on AirROI data from April 2024 to March 2025, reveals key trends in the niche market of 50 active listings.
Whether you're considering an Airbnb investment in Blainville-sur-Mer, optimizing your existing vacation rental, or exploring rental arbitrage opportunities, understanding the Blainville-sur-Mer Airbnb data is crucial. Understanding the local regulations is key to maximizing your short term rental income potential. Let's dive into the specifics.
Key Blainville-sur-Mer Airbnb Performance Metrics Overview
Monthly Airbnb Revenue Variations & Income Potential in Blainville-sur-Mer (2025)
Understanding the monthly revenue variations for Airbnb listings in Blainville-sur-Mer is key to maximizing your short term rental income potential. Seasonality significantly impacts earnings. Our analysis, based on data from the past 12 months, shows that the peak revenue month for STRs in Blainville-sur-Mer is typically August, while January often presents the lowest earnings, highlighting opportunities for strategic pricing adjustments during shoulder and low seasons. Explore the typical Airbnb income in Blainville-sur-Mer across different performance tiers:
- Best-in-class properties (Top 10%) achieve $3,179+ monthly, often utilizing dynamic pricing and superior guest experiences.
- Strong performing properties (Top 25%) earn $2,002 or more, indicating effective management and desirable locations/amenities.
- Typical properties (Median) generate around $1,214 per month, representing the average market performance.
- Entry-level properties (Bottom 25%) see earnings around $549, often with potential for optimization.
Average Monthly Airbnb Earnings Trend in Blainville-sur-Mer
Blainville-sur-Mer Airbnb Occupancy Rate Trends (2025)
Maximize your bookings by understanding the Blainville-sur-Mer STR occupancy trends. Seasonal demand shifts significantly influence how often properties are booked. Typically, Augustsees the highest demand (peak season occupancy), while January experiences the lowest (low season). Effective strategies, like adjusting minimum stays or offering promotions, can boost occupancy during slower periods. Here's how different property tiers perform in Blainville-sur-Mer:
- Best-in-class properties (Top 10%) achieve 56%+ occupancy, indicating high desirability and potentially optimized availability.
- Strong performing properties (Top 25%) maintain 45% or higher occupancy, suggesting good market fit and guest satisfaction.
- Typical properties (Median) have an occupancy rate around 29%.
- Entry-level properties (Bottom 25%) average 16% occupancy, potentially facing higher vacancy.
Average Monthly Occupancy Rate Trend in Blainville-sur-Mer
Average Daily Rate (ADR) Airbnb Trends in Blainville-sur-Mer (2025)
Effective short term rental pricing strategy in Blainville-sur-Mer involves understanding monthly ADR fluctuations. The Average Daily Rate (ADR) for Airbnb in Blainville-sur-Mer typically peaks in August and dips lowest during March. Leveraging Airbnb dynamic pricing tools or strategies based on this seasonality can significantly boost revenue. Here's a look at the typical nightly rates achieved:
- Best-in-class properties (Top 10%) command rates of $211+ per night, often due to premium features or locations.
- Strong performing properties (Top 25%) achieve nightly rates of $157 or more.
- Typical properties (Median) charge around $115 per night.
- Entry-level properties (Bottom 25%) earn around $90 per night.
Average Daily Rate (ADR) Trend by Month in Blainville-sur-Mer
Get Live Blainville-sur-Mer Market Intelligence 👇

Explore Real-time Analytics
Airbnb Seasonality Analysis & Trends in Blainville-sur-Mer (2025)
Peak Season (August, July, June)
- Revenue averages $2,310 per month
- Occupancy rates average 49.8%
- Daily rates average $140
Shoulder Season
- Revenue averages $1,437 per month
- Occupancy maintains around 27.9%
- Daily rates hold near $135
Low Season (January, October, November)
- Revenue drops to average $884 per month
- Occupancy decreases to average 20.5%
- Daily rates adjust to average $136
Seasonality Insights for Blainville-sur-Mer
- The Airbnb seasonality in Blainville-sur-Mer shows highly seasonal trends requiring careful strategy. While the sections above show seasonal averages, it's also insightful to look at the extremes:
- During the high season, the absolute peak month showcases Blainville-sur-Mer's highest earning potential, with monthly revenues capable of climbing to $2,734, occupancy reaching a high of 63.4%, and ADRs peaking at $141.
- Conversely, the slowest single month of the year, typically falling within the low season, marks the market's lowest point. In this month, revenue might dip to $715, occupancy could drop to 15.2%, and ADRs may adjust down to $133.
- Understanding both the seasonal averages and these monthly peaks and troughs in revenue, occupancy, and ADR is crucial for maximizing your Airbnb profit potential in Blainville-sur-Mer.
Seasonal Strategies for Maximizing Profit
- Peak Season: Maximize revenue through premium pricing and potentially longer minimum stays. Ensure high availability.
- Low Season: Offer competitive pricing, special promotions (e.g., extended stay discounts), and flexible cancellation policies. Target off-season travelers like remote workers or budget-conscious guests.
- Shoulder Seasons: Implement dynamic pricing that balances peak and low rates. Target weekend travelers or specific events. Offer slightly more flexible terms than peak season.
- Regularly analyze your own performance against these Blainville-sur-Mer seasonality benchmarks and adjust your pricing and availability strategy accordingly.
Best Areas for Airbnb Investment in Blainville-sur-Mer (2025)
Exploring the top neighborhoods for short-term rentals in Blainville-sur-Mer? This section highlights key areas, outlining why they are attractive for hosts and guests, along with notable local attractions. Consider these locations based on your target guest profile and investment strategy.
| Neighborhood / Area | Why Host Here? (Target Guests & Appeal) | Key Attractions & Landmarks |
|---|---|---|
| Littoral de Blainville-sur-Mer | A picturesque coastal area perfect for beachgoers and those seeking a tranquil seaside retreat. Offers access to beautiful sandy beaches and stunning sunsets. | Blainville-sur-Mer Beach, Dunes of Blainville, Local seafood restaurants, Water sports activities |
| Village de Blainville-sur-Mer | The charming village center offers a glimpse of local culture and community. Ideal for guests wanting a more intimate experience with the region's heritage. | Local markets, Historic churches, Community events, Local artisans and shops |
| Nearby Mont-Saint-Michel | A UNESCO World Heritage site, it attracts millions of visitors year-round. A great area for hosting guests who wish to explore this iconic landmark. | Mont-Saint-Michel Abbey, Historic village, Breathtaking views, Culinary tours |
| Cherbourg-en-Cotentin | A nearby port city with rich maritime history and a vibrant culture. Attracts visitors for its museums, parks, and coastal activities. | Cité de la Mer, Cherbourg Botanical Garden, La Fregate, Historic town center |
| Carentan-les-Marais | Known for its history and connection to D-Day, this area attracts history buffs and tourists interested in WWII events. | Utah Beach, D-Day beaches, Historical museums, Normandy American Cemetery |
| Creances Beach | A tranquil beach located close to Blainville-sur-Mer, ideal for families and relaxation. It offers a quaint atmosphere for vacationers. | Creances Beach, Coastal trails, Water activities, Quiet village charm |
| Coutances | A charming town known for its beautiful cathedral and gardens. Attracts tourists for its culture and history. | Coutances Cathedral, Botanical Garden, Local festivals, Art galleries |
| Barneville-Carteret | A beautiful seaside resort town with sandy beaches and outdoor activities. Popular for summer vacations and nature lovers. | Barneville Beach, Carteret Lighthouse, Water sports, Hiking paths |
Understanding Airbnb License Requirements & STR Laws in Blainville-sur-Mer (2025)
With 18% of listings showing registration in 2025, understanding potential Airbnb license requirements is crucial in Blainville-sur-Mer. Always verify the latest short term rental regulations and Airbnb license requirements directly with local government authorities for Blainville-sur-Mer to ensure full compliance before hosting.
(Source: AirROI data, 2025, based on 18% licensed listings)
Top Performing Airbnb Properties in Blainville-sur-Mer (2025)
Benchmark your potential! Explore examples of top-performing Airbnb properties in Blainville-sur-Merbased on Trailing Twelve Month (TTM) revenue. Analyze their characteristics, revenue, occupancy rate, and ADR to understand what drives success in this market.

Villas 8pers jacuzzis & sauna
Entire Place • 4 bedrooms
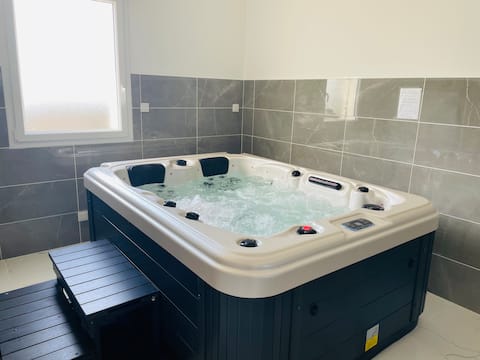
Private hot tub 500m from the sea
Entire Place • 2 bedrooms

Villa Jacuzzi & Sauna privatifs
Entire Place • 2 bedrooms
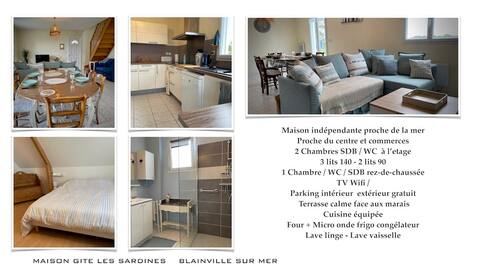
Les Sardines
Entire Place • 3 bedrooms
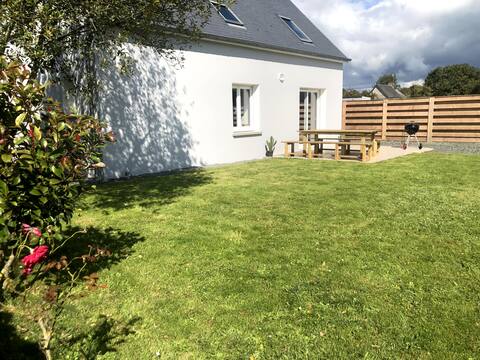
Family home 1 km from sea
Entire Place • 4 bedrooms
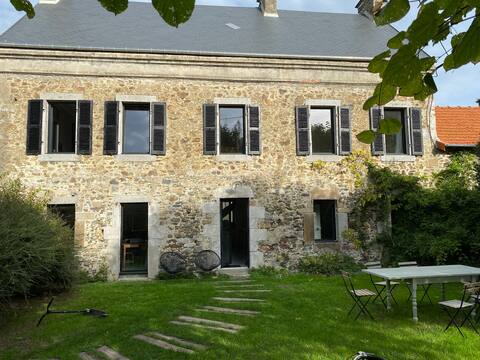
Charming house close to the sea
Entire Place • 4 bedrooms
Note: Performance varies based on location, size, amenities, seasonality, and management quality. Data reflects the past 12 months.
Top Performing Airbnb Hosts in Blainville-sur-Mer (2025)
Learn from the best! This table showcases top-performing Airbnb hosts in Blainville-sur-Mer based on the number of properties managed and estimated total revenue over the past year. Analyze their scale and performance metrics.
| Host Name | Properties | Grossing Revenue | Stay Reviews | Avg Rating |
|---|---|---|---|---|
| Emilie | 4 | $113,928 | 295 | 4.92/5.0 |
| Jean Christophe | 1 | $27,295 | 5 | 5.00/5.0 |
| Patrick Et Laurence | 1 | $24,975 | 19 | 4.84/5.0 |
| Gaelle | 1 | $23,141 | 18 | 4.78/5.0 |
| ConciergerieLine | 1 | $22,728 | 8 | 4.63/5.0 |
| Corinne | 1 | $20,103 | 14 | 4.79/5.0 |
| Anne-Marie | 1 | $19,881 | 39 | 4.77/5.0 |
| Gîtes Des Embruns | 1 | $19,598 | 14 | 4.86/5.0 |
| Pascal Et Catherine | 1 | $18,877 | 99 | 4.95/5.0 |
| Christine | 5 | $17,639 | 133 | 4.72/5.0 |
Analyzing the strategies of top hosts, such as their property selection, pricing, and guest communication, can offer valuable lessons for optimizing your own Airbnb operations in Blainville-sur-Mer.
Dive Deeper: Advanced Blainville-sur-Mer STR Market Data (2025)
Ready to unlock more insights? AirROI provides access to advanced metrics and comprehensive Airbnb data for Blainville-sur-Mer. Explore detailed analytics beyond this report to refine your investment strategy, optimize pricing, and maximize your vacation rental profits.
Explore Advanced MetricsBlainville-sur-Mer Short-Term Rental Market Composition (2025): Property & Room Types
Room Type Distribution
Property Type Distribution
Market Composition Insights for Blainville-sur-Mer
- The Blainville-sur-Mer Airbnb market composition is heavily skewed towards Entire Home/Apt listings, which make up 84% of the 50 active rentals. This indicates strong guest preference for privacy and space.
- Looking at the property type distribution in Blainville-sur-Mer, House properties are the most common (82%), reflecting the local real estate landscape.
- Houses represent a significant 82% portion, catering likely to families or larger groups.
- The presence of 12% Hotel/Boutique listings indicates integration with traditional hospitality.
- Smaller segments like apartment/condo, outdoor/unique, others (combined 6.0%) offer potential for unique stay experiences.
Blainville-sur-Mer Airbnb Room Capacity Analysis (2025): Bedroom Distribution
Distribution of Listings by Number of Bedrooms
Room Capacity Insights for Blainville-sur-Mer
- The dominant room capacity in Blainville-sur-Mer is 2 bedrooms listings, making up 42% of the market. This suggests a strong demand for properties suitable for couples or solo travelers.
- Together, 2 bedrooms and 3 bedrooms properties represent 62.0% of the active Airbnb listings in Blainville-sur-Mer, indicating a high concentration in these sizes.
- A significant 38.0% of listings offer 3+ bedrooms, catering to larger groups and families seeking more space in Blainville-sur-Mer.
Blainville-sur-Mer Vacation Rental Guest Capacity Trends (2025)
Distribution of Listings by Guest Capacity
Guest Capacity Insights for Blainville-sur-Mer
- The most common guest capacity trend in Blainville-sur-Mer vacation rentals is listings accommodating 4 guests (24%). This suggests the primary traveler segment is likely small families or groups.
- Properties designed for 4 guests and 6 guests dominate the Blainville-sur-Mer STR market, accounting for 44.0% of listings.
- 46.0% of properties accommodate 6+ guests, serving the market segment for larger families or group travel in Blainville-sur-Mer.
- On average, properties in Blainville-sur-Mer are equipped to host 4.7 guests.
Blainville-sur-Mer Airbnb Booking Patterns (2025): Available vs. Booked Days
Available Days Distribution
Booked Days Distribution
Booking Pattern Insights for Blainville-sur-Mer
- The most common availability pattern in Blainville-sur-Mer falls within the 271-366 days range, representing 62% of listings. This suggests many properties have significant open periods on their calendars.
- Approximately 98.0% of listings show high availability (181+ days open annually), indicating potential for increased bookings or specific owner usage patterns.
- For booked days, the 91-180 days range is most frequent in Blainville-sur-Mer (36%), reflecting common guest stay durations or potential owner blocking patterns.
- A notable 2.0% of properties secure long booking periods (181+ days booked per year), highlighting successful long-term rental strategies or significant owner usage.
Blainville-sur-Mer Airbnb Minimum Stay Requirements Analysis
Distribution of Listings by Minimum Night Requirement
1 Night
9 listings
18% of total
2 Nights
17 listings
34% of total
3 Nights
7 listings
14% of total
4-6 Nights
6 listings
12% of total
7-29 Nights
6 listings
12% of total
30+ Nights
5 listings
10% of total
Key Insights
- The most prevalent minimum stay requirement in Blainville-sur-Mer is 2 Nights, adopted by 34% of listings. This highlights the market's preference for shorter, flexible bookings.
Recommendations
- Align with the market by considering a 2 Nights minimum stay, as 34% of Blainville-sur-Mer hosts use this setting.
- If feasible, allowing 1-night stays, especially midweek or during low season, could capture last-minute bookings, as only 18% currently do.
- A 2-night minimum appears standard (34%). Consider this for weekends or peak periods.
- Explore offering discounts for stays of 30+ nights to attract the 10% of the market seeking extended stays.
- Adjust minimum nights based on seasonality – potentially shorter during low season and longer during peak demand periods in Blainville-sur-Mer.
Blainville-sur-Mer Airbnb Cancellation Policy Trends Analysis (2025)
Flexible
10 listings
21.3% of total
Moderate
7 listings
14.9% of total
Firm
13 listings
27.7% of total
Strict
17 listings
36.2% of total
Cancellation Policy Insights for Blainville-sur-Mer
- The prevailing Airbnb cancellation policy trend in Blainville-sur-Mer is Strict, used by 36.2% of listings.
- A majority (63.9%) of hosts in Blainville-sur-Mer utilize Firm or Strict policies, indicating a market where hosts prioritize booking security.
Recommendations for Hosts
- Consider adopting a Strict policy to align with the 36.2% market standard in Blainville-sur-Mer.
- With 36.2% using Strict terms, this is a viable option in Blainville-sur-Mer, particularly for high-value properties or during peak demand periods.
- Regularly review your cancellation policy against competitors and market demand shifts in Blainville-sur-Mer.
Blainville-sur-Mer STR Booking Lead Time Analysis (2025)
Average Booking Lead Time by Month
Booking Lead Time Insights for Blainville-sur-Mer
- The overall average booking lead time for vacation rentals in Blainville-sur-Mer is 57 days.
- Guests book furthest in advance for stays during July (average 103 days), likely coinciding with peak travel demand or local events.
- The shortest booking windows occur for stays in March (average 12 days), indicating more last-minute travel plans during this time.
- Seasonally, Summer (93 days avg.) sees the longest lead times, while Winter (37 days avg.) has the shortest, reflecting typical travel planning cycles.
Recommendations for Hosts
- Use the overall average lead time (57 days) as a baseline for your pricing and availability strategy in Blainville-sur-Mer.
- For July stays, consider implementing length-of-stay discounts or slightly higher rates for bookings made less than 103 days out to capitalize on advance planning.
- During March, focus on last-minute booking availability and promotions, as guests book with very short notice (12 days avg.).
- Target marketing efforts for the Summer season well in advance (at least 93 days) to capture early planners.
- Monitor your own booking lead times against these Blainville-sur-Mer averages to identify opportunities for dynamic pricing adjustments.
Popular & Essential Airbnb Amenities in Blainville-sur-Mer (2025)
Amenity Prevalence
Amenity Insights for Blainville-sur-Mer
- Essential amenities in Blainville-sur-Mer that guests expect include: Free parking on premises. Lacking these (this) could significantly impact bookings.
- Popular amenities like Heating, Kitchen, Hot water are common but not universal. Offering these can provide a competitive edge.
- Warning: Wifi is not universally provided but is considered essential globally. Ensure reliable Wifi is offered.
Recommendations for Hosts
- Ensure your listing includes all essential amenities for Blainville-sur-Mer: Free parking on premises.
- Prioritize adding missing essentials: Free parking on premises.
- Consider adding popular differentiators like Heating or Kitchen to increase appeal.
- Highlight unique or less common amenities you offer (e.g., hot tub, dedicated workspace, EV charger) in your listing description and photos.
- Regularly check competitor amenities in Blainville-sur-Mer to stay competitive.
Blainville-sur-Mer Airbnb Guest Demographics & Profile Analysis (2025)
Guest Profile Summary for Blainville-sur-Mer
- The typical guest profile for Airbnb in Blainville-sur-Mer consists of primarily domestic travelers (81%), often arriving from nearby Paris, typically belonging to the Post-2000s (Gen Z/Alpha) group (50%), primarily speaking French or English.
- Domestic travelers account for 81.0% of guests.
- Key international markets include France (81%) and Germany (4.2%).
- Top languages spoken are French (50.4%) followed by English (31.9%).
- A significant demographic segment is the Post-2000s (Gen Z/Alpha) group, representing 50% of guests.
Recommendations for Hosts
- Target domestic marketing efforts towards travelers from Paris and Caen.
- Tailor amenities and listing descriptions to appeal to the dominant Post-2000s (Gen Z/Alpha) demographic (e.g., highlight fast WiFi, smart home features, local guides).
- Highlight unique local experiences or amenities relevant to the primary guest profile.
- Consider seasonal promotions aligned with peak travel times for key origin markets.
Nearby Short-Term Rental Market Comparison
How does the Blainville-sur-Mer Airbnb market stack up against its neighbors? Compare key performance metrics like average monthly revenue, ADR, and occupancy rates in surrounding areas to understand the broader regional STR landscape.
| Market | Active Properties | Monthly Revenue | Daily Rate | Avg. Occupancy |
|---|---|---|---|---|
| Winsham | 10 | $5,154 | $484.22 | 52% |
| Osmington | 32 | $4,097 | $279.33 | 55% |
| St Martin | 14 | $4,074 | $436.70 | 51% |
| Nettlestone | 26 | $3,980 | $391.99 | 42% |
| Crossways | 37 | $3,903 | $460.52 | 33% |
| West Lulworth | 59 | $3,559 | $262.94 | 50% |
| Furzehill | 12 | $3,537 | $256.32 | 47% |
| Shorwell | 28 | $3,511 | $283.08 | 45% |
| St Ives | 15 | $3,509 | $243.56 | 46% |
| Roedean | 47 | $3,494 | $257.09 | 47% |