Amfreville Airbnb Market Analysis 2025: Short Term Rental Data & Vacation Rental Statistics in Normandy, France
Is Airbnb profitable in Amfreville in 2025? Explore comprehensive Airbnb analytics for Amfreville, Normandy, France to uncover income potential. This 2025 STR market report for Amfreville, based on AirROI data from April 2024 to March 2025, reveals key trends in the niche market of 17 active listings.
Whether you're considering an Airbnb investment in Amfreville, optimizing your existing vacation rental, or exploring rental arbitrage opportunities, understanding the Amfreville Airbnb data is crucial. Leveraging the low regulation environment is key to maximizing your short term rental income potential. Let's dive into the specifics.
Key Amfreville Airbnb Performance Metrics Overview
Monthly Airbnb Revenue Variations & Income Potential in Amfreville (2025)
Understanding the monthly revenue variations for Airbnb listings in Amfreville is key to maximizing your short term rental income potential. Seasonality significantly impacts earnings. Our analysis, based on data from the past 12 months, shows that the peak revenue month for STRs in Amfreville is typically August, while March often presents the lowest earnings, highlighting opportunities for strategic pricing adjustments during shoulder and low seasons. Explore the typical Airbnb income in Amfreville across different performance tiers:
- Best-in-class properties (Top 10%) achieve $7,305+ monthly, often utilizing dynamic pricing and superior guest experiences.
- Strong performing properties (Top 25%) earn $3,142 or more, indicating effective management and desirable locations/amenities.
- Typical properties (Median) generate around $848 per month, representing the average market performance.
- Entry-level properties (Bottom 25%) see earnings around $379, often with potential for optimization.
Average Monthly Airbnb Earnings Trend in Amfreville
Amfreville Airbnb Occupancy Rate Trends (2025)
Maximize your bookings by understanding the Amfreville STR occupancy trends. Seasonal demand shifts significantly influence how often properties are booked. Typically, Augustsees the highest demand (peak season occupancy), while March experiences the lowest (low season). Effective strategies, like adjusting minimum stays or offering promotions, can boost occupancy during slower periods. Here's how different property tiers perform in Amfreville:
- Best-in-class properties (Top 10%) achieve 71%+ occupancy, indicating high desirability and potentially optimized availability.
- Strong performing properties (Top 25%) maintain 44% or higher occupancy, suggesting good market fit and guest satisfaction.
- Typical properties (Median) have an occupancy rate around 21%.
- Entry-level properties (Bottom 25%) average 12% occupancy, potentially facing higher vacancy.
Average Monthly Occupancy Rate Trend in Amfreville
Average Daily Rate (ADR) Airbnb Trends in Amfreville (2025)
Effective short term rental pricing strategy in Amfreville involves understanding monthly ADR fluctuations. The Average Daily Rate (ADR) for Airbnb in Amfreville typically peaks in December and dips lowest during April. Leveraging Airbnb dynamic pricing tools or strategies based on this seasonality can significantly boost revenue. Here's a look at the typical nightly rates achieved:
- Best-in-class properties (Top 10%) command rates of $290+ per night, often due to premium features or locations.
- Strong performing properties (Top 25%) achieve nightly rates of $137 or more.
- Typical properties (Median) charge around $103 per night.
- Entry-level properties (Bottom 25%) earn around $92 per night.
Average Daily Rate (ADR) Trend by Month in Amfreville
Get Live Amfreville Market Intelligence 👇

Explore Real-time Analytics
Airbnb Seasonality Analysis & Trends in Amfreville (2025)
Peak Season (August, July, June)
- Revenue averages $3,927 per month
- Occupancy rates average 44.0%
- Daily rates average $152
Shoulder Season
- Revenue averages $3,094 per month
- Occupancy maintains around 28.4%
- Daily rates hold near $149
Low Season (February, March, September)
- Revenue drops to average $1,622 per month
- Occupancy decreases to average 20.5%
- Daily rates adjust to average $146
Seasonality Insights for Amfreville
- The Airbnb seasonality in Amfreville shows highly seasonal trends requiring careful strategy. While the sections above show seasonal averages, it's also insightful to look at the extremes:
- During the high season, the absolute peak month showcases Amfreville's highest earning potential, with monthly revenues capable of climbing to $4,149, occupancy reaching a high of 52.0%, and ADRs peaking at $172.
- Conversely, the slowest single month of the year, typically falling within the low season, marks the market's lowest point. In this month, revenue might dip to $1,114, occupancy could drop to 15.1%, and ADRs may adjust down to $134.
- Understanding both the seasonal averages and these monthly peaks and troughs in revenue, occupancy, and ADR is crucial for maximizing your Airbnb profit potential in Amfreville.
Seasonal Strategies for Maximizing Profit
- Peak Season: Maximize revenue through premium pricing and potentially longer minimum stays. Ensure high availability.
- Low Season: Offer competitive pricing, special promotions (e.g., extended stay discounts), and flexible cancellation policies. Target off-season travelers like remote workers or budget-conscious guests.
- Shoulder Seasons: Implement dynamic pricing that balances peak and low rates. Target weekend travelers or specific events. Offer slightly more flexible terms than peak season.
- Regularly analyze your own performance against these Amfreville seasonality benchmarks and adjust your pricing and availability strategy accordingly.
Best Areas for Airbnb Investment in Amfreville (2025)
Exploring the top neighborhoods for short-term rentals in Amfreville? This section highlights key areas, outlining why they are attractive for hosts and guests, along with notable local attractions. Consider these locations based on your target guest profile and investment strategy.
| Neighborhood / Area | Why Host Here? (Target Guests & Appeal) | Key Attractions & Landmarks |
|---|---|---|
| Le Havre | An important port city with rich maritime history and contemporary architecture. It attracts visitors seeking to experience coastal and cultural offerings, making it a prime destination for Airbnb. | Saint-Joseph Church, Le Volcan, MuMa Museum, Port of Le Havre, Jardins Suspendus |
| Rouen | Known for its medieval architecture and historic significance, Rouen attracts tourists interested in culture, history, and gastronomy, providing excellent opportunities for Airbnb hosts. | Rouen Cathedral, Gros-Horloge, Palais de Justice, Joan of Arc Museum, Rue Saint-Romain |
| Etretat | Famous for its stunning chalk cliffs and natural beauty, Etretat is a popular spot for nature lovers and tourists, ideal for vacation rentals. | Cliffs of Etretat, Etretat Beach, Chapelle Notre-Dame de la Garde, Golf d'Étretat, Falaise d'Amont |
| Dieppe | A charming seaside town with a rich history and beautiful beaches, Dieppe is ideal for summer tourists, making it a favorable location for Airbnb investments. | Dieppe Beach, Château de Dieppe, Port de Dieppe, Dieppe Maritime Museum, Vauban's Fortress |
| Fécamp | Known for its historical sites and seaside charm, Fécamp attracts visitors looking for a quieter coastal experience, providing a good market for Airbnb. | Fécamp Abbey, Etretat National Park, Grille au Poisson, Museum of the Benedictine, Fishermen's Port |
| Honfleur | A picturesque harbor town noted for its art scene and beautiful architecture, Honfleur is a hotspot for tourists and ideal for vacation rentals. | Old Port of Honfleur, Sainte-Catherine Church, Naturospace, Maisons de Pierre, Eugène Boudin Museum |
| Cabourg | Famous for its beaches and historic seaside casino, Cabourg is a popular resort town that attracts visitors year-round, suitable for Airbnb hosting. | Cabourg Beach, Casino de Cabourg, Grand Hotel Cabourg, Promenade Marcel Proust, Cabourg’s Fish Market |
| Lisieux | Historic city with a rich religious heritage, Lisieux attracts pilgrims and tourists interested in history, making it a viable option for Airbnb investments. | Basilica of Sainte-Thérèse, Lisieux Cathedral, Hermitage Sainte-Thérèse, Les Jardins de la Côte Fleuri, Palace of Lisieux |
Understanding Airbnb License Requirements & STR Laws in Amfreville (2025)
While Amfreville, Normandy, France currently shows low STR regulations, specific Airbnb license requirements might still exist or change. Always verify the latest short term rental regulations and Airbnb license requirements directly with local government authorities for Amfreville to ensure full compliance before hosting.
(Source: AirROI data, 2025, finding no licensed listings among those analyzed)
Top Performing Airbnb Properties in Amfreville (2025)
Benchmark your potential! Explore examples of top-performing Airbnb properties in Amfrevillebased on Trailing Twelve Month (TTM) revenue. Analyze their characteristics, revenue, occupancy rate, and ADR to understand what drives success in this market.
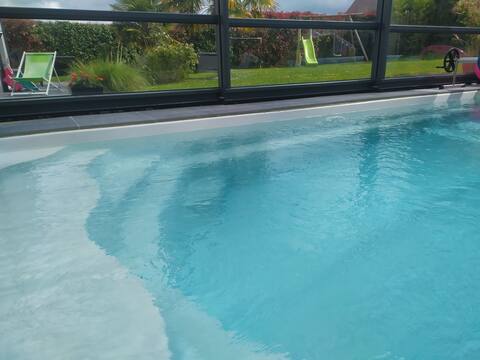
beachfront villa, indoor pool and spa day
Entire Place • 5 bedrooms
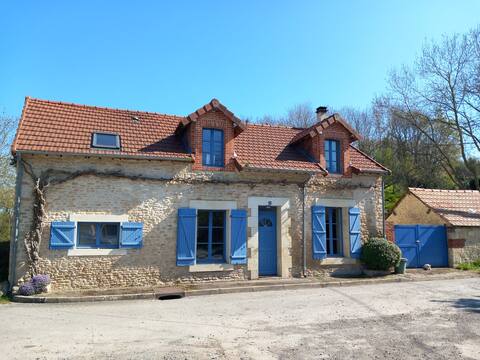
Rentals charming house
Entire Place • 4 bedrooms
Sunny House next to Cabourg
Entire Place • 4 bedrooms
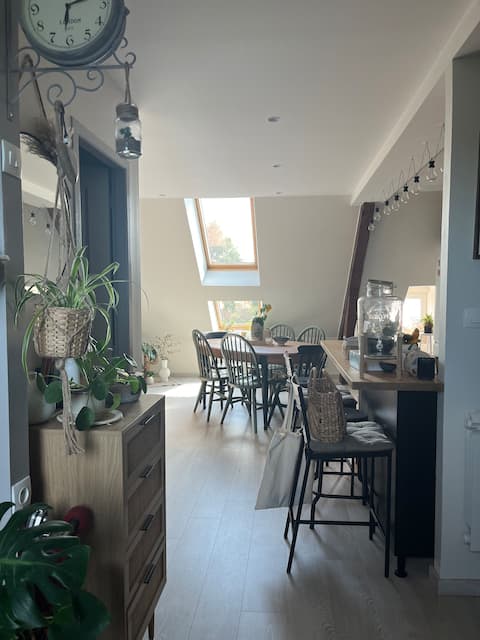
Bright apartment
Entire Place • 1 bedroom
Entire House: closed terrace 4 km from the beach
Entire Place • 1 bedroom
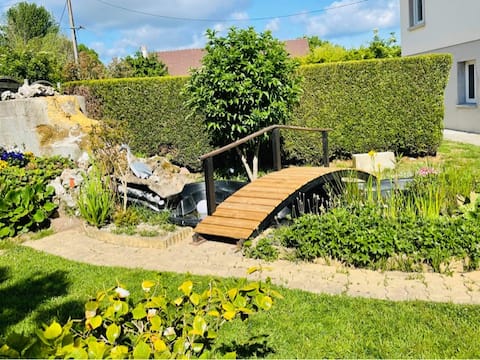
Maison entre mer et campagne
Entire Place • 3 bedrooms
Note: Performance varies based on location, size, amenities, seasonality, and management quality. Data reflects the past 12 months.
Top Performing Airbnb Hosts in Amfreville (2025)
Learn from the best! This table showcases top-performing Airbnb hosts in Amfreville based on the number of properties managed and estimated total revenue over the past year. Analyze their scale and performance metrics.
| Host Name | Properties | Grossing Revenue | Stay Reviews | Avg Rating |
|---|---|---|---|---|
| Guillaume | 1 | $182,904 | 12 | 4.92/5.0 |
| Maud | 1 | $20,471 | 3 | 5.00/5.0 |
| Judy | 1 | $16,772 | 62 | 4.89/5.0 |
| Sarah | 1 | $11,545 | 11 | 4.91/5.0 |
| Host #88487713 | 3 | $10,269 | 405 | 4.88/5.0 |
| Gilles | 2 | $9,030 | 108 | 4.63/5.0 |
| Isabelle | 3 | $7,539 | 127 | 4.88/5.0 |
| Host #3799754 | 1 | $5,359 | 1 | 0.00/5.0 |
| Host #14366259 | 1 | $2,139 | 0 | 0.00/5.0 |
| Aurélien | 1 | $2,029 | 4 | 4.75/5.0 |
Analyzing the strategies of top hosts, such as their property selection, pricing, and guest communication, can offer valuable lessons for optimizing your own Airbnb operations in Amfreville.
Dive Deeper: Advanced Amfreville STR Market Data (2025)
Ready to unlock more insights? AirROI provides access to advanced metrics and comprehensive Airbnb data for Amfreville. Explore detailed analytics beyond this report to refine your investment strategy, optimize pricing, and maximize your vacation rental profits.
Explore Advanced MetricsAmfreville Short-Term Rental Market Composition (2025): Property & Room Types
Room Type Distribution
Property Type Distribution
Market Composition Insights for Amfreville
- The Amfreville Airbnb market composition is heavily skewed towards Entire Home/Apt listings, which make up 76.5% of the 17 active rentals. This indicates strong guest preference for privacy and space.
- Looking at the property type distribution in Amfreville, House properties are the most common (58.8%), reflecting the local real estate landscape.
- Houses represent a significant 58.8% portion, catering likely to families or larger groups.
- The presence of 17.6% Hotel/Boutique listings indicates integration with traditional hospitality.
Amfreville Airbnb Room Capacity Analysis (2025): Bedroom Distribution
Distribution of Listings by Number of Bedrooms
Room Capacity Insights for Amfreville
- The dominant room capacity in Amfreville is 1 bedroom listings, making up 64.7% of the market. This suggests a strong demand for properties suitable for couples or solo travelers.
- Together, 1 bedroom and 4 bedrooms properties represent 76.5% of the active Airbnb listings in Amfreville, indicating a high concentration in these sizes.
- With over half the market (64.7%) consisting of studios or 1-bedroom units, Amfreville is particularly well-suited for individuals or couples.
- A significant 23.6% of listings offer 3+ bedrooms, catering to larger groups and families seeking more space in Amfreville.
Amfreville Vacation Rental Guest Capacity Trends (2025)
Distribution of Listings by Guest Capacity
Guest Capacity Insights for Amfreville
- The most common guest capacity trend in Amfreville vacation rentals is listings accommodating 2 guests (29.4%). This suggests the primary traveler segment is likely couples or solo travelers.
- Properties designed for 2 guests and 4 guests dominate the Amfreville STR market, accounting for 47.0% of listings.
- 17.7% of properties accommodate 6+ guests, serving the market segment for larger families or group travel in Amfreville.
- On average, properties in Amfreville are equipped to host 3.5 guests.
Amfreville Airbnb Booking Patterns (2025): Available vs. Booked Days
Available Days Distribution
Booked Days Distribution
Booking Pattern Insights for Amfreville
- The most common availability pattern in Amfreville falls within the 271-366 days range, representing 82.4% of listings. This suggests many properties have significant open periods on their calendars.
- Approximately 94.2% of listings show high availability (181+ days open annually), indicating potential for increased bookings or specific owner usage patterns.
- For booked days, the 31-90 days range is most frequent in Amfreville (41.2%), reflecting common guest stay durations or potential owner blocking patterns.
- A notable 5.9% of properties secure long booking periods (181+ days booked per year), highlighting successful long-term rental strategies or significant owner usage.
Amfreville Airbnb Minimum Stay Requirements Analysis
Distribution of Listings by Minimum Night Requirement
1 Night
6 listings
42.9% of total
2 Nights
4 listings
28.6% of total
3 Nights
2 listings
14.3% of total
4-6 Nights
2 listings
14.3% of total
Key Insights
- The most prevalent minimum stay requirement in Amfreville is 1 Night, adopted by 42.9% of listings. This highlights the market's preference for shorter, flexible bookings.
- A strong majority (71.5%) of the Amfreville Airbnb data shows acceptance of very short stays (1-2 nights), indicating a dynamic, high-turnover market.
Recommendations
- Align with the market by considering a 1 Night minimum stay, as 42.9% of Amfreville hosts use this setting.
- Adjust minimum nights based on seasonality – potentially shorter during low season and longer during peak demand periods in Amfreville.
Amfreville Airbnb Cancellation Policy Trends Analysis (2025)
Flexible
5 listings
35.7% of total
Moderate
3 listings
21.4% of total
Firm
1 listings
7.1% of total
Strict
5 listings
35.7% of total
Cancellation Policy Insights for Amfreville
- The prevailing Airbnb cancellation policy trend in Amfreville is Flexible, used by 35.7% of listings.
- There's a relatively balanced mix between guest-friendly (57.1%) and stricter (42.8%) policies, offering choices for different guest needs.
Recommendations for Hosts
- Consider adopting a Flexible policy to align with the 35.7% market standard in Amfreville.
- With 35.7% using Strict terms, this is a viable option in Amfreville, particularly for high-value properties or during peak demand periods.
- Regularly review your cancellation policy against competitors and market demand shifts in Amfreville.
Amfreville STR Booking Lead Time Analysis (2025)
Average Booking Lead Time by Month
Booking Lead Time Insights for Amfreville
- The overall average booking lead time for vacation rentals in Amfreville is 109 days.
- Guests book furthest in advance for stays during June (average 172 days), likely coinciding with peak travel demand or local events.
- The shortest booking windows occur for stays in March (average 32 days), indicating more last-minute travel plans during this time.
- Seasonally, Fall (108 days avg.) sees the longest lead times, while Spring (55 days avg.) has the shortest, reflecting typical travel planning cycles.
Recommendations for Hosts
- Use the overall average lead time (109 days) as a baseline for your pricing and availability strategy in Amfreville.
- For June stays, consider implementing length-of-stay discounts or slightly higher rates for bookings made less than 172 days out to capitalize on advance planning.
- Target marketing efforts for the Fall season well in advance (at least 108 days) to capture early planners.
- Monitor your own booking lead times against these Amfreville averages to identify opportunities for dynamic pricing adjustments.
Popular & Essential Airbnb Amenities in Amfreville (2025)
Amenity Prevalence
Amenity Insights for Amfreville
- Essential amenities in Amfreville that guests expect include: Wifi. Lacking these (this) could significantly impact bookings.
- Popular amenities like Heating, TV, Free parking on premises are common but not universal. Offering these can provide a competitive edge.
Recommendations for Hosts
- Ensure your listing includes all essential amenities for Amfreville: Wifi.
- Consider adding popular differentiators like Heating or TV to increase appeal.
- Highlight unique or less common amenities you offer (e.g., hot tub, dedicated workspace, EV charger) in your listing description and photos.
- Regularly check competitor amenities in Amfreville to stay competitive.
Amfreville Airbnb Guest Demographics & Profile Analysis (2025)
Guest Profile Summary for Amfreville
- The typical guest profile for Airbnb in Amfreville consists of primarily domestic travelers (71%), often arriving from nearby Paris, typically belonging to the Post-2000s (Gen Z/Alpha) group (50%), primarily speaking English or French.
- Domestic travelers account for 71.4% of guests.
- Key international markets include France (71.4%) and United Kingdom (8.9%).
- Top languages spoken are English (35.5%) followed by French (35.5%).
- A significant demographic segment is the Post-2000s (Gen Z/Alpha) group, representing 50% of guests.
Recommendations for Hosts
- Target domestic marketing efforts towards travelers from Paris and Savigny-sur-Orge.
- Tailor amenities and listing descriptions to appeal to the dominant Post-2000s (Gen Z/Alpha) demographic (e.g., highlight fast WiFi, smart home features, local guides).
- Highlight unique local experiences or amenities relevant to the primary guest profile.
- Consider seasonal promotions aligned with peak travel times for key origin markets.
Nearby Short-Term Rental Market Comparison
How does the Amfreville Airbnb market stack up against its neighbors? Compare key performance metrics like average monthly revenue, ADR, and occupancy rates in surrounding areas to understand the broader regional STR landscape.
| Market | Active Properties | Monthly Revenue | Daily Rate | Avg. Occupancy |
|---|---|---|---|---|
| La Poterie-Cap-d'Antifer | 11 | $5,076 | $293.95 | 55% |
| Nettlestone | 26 | $3,980 | $391.99 | 42% |
| Bonneville-sur-Touques | 16 | $3,903 | $367.00 | 40% |
| Luneray | 12 | $3,745 | $526.24 | 42% |
| Furzehill | 12 | $3,537 | $256.32 | 47% |
| Shorwell | 28 | $3,511 | $283.08 | 45% |
| St Ives | 15 | $3,509 | $243.56 | 46% |
| Roedean | 47 | $3,494 | $257.09 | 47% |
| Saint-Étienne-la-Thillaye | 24 | $3,459 | $325.89 | 42% |
| Cricquebœuf | 10 | $3,417 | $268.29 | 46% |