Schœlcher Airbnb Market Analysis 2025: Short Term Rental Data & Vacation Rental Statistics in Martinique, France
Is Airbnb profitable in Schœlcher in 2025? Explore comprehensive Airbnb analytics for Schœlcher, Martinique, France to uncover income potential. This 2025 STR market report for Schœlcher, based on AirROI data from April 2024 to March 2025, reveals key trends in the market of 215 active listings.
Whether you're considering an Airbnb investment in Schœlcher, optimizing your existing vacation rental, or exploring rental arbitrage opportunities, understanding the Schœlcher Airbnb data is crucial. Leveraging the low regulation environment is key to maximizing your short term rental income potential. Let's dive into the specifics.
Key Schœlcher Airbnb Performance Metrics Overview
Monthly Airbnb Revenue Variations & Income Potential in Schœlcher (2025)
Understanding the monthly revenue variations for Airbnb listings in Schœlcher is key to maximizing your short term rental income potential. Seasonality significantly impacts earnings. Our analysis, based on data from the past 12 months, shows that the peak revenue month for STRs in Schœlcher is typically February, while October often presents the lowest earnings, highlighting opportunities for strategic pricing adjustments during shoulder and low seasons. Explore the typical Airbnb income in Schœlcher across different performance tiers:
- Best-in-class properties (Top 10%) achieve $2,924+ monthly, often utilizing dynamic pricing and superior guest experiences.
- Strong performing properties (Top 25%) earn $1,882 or more, indicating effective management and desirable locations/amenities.
- Typical properties (Median) generate around $1,190 per month, representing the average market performance.
- Entry-level properties (Bottom 25%) see earnings around $606, often with potential for optimization.
Average Monthly Airbnb Earnings Trend in Schœlcher
Schœlcher Airbnb Occupancy Rate Trends (2025)
Maximize your bookings by understanding the Schœlcher STR occupancy trends. Seasonal demand shifts significantly influence how often properties are booked. Typically, Februarysees the highest demand (peak season occupancy), while June experiences the lowest (low season). Effective strategies, like adjusting minimum stays or offering promotions, can boost occupancy during slower periods. Here's how different property tiers perform in Schœlcher:
- Best-in-class properties (Top 10%) achieve 87%+ occupancy, indicating high desirability and potentially optimized availability.
- Strong performing properties (Top 25%) maintain 73% or higher occupancy, suggesting good market fit and guest satisfaction.
- Typical properties (Median) have an occupancy rate around 48%.
- Entry-level properties (Bottom 25%) average 23% occupancy, potentially facing higher vacancy.
Average Monthly Occupancy Rate Trend in Schœlcher
Average Daily Rate (ADR) Airbnb Trends in Schœlcher (2025)
Effective short term rental pricing strategy in Schœlcher involves understanding monthly ADR fluctuations. The Average Daily Rate (ADR) for Airbnb in Schœlcher typically peaks in January and dips lowest during September. Leveraging Airbnb dynamic pricing tools or strategies based on this seasonality can significantly boost revenue. Here's a look at the typical nightly rates achieved:
- Best-in-class properties (Top 10%) command rates of $164+ per night, often due to premium features or locations.
- Strong performing properties (Top 25%) achieve nightly rates of $100 or more.
- Typical properties (Median) charge around $74 per night.
- Entry-level properties (Bottom 25%) earn around $54 per night.
Average Daily Rate (ADR) Trend by Month in Schœlcher
Get Live Schœlcher Market Intelligence 👇

Explore Real-time Analytics
Airbnb Seasonality Analysis & Trends in Schœlcher (2025)
Peak Season (February, January, April)
- Revenue averages $1,845 per month
- Occupancy rates average 58.1%
- Daily rates average $100
Shoulder Season
- Revenue averages $1,520 per month
- Occupancy maintains around 46.2%
- Daily rates hold near $97
Low Season (July, September, October)
- Revenue drops to average $1,238 per month
- Occupancy decreases to average 42.7%
- Daily rates adjust to average $93
Seasonality Insights for Schœlcher
- The Airbnb seasonality in Schœlcher shows moderate seasonality with distinct peak and low periods. While the sections above show seasonal averages, it's also insightful to look at the extremes:
- During the high season, the absolute peak month showcases Schœlcher's highest earning potential, with monthly revenues capable of climbing to $1,994, occupancy reaching a high of 62.9%, and ADRs peaking at $103.
- Conversely, the slowest single month of the year, typically falling within the low season, marks the market's lowest point. In this month, revenue might dip to $1,150, occupancy could drop to 39.1%, and ADRs may adjust down to $93.
- Understanding both the seasonal averages and these monthly peaks and troughs in revenue, occupancy, and ADR is crucial for maximizing your Airbnb profit potential in Schœlcher.
Seasonal Strategies for Maximizing Profit
- Peak Season: Maximize revenue through premium pricing and potentially longer minimum stays. Ensure high availability.
- Low Season: Offer competitive pricing, special promotions (e.g., extended stay discounts), and flexible cancellation policies. Target off-season travelers like remote workers or budget-conscious guests.
- Shoulder Seasons: Implement dynamic pricing that balances peak and low rates. Target weekend travelers or specific events. Offer slightly more flexible terms than peak season.
- Regularly analyze your own performance against these Schœlcher seasonality benchmarks and adjust your pricing and availability strategy accordingly.
Best Areas for Airbnb Investment in Schœlcher (2025)
Exploring the top neighborhoods for short-term rentals in Schœlcher? This section highlights key areas, outlining why they are attractive for hosts and guests, along with notable local attractions. Consider these locations based on your target guest profile and investment strategy.
| Neighborhood / Area | Why Host Here? (Target Guests & Appeal) | Key Attractions & Landmarks |
|---|---|---|
| Anse Michel | A picturesque beach location known for its beautiful sandy stretches and calm waters. Anse Michel is perfect for hosting families and couples looking for a serene getaway, with opportunities for water sports and relaxation. | Anse Michel Beach, Water sports, Local beach bars, Scuba diving, Snorkeling |
| Trinité | A charming coastal town with stunning views and authentic local culture. Trinité attracts tourists looking for a more relaxed experience away from the hustle of larger cities, with access to local markets and historical sites. | St. James Rum Distillery, La Fregate Beach, Local markets, Historical sites, Nature trails |
| Fort de France | The capital city of Martinique, Fort de France offers urban attractions, cultural experiences, and a vibrant nightlife. It's perfect for tourists who enjoy city amenities while being close to beautiful beaches. | La Savane Park, Fort Saint Louis, The Cathedral of Our Lady of Fort de France, Local restaurants and shops, Ferry access to other islands |
| Salines Beach | One of the most famous beaches in Martinique, known for its stunning scenery and turquoise waters. Salines Beach attracts tourists looking to experience the best of Caribbean beach life. | Salines Beach, Local beach bars, Sunbathing and swimming, Water sports facilities, Coconut vendors |
| Sainte-Anne | A vibrant area known for its lively atmosphere, markets, and access to pristine beaches. Sainte-Anne is ideal for family vacations and travelers looking for local culture and beach activities. | Anse Caritan Beach, Sainte-Anne Market, Water sports, Local cuisine, Grocery stores nearby |
| Le Diamant | A beautiful coastal town featuring the iconic Diamond Rock and stunning beaches. Known for its relaxed vibe, Le Diamant is popular with couples and those seeking a romantic getaway. | Diamond Rock, Le Diamant Beach, Local restaurants, Hiking trails, Cultural heritage sites |
| Le Marin | A harbor town known for its marina and nautical activities. Le Marin is a hub for sailing and boating enthusiasts, making it attractive for vacationers looking for water-related activities. | Marina du Marin, Boat tours, Water sports activities, Local seafood dining, Nearby beaches |
| Case Pilote | A quaint fishing village with a picturesque setting, offering a glimpse into authentic Martinique life. Case Pilote is ideal for those seeking tranquility and a genuine cultural experience. | Case Pilote Beach, Local fishing activities, Cultural festivals, Authentic Creole dining, Scenic views of the bay |
Understanding Airbnb License Requirements & STR Laws in Schœlcher (2025)
While Schœlcher, Martinique, France currently shows low STR regulations, specific Airbnb license requirements might still exist or change. Always verify the latest short term rental regulations and Airbnb license requirements directly with local government authorities for Schœlcher to ensure full compliance before hosting.
(Source: AirROI data, 2025, finding no licensed listings among those analyzed)
Top Performing Airbnb Properties in Schœlcher (2025)
Benchmark your potential! Explore examples of top-performing Airbnb properties in Schœlcherbased on Trailing Twelve Month (TTM) revenue. Analyze their characteristics, revenue, occupancy rate, and ADR to understand what drives success in this market.
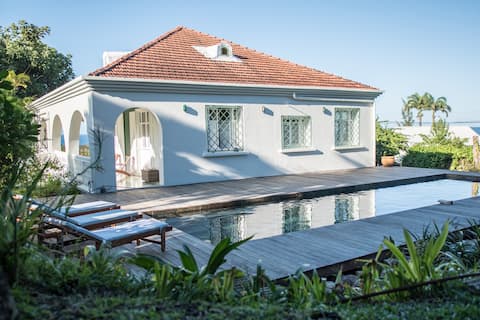
Villa Kigelia, Creole house from the 30s, sea view.
Entire Place • 4 bedrooms
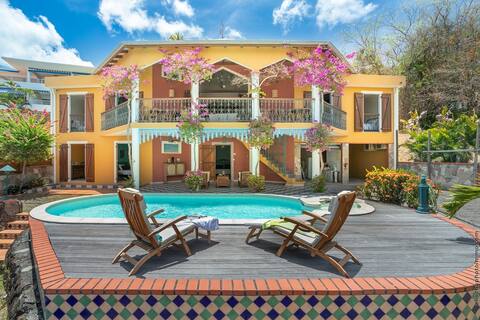
Villa Sol Y Sombra
Entire Place • 5 bedrooms

Malina in Schoelcher, Fort de France
Entire Place • 2 bedrooms
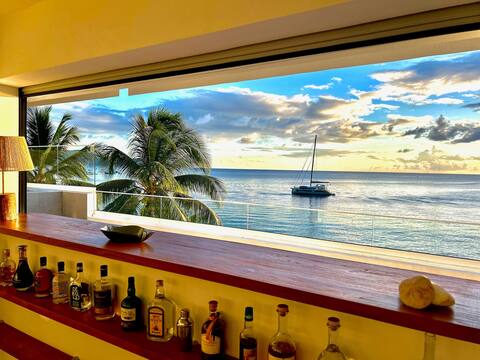
La Plage Martinique - The Penthouse
Entire Place • 3 bedrooms

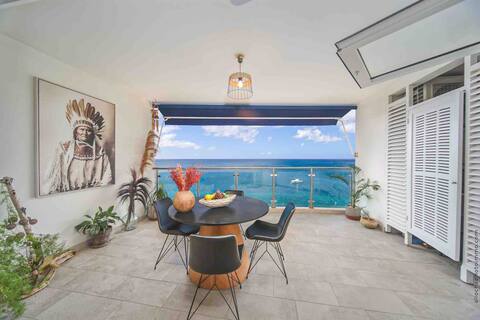
La Plage Martinique - 1BDR on the Beach
Entire Place • 1 bedroom
Moana Apartment
Entire Place • 1 bedroom
Note: Performance varies based on location, size, amenities, seasonality, and management quality. Data reflects the past 12 months.
Top Performing Airbnb Hosts in Schœlcher (2025)
Learn from the best! This table showcases top-performing Airbnb hosts in Schœlcher based on the number of properties managed and estimated total revenue over the past year. Analyze their scale and performance metrics.
| Host Name | Properties | Grossing Revenue | Stay Reviews | Avg Rating |
|---|---|---|---|---|
| Ela | 7 | $176,382 | 25 | 2.86/5.0 |
| Capucine | 1 | $106,488 | 51 | 4.94/5.0 |
| Sandra Et Luca | 5 | $98,169 | 307 | 4.86/5.0 |
| Fabien | 1 | $80,303 | 8 | 4.25/5.0 |
| Julia | 7 | $77,613 | 64 | 2.09/5.0 |
| Anne-Marie | 2 | $67,511 | 18 | 5.00/5.0 |
| Montserrat | 1 | $63,074 | 6 | 5.00/5.0 |
| Justine Et Joseph | 2 | $60,952 | 135 | 4.96/5.0 |
| Willy | 8 | $58,261 | 170 | 4.88/5.0 |
| Coralie | 3 | $38,742 | 71 | 4.89/5.0 |
Analyzing the strategies of top hosts, such as their property selection, pricing, and guest communication, can offer valuable lessons for optimizing your own Airbnb operations in Schœlcher.
Dive Deeper: Advanced Schœlcher STR Market Data (2025)
Ready to unlock more insights? AirROI provides access to advanced metrics and comprehensive Airbnb data for Schœlcher. Explore detailed analytics beyond this report to refine your investment strategy, optimize pricing, and maximize your vacation rental profits.
Explore Advanced MetricsSchœlcher Short-Term Rental Market Composition (2025): Property & Room Types
Room Type Distribution
Property Type Distribution
Market Composition Insights for Schœlcher
- The Schœlcher Airbnb market composition is heavily skewed towards Entire Home/Apt listings, which make up 91.6% of the 215 active rentals. This indicates strong guest preference for privacy and space.
- Looking at the property type distribution in Schœlcher, Apartment/Condo properties are the most common (70.7%), reflecting the local real estate landscape.
- Houses represent a significant 20.5% portion, catering likely to families or larger groups.
- The presence of 5.1% Hotel/Boutique listings indicates integration with traditional hospitality.
- Smaller segments like others (combined 3.7%) offer potential for unique stay experiences.
Schœlcher Airbnb Room Capacity Analysis (2025): Bedroom Distribution
Distribution of Listings by Number of Bedrooms
Room Capacity Insights for Schœlcher
- The dominant room capacity in Schœlcher is 1 bedroom listings, making up 49.3% of the market. This suggests a strong demand for properties suitable for couples or solo travelers.
- Together, 1 bedroom and 2 bedrooms properties represent 72.1% of the active Airbnb listings in Schœlcher, indicating a high concentration in these sizes.
Schœlcher Vacation Rental Guest Capacity Trends (2025)
Distribution of Listings by Guest Capacity
Guest Capacity Insights for Schœlcher
- The most common guest capacity trend in Schœlcher vacation rentals is listings accommodating 2 guests (41.4%). This suggests the primary traveler segment is likely couples or solo travelers.
- Properties designed for 2 guests and 4 guests dominate the Schœlcher STR market, accounting for 69.3% of listings.
- A significant 42.8% of listings cater specifically to 1-2 guests, highlighting strong demand from couples and solo travelers in Schœlcher.
- 11.6% of properties accommodate 6+ guests, serving the market segment for larger families or group travel in Schœlcher.
- On average, properties in Schœlcher are equipped to host 3.2 guests.
Schœlcher Airbnb Booking Patterns (2025): Available vs. Booked Days
Available Days Distribution
Booked Days Distribution
Booking Pattern Insights for Schœlcher
- The most common availability pattern in Schœlcher falls within the 271-366 days range, representing 40% of listings. This suggests many properties have significant open periods on their calendars.
- Approximately 67.4% of listings show high availability (181+ days open annually), indicating potential for increased bookings or specific owner usage patterns.
- For booked days, the 91-180 days range is most frequent in Schœlcher (27.9%), reflecting common guest stay durations or potential owner blocking patterns.
- A notable 33.5% of properties secure long booking periods (181+ days booked per year), highlighting successful long-term rental strategies or significant owner usage.
Schœlcher Airbnb Minimum Stay Requirements Analysis
Distribution of Listings by Minimum Night Requirement
1 Night
14 listings
6.8% of total
2 Nights
21 listings
10.2% of total
3 Nights
38 listings
18.5% of total
4-6 Nights
88 listings
42.9% of total
7-29 Nights
19 listings
9.3% of total
30+ Nights
25 listings
12.2% of total
Key Insights
- The most prevalent minimum stay requirement in Schœlcher is 4-6 Nights, adopted by 42.9% of listings. This highlights the market's preference for longer commitments.
- Very short stays (1-2 nights) are less common (17.0%), suggesting hosts prefer slightly longer bookings to optimize turnover.
- A significant segment (12.2%) caters to monthly stays (30+ nights) in Schœlcher, pointing to opportunities in the extended-stay market.
Recommendations
- Align with the market by considering a 4-6 Nights minimum stay, as 42.9% of Schœlcher hosts use this setting.
- If feasible, allowing 1-night stays, especially midweek or during low season, could capture last-minute bookings, as only 6.8% currently do.
- Explore offering discounts for stays of 30+ nights to attract the 12.2% of the market seeking extended stays.
- Adjust minimum nights based on seasonality – potentially shorter during low season and longer during peak demand periods in Schœlcher.
Schœlcher Airbnb Cancellation Policy Trends Analysis (2025)
Flexible
69 listings
40.4% of total
Moderate
42 listings
24.6% of total
Firm
24 listings
14% of total
Strict
36 listings
21.1% of total
Cancellation Policy Insights for Schœlcher
- The prevailing Airbnb cancellation policy trend in Schœlcher is Flexible, used by 40.4% of listings.
- There's a relatively balanced mix between guest-friendly (65.0%) and stricter (35.1%) policies, offering choices for different guest needs.
Recommendations for Hosts
- Consider adopting a Flexible policy to align with the 40.4% market standard in Schœlcher.
- Regularly review your cancellation policy against competitors and market demand shifts in Schœlcher.
Schœlcher STR Booking Lead Time Analysis (2025)
Average Booking Lead Time by Month
Booking Lead Time Insights for Schœlcher
- The overall average booking lead time for vacation rentals in Schœlcher is 58 days.
- Guests book furthest in advance for stays during January (average 86 days), likely coinciding with peak travel demand or local events.
- The shortest booking windows occur for stays in October (average 45 days), indicating more last-minute travel plans during this time.
- Seasonally, Winter (81 days avg.) sees the longest lead times, while Fall (49 days avg.) has the shortest, reflecting typical travel planning cycles.
Recommendations for Hosts
- Use the overall average lead time (58 days) as a baseline for your pricing and availability strategy in Schœlcher.
- For January stays, consider implementing length-of-stay discounts or slightly higher rates for bookings made less than 86 days out to capitalize on advance planning.
- Target marketing efforts for the Winter season well in advance (at least 81 days) to capture early planners.
- Monitor your own booking lead times against these Schœlcher averages to identify opportunities for dynamic pricing adjustments.
Popular & Essential Airbnb Amenities in Schœlcher (2025)
Amenity Prevalence
Amenity Insights for Schœlcher
- Essential amenities in Schœlcher that guests expect include: Wifi, Kitchen. Lacking these (any) could significantly impact bookings.
- Popular amenities like Air conditioning, TV, Essentials are common but not universal. Offering these can provide a competitive edge.
Recommendations for Hosts
- Ensure your listing includes all essential amenities for Schœlcher: Wifi, Kitchen.
- Prioritize adding missing essentials: Wifi, Kitchen.
- Consider adding popular differentiators like Air conditioning or TV to increase appeal.
- Highlight unique or less common amenities you offer (e.g., hot tub, dedicated workspace, EV charger) in your listing description and photos.
- Regularly check competitor amenities in Schœlcher to stay competitive.
Schœlcher Airbnb Guest Demographics & Profile Analysis (2025)
Guest Profile Summary for Schœlcher
- The typical guest profile for Airbnb in Schœlcher consists of a mix of domestic (61%) and international guests, often arriving from nearby Paris, typically belonging to the Post-2000s (Gen Z/Alpha) group (50%), primarily speaking French or English.
- Domestic travelers account for 60.6% of guests.
- Key international markets include France (60.6%) and Canada (10.9%).
- Top languages spoken are French (44.4%) followed by English (35.2%).
- A significant demographic segment is the Post-2000s (Gen Z/Alpha) group, representing 50% of guests.
Recommendations for Hosts
- Target domestic marketing efforts towards travelers from Paris and Montreal.
- Tailor amenities and listing descriptions to appeal to the dominant Post-2000s (Gen Z/Alpha) demographic (e.g., highlight fast WiFi, smart home features, local guides).
- Highlight unique local experiences or amenities relevant to the primary guest profile.
- Consider seasonal promotions aligned with peak travel times for key origin markets.
Nearby Short-Term Rental Market Comparison
How does the Schœlcher Airbnb market stack up against its neighbors? Compare key performance metrics like average monthly revenue, ADR, and occupancy rates in surrounding areas to understand the broader regional STR landscape.
| Market | Active Properties | Monthly Revenue | Daily Rate | Avg. Occupancy |
|---|---|---|---|---|
| Soufrière | 91 | $3,734 | $277.78 | 49% |
| Coolie Town | 85 | $3,636 | $405.80 | 43% |
| Cap Estate | 20 | $3,175 | $485.96 | 34% |
| Gros Islet | 77 | $3,147 | $393.72 | 43% |
| Pigeon Island | 40 | $2,947 | $352.84 | 41% |
| Belvedere | 18 | $2,817 | $233.01 | 54% |
| Woodford Hill | 14 | $2,376 | $183.26 | 42% |
| Rodney Bay | 213 | $2,198 | $211.03 | 43% |
| Piaye | 21 | $1,947 | $183.71 | 38% |
| Bois D'orange | 53 | $1,904 | $362.93 | 35% |