Saint-Pierre Airbnb Market Analysis 2025: Short Term Rental Data & Vacation Rental Statistics in Martinique, France
Is Airbnb profitable in Saint-Pierre in 2025? Explore comprehensive Airbnb analytics for Saint-Pierre, Martinique, France to uncover income potential. This 2025 STR market report for Saint-Pierre, based on AirROI data from April 2024 to March 2025, reveals key trends in the niche market of 78 active listings.
Whether you're considering an Airbnb investment in Saint-Pierre, optimizing your existing vacation rental, or exploring rental arbitrage opportunities, understanding the Saint-Pierre Airbnb data is crucial. Leveraging the low regulation environment is key to maximizing your short term rental income potential. Let's dive into the specifics.
Key Saint-Pierre Airbnb Performance Metrics Overview
Monthly Airbnb Revenue Variations & Income Potential in Saint-Pierre (2025)
Understanding the monthly revenue variations for Airbnb listings in Saint-Pierre is key to maximizing your short term rental income potential. Seasonality significantly impacts earnings. Our analysis, based on data from the past 12 months, shows that the peak revenue month for STRs in Saint-Pierre is typically April, while September often presents the lowest earnings, highlighting opportunities for strategic pricing adjustments during shoulder and low seasons. Explore the typical Airbnb income in Saint-Pierre across different performance tiers:
- Best-in-class properties (Top 10%) achieve $5,517+ monthly, often utilizing dynamic pricing and superior guest experiences.
- Strong performing properties (Top 25%) earn $3,120 or more, indicating effective management and desirable locations/amenities.
- Typical properties (Median) generate around $1,550 per month, representing the average market performance.
- Entry-level properties (Bottom 25%) see earnings around $756, often with potential for optimization.
Average Monthly Airbnb Earnings Trend in Saint-Pierre
Saint-Pierre Airbnb Occupancy Rate Trends (2025)
Maximize your bookings by understanding the Saint-Pierre STR occupancy trends. Seasonal demand shifts significantly influence how often properties are booked. Typically, Februarysees the highest demand (peak season occupancy), while September experiences the lowest (low season). Effective strategies, like adjusting minimum stays or offering promotions, can boost occupancy during slower periods. Here's how different property tiers perform in Saint-Pierre:
- Best-in-class properties (Top 10%) achieve 80%+ occupancy, indicating high desirability and potentially optimized availability.
- Strong performing properties (Top 25%) maintain 65% or higher occupancy, suggesting good market fit and guest satisfaction.
- Typical properties (Median) have an occupancy rate around 43%.
- Entry-level properties (Bottom 25%) average 22% occupancy, potentially facing higher vacancy.
Average Monthly Occupancy Rate Trend in Saint-Pierre
Average Daily Rate (ADR) Airbnb Trends in Saint-Pierre (2025)
Effective short term rental pricing strategy in Saint-Pierre involves understanding monthly ADR fluctuations. The Average Daily Rate (ADR) for Airbnb in Saint-Pierre typically peaks in July and dips lowest during November. Leveraging Airbnb dynamic pricing tools or strategies based on this seasonality can significantly boost revenue. Here's a look at the typical nightly rates achieved:
- Best-in-class properties (Top 10%) command rates of $383+ per night, often due to premium features or locations.
- Strong performing properties (Top 25%) achieve nightly rates of $176 or more.
- Typical properties (Median) charge around $108 per night.
- Entry-level properties (Bottom 25%) earn around $81 per night.
Average Daily Rate (ADR) Trend by Month in Saint-Pierre
Get Live Saint-Pierre Market Intelligence 👇

Explore Real-time Analytics
Airbnb Seasonality Analysis & Trends in Saint-Pierre (2025)
Peak Season (April, May, January)
- Revenue averages $3,081 per month
- Occupancy rates average 54.7%
- Daily rates average $179
Shoulder Season
- Revenue averages $2,429 per month
- Occupancy maintains around 46.7%
- Daily rates hold near $176
Low Season (September, October, November)
- Revenue drops to average $1,635 per month
- Occupancy decreases to average 30.6%
- Daily rates adjust to average $172
Seasonality Insights for Saint-Pierre
- The Airbnb seasonality in Saint-Pierre shows highly seasonal trends requiring careful strategy. While the sections above show seasonal averages, it's also insightful to look at the extremes:
- During the high season, the absolute peak month showcases Saint-Pierre's highest earning potential, with monthly revenues capable of climbing to $3,212, occupancy reaching a high of 61.5%, and ADRs peaking at $186.
- Conversely, the slowest single month of the year, typically falling within the low season, marks the market's lowest point. In this month, revenue might dip to $1,449, occupancy could drop to 25.6%, and ADRs may adjust down to $163.
- Understanding both the seasonal averages and these monthly peaks and troughs in revenue, occupancy, and ADR is crucial for maximizing your Airbnb profit potential in Saint-Pierre.
Seasonal Strategies for Maximizing Profit
- Peak Season: Maximize revenue through premium pricing and potentially longer minimum stays. Ensure high availability.
- Low Season: Offer competitive pricing, special promotions (e.g., extended stay discounts), and flexible cancellation policies. Target off-season travelers like remote workers or budget-conscious guests.
- Shoulder Seasons: Implement dynamic pricing that balances peak and low rates. Target weekend travelers or specific events. Offer slightly more flexible terms than peak season.
- Regularly analyze your own performance against these Saint-Pierre seasonality benchmarks and adjust your pricing and availability strategy accordingly.
Best Areas for Airbnb Investment in Saint-Pierre (2025)
Exploring the top neighborhoods for short-term rentals in Saint-Pierre? This section highlights key areas, outlining why they are attractive for hosts and guests, along with notable local attractions. Consider these locations based on your target guest profile and investment strategy.
| Neighborhood / Area | Why Host Here? (Target Guests & Appeal) | Key Attractions & Landmarks |
|---|---|---|
| Fort de France | The capital city of Martinique, great for cultural experiences, dining, and local markets. It serves as a hub for tourists and has historical significance, attracting visitors from all over. | La Savane Park, Fort Saint Louis, St. Louis Cathedral, Shopping in Fort de France, Musee Departemental de la Martinique |
| Les Trois-Îlets | A picturesque village known for its beautiful beaches and golf courses, ideal for tourists seeking relaxation and outdoor activities. It offers a variety of accommodations and is accessible by ferry from Fort de France. | Anse Mitan Beach, La Pagerie Museum, Golf de la Martinique, Les Bains de la Riviere Blanche, Historical Village |
| Saint-Pierre | Once the capital of Martinique, now a site of stunning natural beauty and historical ruins. A popular destination for those interested in history, hiking, and stunning waterfront views. | Ruins of Saint-Pierre, Mont Pelée, Cap 110, La Savane des Esclaves, Bourg de Saint-Pierre |
| Le Marin | Known for its marina and sailing community, Le Marin attracts boating enthusiasts and those looking to explore the Caribbean by sea. It has shops and restaurants catering to tourists and sailors alike. | Marina du Marin, La Trinité, Anse Caritan Beach, Snorkeling and diving spots, Local fish market |
| Sainte-Anne | Famous for its stunning beaches and vibrant Caribbean culture, this area is great for families and beach lovers. It offers wonderful culinary experiences and local art markets. | Plage des Salines, Anse Trabaud Beach, Sainte-Anne Market, Habitation Clement, Local craft shops |
| Grand'Rivière | Located in the north of Martinique, it is ideal for those seeking tranquility and nature. It's a great place for hiking and experiencing raw natural beauty. | Hiking in Northern Martinique, Birdwatching, Rivers and waterfalls, Local fish restaurants, Cultural experiences with local art |
| Le Diamant | Known for its beautiful beaches and the iconic Diamond Rock, it is a popular location for vacationers looking for a quieter beach experience with access to water sports. | Anse Diamant Beach, Diamond Rock, Local restaurants and bars, Water sports activities, Fishing trips |
| La Trinité | A quiet town on the eastern coast offering a blend of beach life and local culture. Ideal for visitors looking to explore everything local Martinique has to offer. | Anse des Sables, Cultural festivals, Local markets, Historical sites, Beachside dining |
Understanding Airbnb License Requirements & STR Laws in Saint-Pierre (2025)
While Saint-Pierre, Martinique, France currently shows low STR regulations, specific Airbnb license requirements might still exist or change. Always verify the latest short term rental regulations and Airbnb license requirements directly with local government authorities for Saint-Pierre to ensure full compliance before hosting.
(Source: AirROI data, 2025, finding no licensed listings among those analyzed)
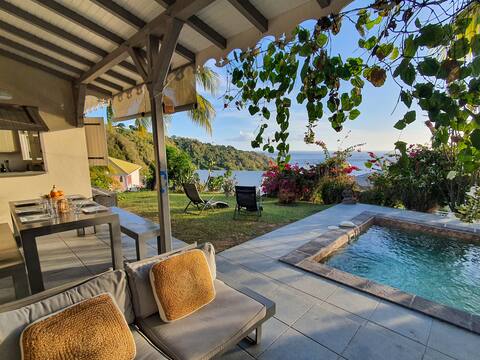
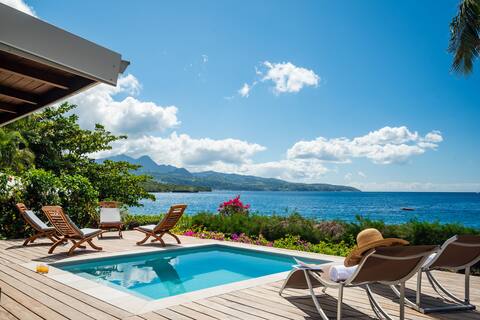
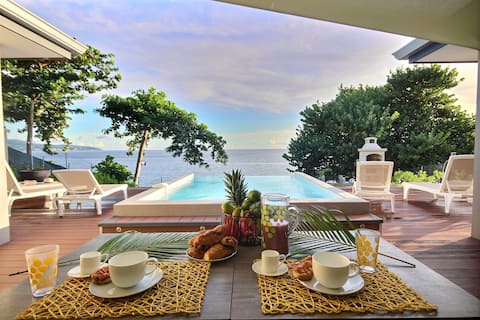
Top Performing Airbnb Properties in Saint-Pierre (2025)
Benchmark your potential! Explore examples of top-performing Airbnb properties in Saint-Pierrebased on Trailing Twelve Month (TTM) revenue. Analyze their characteristics, revenue, occupancy rate, and ADR to understand what drives success in this market.
Bungalow for 6 ppl. with sea view at Saint-Pierre
Entire Place • 3 bedrooms
Villa Baya.Villa by architect with your feet in the water
Entire Place • 2 bedrooms
Sea View Buddha Villa with Pool
Entire Place • 4 bedrooms
Peaceful villa on the beach : Little beach house
Entire Place • 5 bedrooms

Villa Nona St-Pierre Martinique
Entire Place • 5 bedrooms
Villa l 'Escale de Sainte Philomène
Entire Place • 3 bedrooms
Note: Performance varies based on location, size, amenities, seasonality, and management quality. Data reflects the past 12 months.
Top Performing Airbnb Hosts in Saint-Pierre (2025)
Learn from the best! This table showcases top-performing Airbnb hosts in Saint-Pierre based on the number of properties managed and estimated total revenue over the past year. Analyze their scale and performance metrics.
| Host Name | Properties | Grossing Revenue | Stay Reviews | Avg Rating |
|---|---|---|---|---|
| Romain Et Cyrielle | 5 | $242,309 | 89 | 3.69/5.0 |
| Benjamin | 2 | $145,662 | 124 | 4.82/5.0 |
| Marie | 3 | $100,073 | 264 | 4.90/5.0 |
| Host #432426623 | 1 | $89,394 | 2 | 0.00/5.0 |
| Anne Garlone | 1 | $88,737 | 55 | 4.93/5.0 |
| Syndra | 2 | $86,991 | 21 | 4.93/5.0 |
| Elisa | 1 | $74,605 | 33 | 4.88/5.0 |
| John | 3 | $55,216 | 94 | 4.60/5.0 |
| Karine | 6 | $50,514 | 213 | 4.84/5.0 |
| Olivier | 1 | $42,874 | 41 | 4.54/5.0 |
Analyzing the strategies of top hosts, such as their property selection, pricing, and guest communication, can offer valuable lessons for optimizing your own Airbnb operations in Saint-Pierre.
Dive Deeper: Advanced Saint-Pierre STR Market Data (2025)
Ready to unlock more insights? AirROI provides access to advanced metrics and comprehensive Airbnb data for Saint-Pierre. Explore detailed analytics beyond this report to refine your investment strategy, optimize pricing, and maximize your vacation rental profits.
Explore Advanced MetricsSaint-Pierre Short-Term Rental Market Composition (2025): Property & Room Types
Room Type Distribution
Property Type Distribution
Market Composition Insights for Saint-Pierre
- The Saint-Pierre Airbnb market composition is heavily skewed towards Entire Home/Apt listings, which make up 85.9% of the 78 active rentals. This indicates strong guest preference for privacy and space.
- Looking at the property type distribution in Saint-Pierre, House properties are the most common (66.7%), reflecting the local real estate landscape.
- Houses represent a significant 66.7% portion, catering likely to families or larger groups.
- The presence of 10.3% Hotel/Boutique listings indicates integration with traditional hospitality.
- Smaller segments like outdoor/unique (combined 2.6%) offer potential for unique stay experiences.
Saint-Pierre Airbnb Room Capacity Analysis (2025): Bedroom Distribution
Distribution of Listings by Number of Bedrooms
Room Capacity Insights for Saint-Pierre
- The dominant room capacity in Saint-Pierre is 1 bedroom listings, making up 33.3% of the market. This suggests a strong demand for properties suitable for couples or solo travelers.
- Together, 1 bedroom and 2 bedrooms properties represent 66.6% of the active Airbnb listings in Saint-Pierre, indicating a high concentration in these sizes.
- A significant 24.4% of listings offer 3+ bedrooms, catering to larger groups and families seeking more space in Saint-Pierre.
Saint-Pierre Vacation Rental Guest Capacity Trends (2025)
Distribution of Listings by Guest Capacity
Guest Capacity Insights for Saint-Pierre
- The most common guest capacity trend in Saint-Pierre vacation rentals is listings accommodating 4 guests (25.6%). This suggests the primary traveler segment is likely small families or groups.
- Properties designed for 4 guests and 2 guests dominate the Saint-Pierre STR market, accounting for 47.4% of listings.
- 30.7% of properties accommodate 6+ guests, serving the market segment for larger families or group travel in Saint-Pierre.
- On average, properties in Saint-Pierre are equipped to host 4.1 guests.
Saint-Pierre Airbnb Booking Patterns (2025): Available vs. Booked Days
Available Days Distribution
Booked Days Distribution
Booking Pattern Insights for Saint-Pierre
- The most common availability pattern in Saint-Pierre falls within the 181-270 days range, representing 44.9% of listings. This suggests many properties have significant open periods on their calendars.
- Approximately 79.5% of listings show high availability (181+ days open annually), indicating potential for increased bookings or specific owner usage patterns.
- For booked days, the 91-180 days range is most frequent in Saint-Pierre (41%), reflecting common guest stay durations or potential owner blocking patterns.
- A notable 25.6% of properties secure long booking periods (181+ days booked per year), highlighting successful long-term rental strategies or significant owner usage.
Saint-Pierre Airbnb Minimum Stay Requirements Analysis
Distribution of Listings by Minimum Night Requirement
1 Night
13 listings
17.8% of total
2 Nights
14 listings
19.2% of total
3 Nights
12 listings
16.4% of total
4-6 Nights
25 listings
34.2% of total
7-29 Nights
1 listings
1.4% of total
30+ Nights
8 listings
11% of total
Key Insights
- The most prevalent minimum stay requirement in Saint-Pierre is 4-6 Nights, adopted by 34.2% of listings. This highlights the market's preference for longer commitments.
- A significant segment (11%) caters to monthly stays (30+ nights) in Saint-Pierre, pointing to opportunities in the extended-stay market.
Recommendations
- Align with the market by considering a 4-6 Nights minimum stay, as 34.2% of Saint-Pierre hosts use this setting.
- If feasible, allowing 1-night stays, especially midweek or during low season, could capture last-minute bookings, as only 17.8% currently do.
- Explore offering discounts for stays of 30+ nights to attract the 11% of the market seeking extended stays.
- Adjust minimum nights based on seasonality – potentially shorter during low season and longer during peak demand periods in Saint-Pierre.
Saint-Pierre Airbnb Cancellation Policy Trends Analysis (2025)
Non-refundable
2 listings
3.1% of total
Flexible
23 listings
35.4% of total
Moderate
12 listings
18.5% of total
Firm
8 listings
12.3% of total
Strict
20 listings
30.8% of total
Cancellation Policy Insights for Saint-Pierre
- The prevailing Airbnb cancellation policy trend in Saint-Pierre is Flexible, used by 35.4% of listings.
- There's a relatively balanced mix between guest-friendly (53.9%) and stricter (43.1%) policies, offering choices for different guest needs.
Recommendations for Hosts
- Consider adopting a Flexible policy to align with the 35.4% market standard in Saint-Pierre.
- With 30.8% using Strict terms, this is a viable option in Saint-Pierre, particularly for high-value properties or during peak demand periods.
- Regularly review your cancellation policy against competitors and market demand shifts in Saint-Pierre.
Saint-Pierre STR Booking Lead Time Analysis (2025)
Average Booking Lead Time by Month
Booking Lead Time Insights for Saint-Pierre
- The overall average booking lead time for vacation rentals in Saint-Pierre is 68 days.
- Guests book furthest in advance for stays during February (average 90 days), likely coinciding with peak travel demand or local events.
- The shortest booking windows occur for stays in September (average 39 days), indicating more last-minute travel plans during this time.
- Seasonally, Winter (82 days avg.) sees the longest lead times, while Fall (63 days avg.) has the shortest, reflecting typical travel planning cycles.
Recommendations for Hosts
- Use the overall average lead time (68 days) as a baseline for your pricing and availability strategy in Saint-Pierre.
- For February stays, consider implementing length-of-stay discounts or slightly higher rates for bookings made less than 90 days out to capitalize on advance planning.
- Target marketing efforts for the Winter season well in advance (at least 82 days) to capture early planners.
- Monitor your own booking lead times against these Saint-Pierre averages to identify opportunities for dynamic pricing adjustments.
Popular & Essential Airbnb Amenities in Saint-Pierre (2025)
Amenity Prevalence
Amenity Insights for Saint-Pierre
- Popular amenities like Essentials, Wifi, Kitchen are common but not universal. Offering these can provide a competitive edge.
- Warning: Wifi is not universally provided but is considered essential globally. Ensure reliable Wifi is offered.
Recommendations for Hosts
- Consider adding popular differentiators like Essentials or Wifi to increase appeal.
- Highlight unique or less common amenities you offer (e.g., hot tub, dedicated workspace, EV charger) in your listing description and photos.
- Regularly check competitor amenities in Saint-Pierre to stay competitive.
Saint-Pierre Airbnb Guest Demographics & Profile Analysis (2025)
Guest Profile Summary for Saint-Pierre
- The typical guest profile for Airbnb in Saint-Pierre consists of a mix of domestic (64%) and international guests, often arriving from nearby Paris, typically belonging to the Post-2000s (Gen Z/Alpha) group (50%), primarily speaking French or English.
- Domestic travelers account for 64.0% of guests.
- Key international markets include France (64%) and Canada (13.6%).
- Top languages spoken are French (43.1%) followed by English (35.8%).
- A significant demographic segment is the Post-2000s (Gen Z/Alpha) group, representing 50% of guests.
Recommendations for Hosts
- Target domestic marketing efforts towards travelers from Paris and Montreal.
- Tailor amenities and listing descriptions to appeal to the dominant Post-2000s (Gen Z/Alpha) demographic (e.g., highlight fast WiFi, smart home features, local guides).
- Highlight unique local experiences or amenities relevant to the primary guest profile.
- Consider seasonal promotions aligned with peak travel times for key origin markets.
Nearby Short-Term Rental Market Comparison
How does the Saint-Pierre Airbnb market stack up against its neighbors? Compare key performance metrics like average monthly revenue, ADR, and occupancy rates in surrounding areas to understand the broader regional STR landscape.
| Market | Active Properties | Monthly Revenue | Daily Rate | Avg. Occupancy |
|---|---|---|---|---|
| Soufrière | 91 | $3,734 | $277.78 | 49% |
| Coolie Town | 85 | $3,636 | $405.80 | 43% |
| Cap Estate | 20 | $3,175 | $485.96 | 34% |
| Gros Islet | 77 | $3,147 | $393.72 | 43% |
| Pigeon Island | 40 | $2,947 | $352.84 | 41% |
| Belvedere | 18 | $2,817 | $233.01 | 54% |
| Woodford Hill | 14 | $2,376 | $183.26 | 42% |
| Rodney Bay | 213 | $2,198 | $211.03 | 43% |
| Piaye | 21 | $1,947 | $183.71 | 38% |
| Bois D'orange | 53 | $1,904 | $362.93 | 35% |