Les Trois-Îlets Airbnb Market Analysis 2025: Short Term Rental Data & Vacation Rental Statistics in Martinique, France
Is Airbnb profitable in Les Trois-Îlets in 2025? Explore comprehensive Airbnb analytics for Les Trois-Îlets, Martinique, France to uncover income potential. This 2025 STR market report for Les Trois-Îlets, based on AirROI data from April 2024 to March 2025, reveals key trends in the market of 853 active listings.
Whether you're considering an Airbnb investment in Les Trois-Îlets, optimizing your existing vacation rental, or exploring rental arbitrage opportunities, understanding the Les Trois-Îlets Airbnb data is crucial. Leveraging the low regulation environment is key to maximizing your short term rental income potential. Let's dive into the specifics.
Key Les Trois-Îlets Airbnb Performance Metrics Overview
Monthly Airbnb Revenue Variations & Income Potential in Les Trois-Îlets (2025)
Understanding the monthly revenue variations for Airbnb listings in Les Trois-Îlets is key to maximizing your short term rental income potential. Seasonality significantly impacts earnings. Our analysis, based on data from the past 12 months, shows that the peak revenue month for STRs in Les Trois-Îlets is typically January, while September often presents the lowest earnings, highlighting opportunities for strategic pricing adjustments during shoulder and low seasons. Explore the typical Airbnb income in Les Trois-Îlets across different performance tiers:
- Best-in-class properties (Top 10%) achieve $4,207+ monthly, often utilizing dynamic pricing and superior guest experiences.
- Strong performing properties (Top 25%) earn $2,546 or more, indicating effective management and desirable locations/amenities.
- Typical properties (Median) generate around $1,557 per month, representing the average market performance.
- Entry-level properties (Bottom 25%) see earnings around $804, often with potential for optimization.
Average Monthly Airbnb Earnings Trend in Les Trois-Îlets
Les Trois-Îlets Airbnb Occupancy Rate Trends (2025)
Maximize your bookings by understanding the Les Trois-Îlets STR occupancy trends. Seasonal demand shifts significantly influence how often properties are booked. Typically, Februarysees the highest demand (peak season occupancy), while June experiences the lowest (low season). Effective strategies, like adjusting minimum stays or offering promotions, can boost occupancy during slower periods. Here's how different property tiers perform in Les Trois-Îlets:
- Best-in-class properties (Top 10%) achieve 87%+ occupancy, indicating high desirability and potentially optimized availability.
- Strong performing properties (Top 25%) maintain 73% or higher occupancy, suggesting good market fit and guest satisfaction.
- Typical properties (Median) have an occupancy rate around 50%.
- Entry-level properties (Bottom 25%) average 25% occupancy, potentially facing higher vacancy.
Average Monthly Occupancy Rate Trend in Les Trois-Îlets
Average Daily Rate (ADR) Airbnb Trends in Les Trois-Îlets (2025)
Effective short term rental pricing strategy in Les Trois-Îlets involves understanding monthly ADR fluctuations. The Average Daily Rate (ADR) for Airbnb in Les Trois-Îlets typically peaks in February and dips lowest during September. Leveraging Airbnb dynamic pricing tools or strategies based on this seasonality can significantly boost revenue. Here's a look at the typical nightly rates achieved:
- Best-in-class properties (Top 10%) command rates of $245+ per night, often due to premium features or locations.
- Strong performing properties (Top 25%) achieve nightly rates of $147 or more.
- Typical properties (Median) charge around $96 per night.
- Entry-level properties (Bottom 25%) earn around $73 per night.
Average Daily Rate (ADR) Trend by Month in Les Trois-Îlets
Get Live Les Trois-Îlets Market Intelligence 👇

Explore Real-time Analytics
Airbnb Seasonality Analysis & Trends in Les Trois-Îlets (2025)
Peak Season (January, February, April)
- Revenue averages $2,691 per month
- Occupancy rates average 62.8%
- Daily rates average $139
Shoulder Season
- Revenue averages $1,998 per month
- Occupancy maintains around 47.9%
- Daily rates hold near $133
Low Season (June, September, October)
- Revenue drops to average $1,473 per month
- Occupancy decreases to average 36.0%
- Daily rates adjust to average $129
Seasonality Insights for Les Trois-Îlets
- The Airbnb seasonality in Les Trois-Îlets shows highly seasonal trends requiring careful strategy. While the sections above show seasonal averages, it's also insightful to look at the extremes:
- During the high season, the absolute peak month showcases Les Trois-Îlets's highest earning potential, with monthly revenues capable of climbing to $2,867, occupancy reaching a high of 69.5%, and ADRs peaking at $142.
- Conversely, the slowest single month of the year, typically falling within the low season, marks the market's lowest point. In this month, revenue might dip to $1,344, occupancy could drop to 35.4%, and ADRs may adjust down to $127.
- Understanding both the seasonal averages and these monthly peaks and troughs in revenue, occupancy, and ADR is crucial for maximizing your Airbnb profit potential in Les Trois-Îlets.
Seasonal Strategies for Maximizing Profit
- Peak Season: Maximize revenue through premium pricing and potentially longer minimum stays. Ensure high availability.
- Low Season: Offer competitive pricing, special promotions (e.g., extended stay discounts), and flexible cancellation policies. Target off-season travelers like remote workers or budget-conscious guests.
- Shoulder Seasons: Implement dynamic pricing that balances peak and low rates. Target weekend travelers or specific events. Offer slightly more flexible terms than peak season.
- Regularly analyze your own performance against these Les Trois-Îlets seasonality benchmarks and adjust your pricing and availability strategy accordingly.
Best Areas for Airbnb Investment in Les Trois-Îlets (2025)
Exploring the top neighborhoods for short-term rentals in Les Trois-Îlets? This section highlights key areas, outlining why they are attractive for hosts and guests, along with notable local attractions. Consider these locations based on your target guest profile and investment strategy.
| Neighborhood / Area | Why Host Here? (Target Guests & Appeal) | Key Attractions & Landmarks |
|---|---|---|
| Anse Mitan | A beautiful beach area with vibrant nightlife, excellent restaurants, and easy access to the ferry to Fort-de-France. It's a favorite spot for tourists seeking relaxation and entertainment. | Anse Mitan Beach, La Pagerie Golf Course, Aquarium de la Martinique, Restaurants and Bars, Ferry to Fort-de-France |
| Pointe du Bout | Known for its hotels, restaurants, and marina, this area is perfect for vacationers looking for a lively atmosphere with water sports and leisure activities. | Marina of Pointe du Bout, Casino Trois-Îlets, Beach Clubs, Scuba Diving and Snorkeling, Water Sports Activities |
| Les Trois-Îlets Center | The central area of Les Trois-Îlets offers local shops, markets, and cultural experiences. It attracts tourists interested in history and local culture. | Village de la Pêche, Museum of the Sea, Local Markets, Artisan Shops, Cultural Events |
| Anse à l'Ane | A quiet beach area ideal for families and travelers looking for a peaceful retreat with stunning views and access to water activities. | Anse à l'Ane Beach, Water Taxi Service to Fort-de-France, Kayaking and Paddleboarding, Dining with Ocean Views, Cozy Beachfront Accommodation |
| Sainte-Luce | A bit farther south, Sainte-Luce is known for its picturesque beaches and vibrant local culture, making it a great spot for both relaxation and exploration. | Anse Corps de Garde, Local Rum Distilleries, Beaches and Nature Trails, Marketplaces, Cultural Festivals |
| La Pointe des Nègres | This area offers stunning views of the Caribbean Sea and is perfect for those looking to escape the hustle and bustle for a serene environment. | Beaches with Calm Waters, Nature Walks, Fishing Spots, Local Dining, Sunset Viewing Areas |
| Cap Macré | Known for its beautiful landscapes and seclusion, Cap Macré is ideal for nature lovers and those seeking a peaceful getaway. | Cap Macré Beach, Hiking Trails, Tropical Flora and Fauna, Photography Spots, Local Fishing Villages |
| Fort de France (Nearby) | While not directly in Les Trois-Îlets, Fort de France offers cultural and historical experiences, museums, and shopping, making it an attractive addition for travelers staying nearby. | Schoelcher Library, Fort Saint-Louis, Local Markets, Cultural Institutions, Historic Sites |
Understanding Airbnb License Requirements & STR Laws in Les Trois-Îlets (2025)
While Les Trois-Îlets, Martinique, France currently shows low STR regulations, specific Airbnb license requirements might still exist or change. Always verify the latest short term rental regulations and Airbnb license requirements directly with local government authorities for Les Trois-Îlets to ensure full compliance before hosting.
(Source: AirROI data, 2025, finding no licensed listings among those analyzed)
Top Performing Airbnb Properties in Les Trois-Îlets (2025)
Benchmark your potential! Explore examples of top-performing Airbnb properties in Les Trois-Îletsbased on Trailing Twelve Month (TTM) revenue. Analyze their characteristics, revenue, occupancy rate, and ADR to understand what drives success in this market.
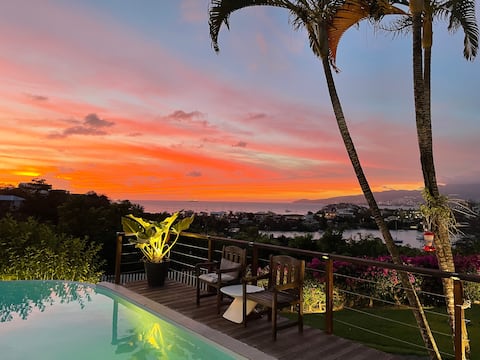
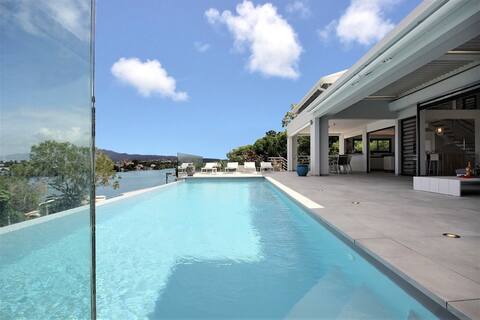
Villa de Luxe Perlane Bay sea view heated pool
Entire Place • 5 bedrooms

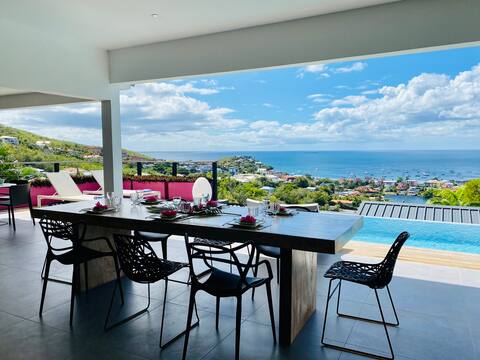
Hibiscus exceptional villa with breathtaking sea view
Entire Place • 4 bedrooms
Luxurious villa, heated pool, amazing views
Entire Place • 4 bedrooms
Exceptional Villa "3i" - Pool - Waterfront
Entire Place • 3 bedrooms
Résidence Belle Anse 10 Pers trois-ilets
Entire Place • 5 bedrooms
Villa Caouanne
Entire Place • 4 bedrooms
Note: Performance varies based on location, size, amenities, seasonality, and management quality. Data reflects the past 12 months.
Top Performing Airbnb Hosts in Les Trois-Îlets (2025)
Learn from the best! This table showcases top-performing Airbnb hosts in Les Trois-Îlets based on the number of properties managed and estimated total revenue over the past year. Analyze their scale and performance metrics.
| Host Name | Properties | Grossing Revenue | Stay Reviews | Avg Rating |
|---|---|---|---|---|
| Madikeys | 36 | $1,243,334 | 773 | 4.79/5.0 |
| Romain Et Cyrielle | 19 | $577,874 | 159 | 3.78/5.0 |
| Stephanie | 21 | $358,622 | 116 | 4.12/5.0 |
| Caraïbes Conciergerie | 18 | $322,722 | 221 | 3.73/5.0 |
| Host #106748255 | 7 | $181,759 | 2 | 0.00/5.0 |
| Melissa | 7 | $158,336 | 47 | 4.68/5.0 |
| Alain | 3 | $151,982 | 38 | 4.98/5.0 |
| Laure Martin | 1 | $150,569 | 36 | 4.97/5.0 |
| Christophe | 3 | $146,122 | 158 | 4.94/5.0 |
| Regis | 9 | $143,780 | 102 | 4.92/5.0 |
Analyzing the strategies of top hosts, such as their property selection, pricing, and guest communication, can offer valuable lessons for optimizing your own Airbnb operations in Les Trois-Îlets.
Dive Deeper: Advanced Les Trois-Îlets STR Market Data (2025)
Ready to unlock more insights? AirROI provides access to advanced metrics and comprehensive Airbnb data for Les Trois-Îlets. Explore detailed analytics beyond this report to refine your investment strategy, optimize pricing, and maximize your vacation rental profits.
Explore Advanced MetricsLes Trois-Îlets Short-Term Rental Market Composition (2025): Property & Room Types
Room Type Distribution
Property Type Distribution
Market Composition Insights for Les Trois-Îlets
- The Les Trois-Îlets Airbnb market composition is heavily skewed towards Entire Home/Apt listings, which make up 98.5% of the 853 active rentals. This indicates strong guest preference for privacy and space.
- Looking at the property type distribution in Les Trois-Îlets, Apartment/Condo properties are the most common (69.9%), reflecting the local real estate landscape.
- Houses represent a significant 28.6% portion, catering likely to families or larger groups.
- Smaller segments like others, hotel/boutique, outdoor/unique (combined 1.6%) offer potential for unique stay experiences.
Les Trois-Îlets Airbnb Room Capacity Analysis (2025): Bedroom Distribution
Distribution of Listings by Number of Bedrooms
Room Capacity Insights for Les Trois-Îlets
- The dominant room capacity in Les Trois-Îlets is 1 bedroom listings, making up 44.3% of the market. This suggests a strong demand for properties suitable for couples or solo travelers.
- Together, 1 bedroom and 2 bedrooms properties represent 73.7% of the active Airbnb listings in Les Trois-Îlets, indicating a high concentration in these sizes.
Les Trois-Îlets Vacation Rental Guest Capacity Trends (2025)
Distribution of Listings by Guest Capacity
Guest Capacity Insights for Les Trois-Îlets
- The most common guest capacity trend in Les Trois-Îlets vacation rentals is listings accommodating 4 guests (38.8%). This suggests the primary traveler segment is likely small families or groups.
- Properties designed for 4 guests and 2 guests dominate the Les Trois-Îlets STR market, accounting for 63.7% of listings.
- 22.5% of properties accommodate 6+ guests, serving the market segment for larger families or group travel in Les Trois-Îlets.
- On average, properties in Les Trois-Îlets are equipped to host 4.0 guests.
Les Trois-Îlets Airbnb Booking Patterns (2025): Available vs. Booked Days
Available Days Distribution
Booked Days Distribution
Booking Pattern Insights for Les Trois-Îlets
- The most common availability pattern in Les Trois-Îlets falls within the 271-366 days range, representing 43.4% of listings. This suggests many properties have significant open periods on their calendars.
- Approximately 72.5% of listings show high availability (181+ days open annually), indicating potential for increased bookings or specific owner usage patterns.
- For booked days, the 91-180 days range is most frequent in Les Trois-Îlets (29.5%), reflecting common guest stay durations or potential owner blocking patterns.
- A notable 28.4% of properties secure long booking periods (181+ days booked per year), highlighting successful long-term rental strategies or significant owner usage.
Les Trois-Îlets Airbnb Minimum Stay Requirements Analysis
Distribution of Listings by Minimum Night Requirement
1 Night
20 listings
2.5% of total
2 Nights
49 listings
6.1% of total
3 Nights
78 listings
9.7% of total
4-6 Nights
406 listings
50.5% of total
7-29 Nights
142 listings
17.7% of total
30+ Nights
109 listings
13.6% of total
Key Insights
- The most prevalent minimum stay requirement in Les Trois-Îlets is 4-6 Nights, adopted by 50.5% of listings. This highlights the market's preference for longer commitments.
- Very short stays (1-2 nights) are less common (8.6%), suggesting hosts prefer slightly longer bookings to optimize turnover.
- A significant segment (13.6%) caters to monthly stays (30+ nights) in Les Trois-Îlets, pointing to opportunities in the extended-stay market.
Recommendations
- Align with the market by considering a 4-6 Nights minimum stay, as 50.5% of Les Trois-Îlets hosts use this setting.
- If feasible, allowing 1-night stays, especially midweek or during low season, could capture last-minute bookings, as only 2.5% currently do.
- Explore offering discounts for stays of 30+ nights to attract the 13.6% of the market seeking extended stays.
- Adjust minimum nights based on seasonality – potentially shorter during low season and longer during peak demand periods in Les Trois-Îlets.
Les Trois-Îlets Airbnb Cancellation Policy Trends Analysis (2025)
Super Strict 60 Days
1 listings
0.1% of total
Super Strict 30 Days
5 listings
0.7% of total
Non-refundable
1 listings
0.1% of total
Flexible
170 listings
23.2% of total
Moderate
160 listings
21.9% of total
Firm
229 listings
31.3% of total
Strict
166 listings
22.7% of total
Cancellation Policy Insights for Les Trois-Îlets
- The prevailing Airbnb cancellation policy trend in Les Trois-Îlets is Firm, used by 31.3% of listings.
- A majority (54.0%) of hosts in Les Trois-Îlets utilize Firm or Strict policies, indicating a market where hosts prioritize booking security.
Recommendations for Hosts
- Consider adopting a Firm policy to align with the 31.3% market standard in Les Trois-Îlets.
- Regularly review your cancellation policy against competitors and market demand shifts in Les Trois-Îlets.
Les Trois-Îlets STR Booking Lead Time Analysis (2025)
Average Booking Lead Time by Month
Booking Lead Time Insights for Les Trois-Îlets
- The overall average booking lead time for vacation rentals in Les Trois-Îlets is 86 days.
- Guests book furthest in advance for stays during February (average 129 days), likely coinciding with peak travel demand or local events.
- The shortest booking windows occur for stays in June (average 66 days), indicating more last-minute travel plans during this time.
- Seasonally, Winter (114 days avg.) sees the longest lead times, while Fall (72 days avg.) has the shortest, reflecting typical travel planning cycles.
Recommendations for Hosts
- Use the overall average lead time (86 days) as a baseline for your pricing and availability strategy in Les Trois-Îlets.
- For February stays, consider implementing length-of-stay discounts or slightly higher rates for bookings made less than 129 days out to capitalize on advance planning.
- Target marketing efforts for the Winter season well in advance (at least 114 days) to capture early planners.
- Monitor your own booking lead times against these Les Trois-Îlets averages to identify opportunities for dynamic pricing adjustments.
Popular & Essential Airbnb Amenities in Les Trois-Îlets (2025)
Amenity Prevalence
Amenity Insights for Les Trois-Îlets
- Essential amenities in Les Trois-Îlets that guests expect include: Kitchen, Wifi, TV, Air conditioning. Lacking these (any) could significantly impact bookings.
- Popular amenities like Hot water, Essentials, Dishes and silverware are common but not universal. Offering these can provide a competitive edge.
Recommendations for Hosts
- Ensure your listing includes all essential amenities for Les Trois-Îlets: Kitchen, Wifi, TV, Air conditioning.
- Prioritize adding missing essentials: Kitchen, Wifi, TV, Air conditioning.
- Consider adding popular differentiators like Hot water or Essentials to increase appeal.
- Highlight unique or less common amenities you offer (e.g., hot tub, dedicated workspace, EV charger) in your listing description and photos.
- Regularly check competitor amenities in Les Trois-Îlets to stay competitive.
Les Trois-Îlets Airbnb Guest Demographics & Profile Analysis (2025)
Guest Profile Summary for Les Trois-Îlets
- The typical guest profile for Airbnb in Les Trois-Îlets consists of primarily domestic travelers (69%), often arriving from nearby Paris, typically belonging to the Post-2000s (Gen Z/Alpha) group (50%), primarily speaking French or English.
- Domestic travelers account for 69.3% of guests.
- Key international markets include France (69.3%) and Canada (14.7%).
- Top languages spoken are French (47.7%) followed by English (34.1%).
- A significant demographic segment is the Post-2000s (Gen Z/Alpha) group, representing 50% of guests.
Recommendations for Hosts
- Target domestic marketing efforts towards travelers from Paris and Montreal.
- Tailor amenities and listing descriptions to appeal to the dominant Post-2000s (Gen Z/Alpha) demographic (e.g., highlight fast WiFi, smart home features, local guides).
- Highlight unique local experiences or amenities relevant to the primary guest profile.
- Consider seasonal promotions aligned with peak travel times for key origin markets.
Nearby Short-Term Rental Market Comparison
How does the Les Trois-Îlets Airbnb market stack up against its neighbors? Compare key performance metrics like average monthly revenue, ADR, and occupancy rates in surrounding areas to understand the broader regional STR landscape.
| Market | Active Properties | Monthly Revenue | Daily Rate | Avg. Occupancy |
|---|---|---|---|---|
| Soufrière | 91 | $3,734 | $277.78 | 49% |
| Coolie Town | 85 | $3,636 | $405.80 | 43% |
| Cap Estate | 20 | $3,175 | $485.96 | 34% |
| Gros Islet | 77 | $3,147 | $393.72 | 43% |
| Pigeon Island | 40 | $2,947 | $352.84 | 41% |
| Belvedere | 18 | $2,817 | $233.01 | 54% |
| Woodford Hill | 14 | $2,376 | $183.26 | 42% |
| Rodney Bay | 213 | $2,198 | $211.03 | 43% |
| Piaye | 21 | $1,947 | $183.71 | 38% |
| Bois D'orange | 53 | $1,904 | $362.93 | 35% |