Le Morne-Rouge Airbnb Market Analysis 2025: Short Term Rental Data & Vacation Rental Statistics in Martinique, France
Is Airbnb profitable in Le Morne-Rouge in 2025? Explore comprehensive Airbnb analytics for Le Morne-Rouge, Martinique, France to uncover income potential. This 2025 STR market report for Le Morne-Rouge, based on AirROI data from April 2024 to March 2025, reveals key trends in the niche market of 30 active listings.
Whether you're considering an Airbnb investment in Le Morne-Rouge, optimizing your existing vacation rental, or exploring rental arbitrage opportunities, understanding the Le Morne-Rouge Airbnb data is crucial. Leveraging the low regulation environment is key to maximizing your short term rental income potential. Let's dive into the specifics.
Key Le Morne-Rouge Airbnb Performance Metrics Overview
Monthly Airbnb Revenue Variations & Income Potential in Le Morne-Rouge (2025)
Understanding the monthly revenue variations for Airbnb listings in Le Morne-Rouge is key to maximizing your short term rental income potential. Seasonality significantly impacts earnings. Our analysis, based on data from the past 12 months, shows that the peak revenue month for STRs in Le Morne-Rouge is typically April, while September often presents the lowest earnings, highlighting opportunities for strategic pricing adjustments during shoulder and low seasons. Explore the typical Airbnb income in Le Morne-Rouge across different performance tiers:
- Best-in-class properties (Top 10%) achieve $2,419+ monthly, often utilizing dynamic pricing and superior guest experiences.
- Strong performing properties (Top 25%) earn $1,698 or more, indicating effective management and desirable locations/amenities.
- Typical properties (Median) generate around $1,084 per month, representing the average market performance.
- Entry-level properties (Bottom 25%) see earnings around $597, often with potential for optimization.
Average Monthly Airbnb Earnings Trend in Le Morne-Rouge
Le Morne-Rouge Airbnb Occupancy Rate Trends (2025)
Maximize your bookings by understanding the Le Morne-Rouge STR occupancy trends. Seasonal demand shifts significantly influence how often properties are booked. Typically, Januarysees the highest demand (peak season occupancy), while September experiences the lowest (low season). Effective strategies, like adjusting minimum stays or offering promotions, can boost occupancy during slower periods. Here's how different property tiers perform in Le Morne-Rouge:
- Best-in-class properties (Top 10%) achieve 85%+ occupancy, indicating high desirability and potentially optimized availability.
- Strong performing properties (Top 25%) maintain 72% or higher occupancy, suggesting good market fit and guest satisfaction.
- Typical properties (Median) have an occupancy rate around 53%.
- Entry-level properties (Bottom 25%) average 28% occupancy, potentially facing higher vacancy.
Average Monthly Occupancy Rate Trend in Le Morne-Rouge
Average Daily Rate (ADR) Airbnb Trends in Le Morne-Rouge (2025)
Effective short term rental pricing strategy in Le Morne-Rouge involves understanding monthly ADR fluctuations. The Average Daily Rate (ADR) for Airbnb in Le Morne-Rouge typically peaks in January and dips lowest during May. Leveraging Airbnb dynamic pricing tools or strategies based on this seasonality can significantly boost revenue. Here's a look at the typical nightly rates achieved:
- Best-in-class properties (Top 10%) command rates of $116+ per night, often due to premium features or locations.
- Strong performing properties (Top 25%) achieve nightly rates of $86 or more.
- Typical properties (Median) charge around $61 per night.
- Entry-level properties (Bottom 25%) earn around $48 per night.
Average Daily Rate (ADR) Trend by Month in Le Morne-Rouge
Get Live Le Morne-Rouge Market Intelligence 👇

Explore Real-time Analytics
Airbnb Seasonality Analysis & Trends in Le Morne-Rouge (2025)
Peak Season (April, January, August)
- Revenue averages $1,488 per month
- Occupancy rates average 60.5%
- Daily rates average $71
Shoulder Season
- Revenue averages $1,310 per month
- Occupancy maintains around 52.2%
- Daily rates hold near $72
Low Season (September, October, November)
- Revenue drops to average $909 per month
- Occupancy decreases to average 41.7%
- Daily rates adjust to average $71
Seasonality Insights for Le Morne-Rouge
- The Airbnb seasonality in Le Morne-Rouge shows highly seasonal trends requiring careful strategy. While the sections above show seasonal averages, it's also insightful to look at the extremes:
- During the high season, the absolute peak month showcases Le Morne-Rouge's highest earning potential, with monthly revenues capable of climbing to $1,541, occupancy reaching a high of 62.6%, and ADRs peaking at $75.
- Conversely, the slowest single month of the year, typically falling within the low season, marks the market's lowest point. In this month, revenue might dip to $587, occupancy could drop to 30.7%, and ADRs may adjust down to $69.
- Understanding both the seasonal averages and these monthly peaks and troughs in revenue, occupancy, and ADR is crucial for maximizing your Airbnb profit potential in Le Morne-Rouge.
Seasonal Strategies for Maximizing Profit
- Peak Season: Maximize revenue through premium pricing and potentially longer minimum stays. Ensure high availability.
- Low Season: Offer competitive pricing, special promotions (e.g., extended stay discounts), and flexible cancellation policies. Target off-season travelers like remote workers or budget-conscious guests.
- Shoulder Seasons: Implement dynamic pricing that balances peak and low rates. Target weekend travelers or specific events. Offer slightly more flexible terms than peak season.
- Regularly analyze your own performance against these Le Morne-Rouge seasonality benchmarks and adjust your pricing and availability strategy accordingly.
Best Areas for Airbnb Investment in Le Morne-Rouge (2025)
Exploring the top neighborhoods for short-term rentals in Le Morne-Rouge? This section highlights key areas, outlining why they are attractive for hosts and guests, along with notable local attractions. Consider these locations based on your target guest profile and investment strategy.
| Neighborhood / Area | Why Host Here? (Target Guests & Appeal) | Key Attractions & Landmarks |
|---|---|---|
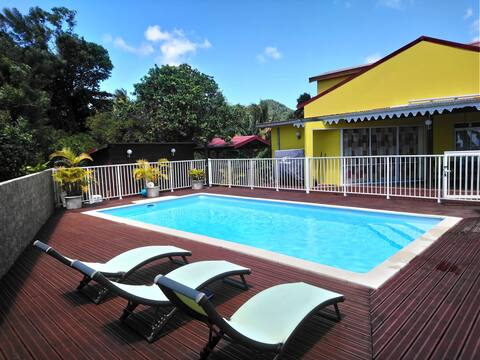
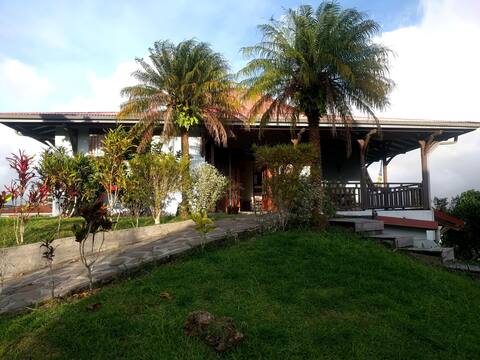
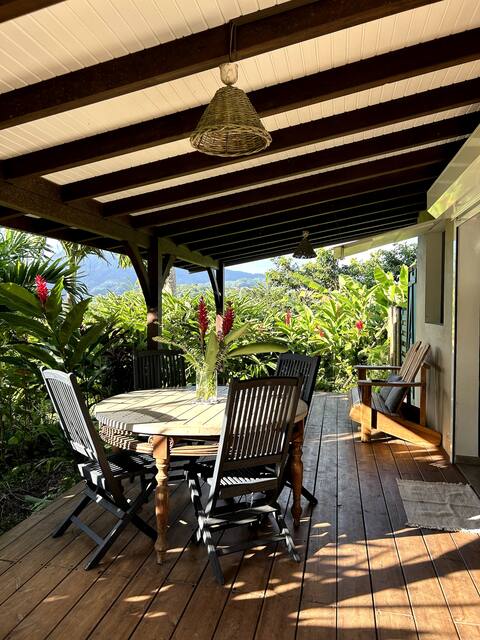
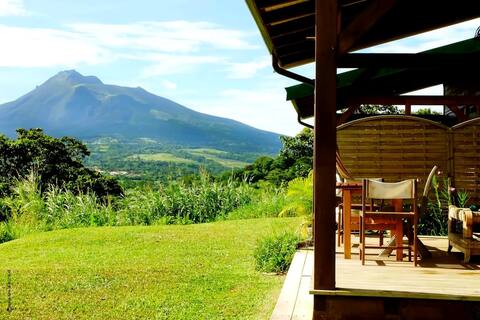
| Le Morne-Rouge | A lush, picturesque town located in the northern part of Martinique, known for its scenic views of Mount Pelée. It offers a tranquil atmosphere and is ideal for nature lovers and those looking for a secluded getaway. | Mont Pelée, Balata Gardens, Les Gorges de la Falaise, St. Lucia views, Anse Couleuvre, Cascades de la Barbotte |
| Saint-Pierre | Once the capital of Martinique, this coastal town is rich in history and offers stunning views of the Caribbean Sea. It attracts tourists interested in culture, history, and beautiful beaches. | Ruins of the Theatre, Saint-Pierre Bay, La Savane des Esclaves, César Monument, The Volcanological Museum |
| Fort-de-France | The capital of Martinique, known for its vibrant culture and bustling markets. It serves as a prime location for tourists looking for urban experiences along with historical and cultural attractions. | La Savane, Fort Saint-Louis, Bibliothèque Schoelcher, St. Louis Cathedral, Les Halles |
| Les Trois-Îlets | A popular tourist destination known for its beautiful beaches and watersports. Offers a range of accommodations and is ideal for families and beachgoers. | Anse Mitan, La Pointe du Bout, Tropic Aventura, Madinina Distillery |
| Sainte-Anne | Known for its stunning beaches and relaxing atmosphere, Sainte-Anne is perfect for families and beach lovers. It features beautiful sandy shores and warm waters. | Les Salines Beach, Plage de la Pointe Marin, Bourg de Sainte-Anne, Plage de l'Anse Caritan |
| Le Diamant | This coastal town is famous for its stunning beach and the Diamond Rock. It attracts tourists for its natural beauty and is suitable for water activities. | Diamond Beach, La Chaudière, Fort Choiseul, Le Rocher du Diamant |
| Sainte-Luce | A charming town with gorgeous beaches and a mix of cultural and natural attractions. Ideal for travelers wanting to enjoy both relaxation and exploration. | Anse Gros Raisins, Anse Figuier, La Maison du Bagnard, Domaine de Fonds Saint-Jacques |
| Carbet | Known for its beautiful landscapes and proximity to beaches, Carbet offers a peaceful atmosphere and is suited for nature lovers and tourists seeking tranquility. | Carbet Beach, Mangofil Martinique, Saint James Distillery, Eglise de Saint-Pierre |
Understanding Airbnb License Requirements & STR Laws in Le Morne-Rouge (2025)
While Le Morne-Rouge, Martinique, France currently shows low STR regulations, specific Airbnb license requirements might still exist or change. Always verify the latest short term rental regulations and Airbnb license requirements directly with local government authorities for Le Morne-Rouge to ensure full compliance before hosting.
(Source: AirROI data, 2025, finding no licensed listings among those analyzed)
Top Performing Airbnb Properties in Le Morne-Rouge (2025)
Benchmark your potential! Explore examples of top-performing Airbnb properties in Le Morne-Rougebased on Trailing Twelve Month (TTM) revenue. Analyze their characteristics, revenue, occupancy rate, and ADR to understand what drives success in this market.
Villa Rayon de Soleil
Entire Place • 3 bedrooms

"Dune de Sable" Villa
Entire Place • 3 bedrooms
Warm F4 house in a pleasant setting
Entire Place • 2 bedrooms

Small house in the garden of Mimi
Entire Place • 2 bedrooms
Pelee Mountain Bungalow - Les Atoumaux
Entire Place • 1 bedroom
The mountainside bungalow
Entire Place • 1 bedroom
Note: Performance varies based on location, size, amenities, seasonality, and management quality. Data reflects the past 12 months.
Top Performing Airbnb Hosts in Le Morne-Rouge (2025)
Learn from the best! This table showcases top-performing Airbnb hosts in Le Morne-Rouge based on the number of properties managed and estimated total revenue over the past year. Analyze their scale and performance metrics.
| Host Name | Properties | Grossing Revenue | Stay Reviews | Avg Rating |
|---|---|---|---|---|
| Meloica | 5 | $74,458 | 723 | 4.78/5.0 |
| Marie-Dominique | 2 | $64,210 | 254 | 4.89/5.0 |
| André | 5 | $47,309 | 502 | 4.34/5.0 |
| Bernard | 2 | $29,749 | 101 | 4.91/5.0 |
| Marie-Monique | 1 | $25,473 | 71 | 4.96/5.0 |
| Mimi Et Marcel | 1 | $21,654 | 33 | 4.76/5.0 |
| Marie Amélie | 1 | $21,300 | 195 | 4.89/5.0 |
| Willy | 1 | $19,520 | 29 | 5.00/5.0 |
| Host #204985970 | 1 | $15,499 | 13 | 5.00/5.0 |
| Patrick | 1 | $9,780 | 138 | 4.59/5.0 |
Analyzing the strategies of top hosts, such as their property selection, pricing, and guest communication, can offer valuable lessons for optimizing your own Airbnb operations in Le Morne-Rouge.
Dive Deeper: Advanced Le Morne-Rouge STR Market Data (2025)
Ready to unlock more insights? AirROI provides access to advanced metrics and comprehensive Airbnb data for Le Morne-Rouge. Explore detailed analytics beyond this report to refine your investment strategy, optimize pricing, and maximize your vacation rental profits.
Explore Advanced MetricsLe Morne-Rouge Short-Term Rental Market Composition (2025): Property & Room Types
Room Type Distribution
Property Type Distribution
Market Composition Insights for Le Morne-Rouge
- The Le Morne-Rouge Airbnb market composition is heavily skewed towards Entire Home/Apt listings, which make up 76.7% of the 30 active rentals. This indicates strong guest preference for privacy and space.
- Looking at the property type distribution in Le Morne-Rouge, House properties are the most common (66.7%), reflecting the local real estate landscape.
- Houses represent a significant 66.7% portion, catering likely to families or larger groups.
- The presence of 23.3% Hotel/Boutique listings indicates integration with traditional hospitality.
Le Morne-Rouge Airbnb Room Capacity Analysis (2025): Bedroom Distribution
Distribution of Listings by Number of Bedrooms
Room Capacity Insights for Le Morne-Rouge
- The dominant room capacity in Le Morne-Rouge is 2 bedrooms listings, making up 33.3% of the market. This suggests a strong demand for properties suitable for couples or solo travelers.
- Together, 2 bedrooms and 1 bedroom properties represent 56.6% of the active Airbnb listings in Le Morne-Rouge, indicating a high concentration in these sizes.
Le Morne-Rouge Vacation Rental Guest Capacity Trends (2025)
Distribution of Listings by Guest Capacity
Guest Capacity Insights for Le Morne-Rouge
- The most common guest capacity trend in Le Morne-Rouge vacation rentals is listings accommodating 4 guests (30%). This suggests the primary traveler segment is likely small families or groups.
- Properties designed for 4 guests and 6 guests dominate the Le Morne-Rouge STR market, accounting for 50.0% of listings.
- 20.0% of properties accommodate 6+ guests, serving the market segment for larger families or group travel in Le Morne-Rouge.
- On average, properties in Le Morne-Rouge are equipped to host 3.4 guests.
Le Morne-Rouge Airbnb Booking Patterns (2025): Available vs. Booked Days
Available Days Distribution
Booked Days Distribution
Booking Pattern Insights for Le Morne-Rouge
- The most common availability pattern in Le Morne-Rouge falls within the 271-366 days range, representing 33.3% of listings. This suggests many properties have significant open periods on their calendars.
- Approximately 53.3% of listings show high availability (181+ days open annually), indicating potential for increased bookings or specific owner usage patterns.
- For booked days, the 181-270 days range is most frequent in Le Morne-Rouge (33.3%), reflecting common guest stay durations or potential owner blocking patterns.
- A notable 46.6% of properties secure long booking periods (181+ days booked per year), highlighting successful long-term rental strategies or significant owner usage.
Le Morne-Rouge Airbnb Minimum Stay Requirements Analysis
Distribution of Listings by Minimum Night Requirement
1 Night
2 listings
7.4% of total
2 Nights
13 listings
48.1% of total
3 Nights
9 listings
33.3% of total
4-6 Nights
1 listings
3.7% of total
30+ Nights
2 listings
7.4% of total
Key Insights
- The most prevalent minimum stay requirement in Le Morne-Rouge is 2 Nights, adopted by 48.1% of listings. This highlights the market's preference for shorter, flexible bookings.
Recommendations
- Align with the market by considering a 2 Nights minimum stay, as 48.1% of Le Morne-Rouge hosts use this setting.
- If feasible, allowing 1-night stays, especially midweek or during low season, could capture last-minute bookings, as only 7.4% currently do.
- A 2-night minimum appears standard (48.1%). Consider this for weekends or peak periods.
- Explore offering discounts for stays of 30+ nights to attract the 7.4% of the market seeking extended stays.
- Adjust minimum nights based on seasonality – potentially shorter during low season and longer during peak demand periods in Le Morne-Rouge.
Le Morne-Rouge Airbnb Cancellation Policy Trends Analysis (2025)
Flexible
15 listings
55.6% of total
Moderate
6 listings
22.2% of total
Firm
5 listings
18.5% of total
Strict
1 listings
3.7% of total
Cancellation Policy Insights for Le Morne-Rouge
- The prevailing Airbnb cancellation policy trend in Le Morne-Rouge is Flexible, used by 55.6% of listings.
- The market strongly favors guest-friendly terms, with 77.8% of listings offering Flexible or Moderate policies. This suggests guests in Le Morne-Rouge may expect booking flexibility.
- Strict cancellation policies are quite rare (3.7%), potentially making listings with this policy less competitive unless justified by high demand or property type.
Recommendations for Hosts
- Consider adopting a Flexible policy to align with the 55.6% market standard in Le Morne-Rouge.
- Given the high prevalence of Flexible policies (55.6%), offering this can enhance booking appeal, especially during shoulder seasons.
- Using a Strict policy might deter some guests, as only 3.7% of listings use it. Evaluate if potential revenue protection outweighs possible lower booking rates.
- Regularly review your cancellation policy against competitors and market demand shifts in Le Morne-Rouge.
Le Morne-Rouge STR Booking Lead Time Analysis (2025)
Average Booking Lead Time by Month
Booking Lead Time Insights for Le Morne-Rouge
- The overall average booking lead time for vacation rentals in Le Morne-Rouge is 58 days.
- Guests book furthest in advance for stays during November (average 76 days), likely coinciding with peak travel demand or local events.
- The shortest booking windows occur for stays in May (average 51 days), indicating more last-minute travel plans during this time.
- Seasonally, Fall (68 days avg.) sees the longest lead times, while Summer (57 days avg.) has the shortest, reflecting typical travel planning cycles.
Recommendations for Hosts
- Use the overall average lead time (58 days) as a baseline for your pricing and availability strategy in Le Morne-Rouge.
- For November stays, consider implementing length-of-stay discounts or slightly higher rates for bookings made less than 76 days out to capitalize on advance planning.
- Target marketing efforts for the Fall season well in advance (at least 68 days) to capture early planners.
- Monitor your own booking lead times against these Le Morne-Rouge averages to identify opportunities for dynamic pricing adjustments.
Popular & Essential Airbnb Amenities in Le Morne-Rouge (2025)
Amenity Prevalence
Amenity Insights for Le Morne-Rouge
- Essential amenities in Le Morne-Rouge that guests expect include: Kitchen, Essentials. Lacking these (any) could significantly impact bookings.
- Popular amenities like Free parking on premises, Dishes and silverware, Cooking basics are common but not universal. Offering these can provide a competitive edge.
- Warning: Wifi is not universally provided but is considered essential globally. Ensure reliable Wifi is offered.
Recommendations for Hosts
- Ensure your listing includes all essential amenities for Le Morne-Rouge: Kitchen, Essentials.
- Prioritize adding missing essentials: Kitchen, Essentials.
- Consider adding popular differentiators like Free parking on premises or Dishes and silverware to increase appeal.
- Highlight unique or less common amenities you offer (e.g., hot tub, dedicated workspace, EV charger) in your listing description and photos.
- Regularly check competitor amenities in Le Morne-Rouge to stay competitive.
Le Morne-Rouge Airbnb Guest Demographics & Profile Analysis (2025)
Guest Profile Summary for Le Morne-Rouge
- The typical guest profile for Airbnb in Le Morne-Rouge consists of primarily domestic travelers (68%), often arriving from nearby Paris, typically belonging to the Post-2000s (Gen Z/Alpha) group (50%), primarily speaking French or English.
- Domestic travelers account for 68.1% of guests.
- Key international markets include France (68.1%) and Canada (9.2%).
- Top languages spoken are French (47.3%) followed by English (33.6%).
- A significant demographic segment is the Post-2000s (Gen Z/Alpha) group, representing 50% of guests.
Recommendations for Hosts
- Target domestic marketing efforts towards travelers from Paris and Lyon.
- Tailor amenities and listing descriptions to appeal to the dominant Post-2000s (Gen Z/Alpha) demographic (e.g., highlight fast WiFi, smart home features, local guides).
- Highlight unique local experiences or amenities relevant to the primary guest profile.
- Consider seasonal promotions aligned with peak travel times for key origin markets.
Nearby Short-Term Rental Market Comparison
How does the Le Morne-Rouge Airbnb market stack up against its neighbors? Compare key performance metrics like average monthly revenue, ADR, and occupancy rates in surrounding areas to understand the broader regional STR landscape.
| Market | Active Properties | Monthly Revenue | Daily Rate | Avg. Occupancy |
|---|---|---|---|---|
| Soufrière | 91 | $3,734 | $277.78 | 49% |
| Coolie Town | 85 | $3,636 | $405.80 | 43% |
| Cap Estate | 20 | $3,175 | $485.96 | 34% |
| Gros Islet | 77 | $3,147 | $393.72 | 43% |
| Pigeon Island | 40 | $2,947 | $352.84 | 41% |
| Belvedere | 18 | $2,817 | $233.01 | 54% |
| Woodford Hill | 14 | $2,376 | $183.26 | 42% |
| Rodney Bay | 213 | $2,198 | $211.03 | 43% |
| Piaye | 21 | $1,947 | $183.71 | 38% |
| Bois D'orange | 53 | $1,904 | $362.93 | 35% |