Le Carbet Airbnb Market Analysis 2025: Short Term Rental Data & Vacation Rental Statistics in Martinique, France
Is Airbnb profitable in Le Carbet in 2025? Explore comprehensive Airbnb analytics for Le Carbet, Martinique, France to uncover income potential. This 2025 STR market report for Le Carbet, based on AirROI data from April 2024 to March 2025, reveals key trends in the niche market of 143 active listings.
Whether you're considering an Airbnb investment in Le Carbet, optimizing your existing vacation rental, or exploring rental arbitrage opportunities, understanding the Le Carbet Airbnb data is crucial. Leveraging the low regulation environment is key to maximizing your short term rental income potential. Let's dive into the specifics.
Key Le Carbet Airbnb Performance Metrics Overview
Monthly Airbnb Revenue Variations & Income Potential in Le Carbet (2025)
Understanding the monthly revenue variations for Airbnb listings in Le Carbet is key to maximizing your short term rental income potential. Seasonality significantly impacts earnings. Our analysis, based on data from the past 12 months, shows that the peak revenue month for STRs in Le Carbet is typically January, while October often presents the lowest earnings, highlighting opportunities for strategic pricing adjustments during shoulder and low seasons. Explore the typical Airbnb income in Le Carbet across different performance tiers:
- Best-in-class properties (Top 10%) achieve $3,619+ monthly, often utilizing dynamic pricing and superior guest experiences.
- Strong performing properties (Top 25%) earn $2,366 or more, indicating effective management and desirable locations/amenities.
- Typical properties (Median) generate around $1,558 per month, representing the average market performance.
- Entry-level properties (Bottom 25%) see earnings around $807, often with potential for optimization.
Average Monthly Airbnb Earnings Trend in Le Carbet
Le Carbet Airbnb Occupancy Rate Trends (2025)
Maximize your bookings by understanding the Le Carbet STR occupancy trends. Seasonal demand shifts significantly influence how often properties are booked. Typically, Februarysees the highest demand (peak season occupancy), while October experiences the lowest (low season). Effective strategies, like adjusting minimum stays or offering promotions, can boost occupancy during slower periods. Here's how different property tiers perform in Le Carbet:
- Best-in-class properties (Top 10%) achieve 87%+ occupancy, indicating high desirability and potentially optimized availability.
- Strong performing properties (Top 25%) maintain 76% or higher occupancy, suggesting good market fit and guest satisfaction.
- Typical properties (Median) have an occupancy rate around 51%.
- Entry-level properties (Bottom 25%) average 26% occupancy, potentially facing higher vacancy.
Average Monthly Occupancy Rate Trend in Le Carbet
Average Daily Rate (ADR) Airbnb Trends in Le Carbet (2025)
Effective short term rental pricing strategy in Le Carbet involves understanding monthly ADR fluctuations. The Average Daily Rate (ADR) for Airbnb in Le Carbet typically peaks in November and dips lowest during September. Leveraging Airbnb dynamic pricing tools or strategies based on this seasonality can significantly boost revenue. Here's a look at the typical nightly rates achieved:
- Best-in-class properties (Top 10%) command rates of $210+ per night, often due to premium features or locations.
- Strong performing properties (Top 25%) achieve nightly rates of $135 or more.
- Typical properties (Median) charge around $89 per night.
- Entry-level properties (Bottom 25%) earn around $71 per night.
Average Daily Rate (ADR) Trend by Month in Le Carbet
Get Live Le Carbet Market Intelligence 👇

Explore Real-time Analytics
Airbnb Seasonality Analysis & Trends in Le Carbet (2025)
Peak Season (January, February, April)
- Revenue averages $2,280 per month
- Occupancy rates average 64.3%
- Daily rates average $141
Shoulder Season
- Revenue averages $1,803 per month
- Occupancy maintains around 48.4%
- Daily rates hold near $138
Low Season (September, October, November)
- Revenue drops to average $1,369 per month
- Occupancy decreases to average 42.4%
- Daily rates adjust to average $139
Seasonality Insights for Le Carbet
- The Airbnb seasonality in Le Carbet shows moderate seasonality with distinct peak and low periods. While the sections above show seasonal averages, it's also insightful to look at the extremes:
- During the high season, the absolute peak month showcases Le Carbet's highest earning potential, with monthly revenues capable of climbing to $2,395, occupancy reaching a high of 69.9%, and ADRs peaking at $152.
- Conversely, the slowest single month of the year, typically falling within the low season, marks the market's lowest point. In this month, revenue might dip to $1,270, occupancy could drop to 37.5%, and ADRs may adjust down to $133.
- Understanding both the seasonal averages and these monthly peaks and troughs in revenue, occupancy, and ADR is crucial for maximizing your Airbnb profit potential in Le Carbet.
Seasonal Strategies for Maximizing Profit
- Peak Season: Maximize revenue through premium pricing and potentially longer minimum stays. Ensure high availability.
- Low Season: Offer competitive pricing, special promotions (e.g., extended stay discounts), and flexible cancellation policies. Target off-season travelers like remote workers or budget-conscious guests.
- Shoulder Seasons: Implement dynamic pricing that balances peak and low rates. Target weekend travelers or specific events. Offer slightly more flexible terms than peak season.
- Regularly analyze your own performance against these Le Carbet seasonality benchmarks and adjust your pricing and availability strategy accordingly.
Best Areas for Airbnb Investment in Le Carbet (2025)
Exploring the top neighborhoods for short-term rentals in Le Carbet? This section highlights key areas, outlining why they are attractive for hosts and guests, along with notable local attractions. Consider these locations based on your target guest profile and investment strategy.
| Neighborhood / Area | Why Host Here? (Target Guests & Appeal) | Key Attractions & Landmarks |
|---|---|---|
| Le Carbet Beach | A beautiful and popular beach area that attracts tourists for its stunning views and water activities. Ideal for those seeking sun and relaxation near the Caribbean Sea. | Le Carbet Beach, Snorkeling excursions, Water sports rentals, Local beach bars and restaurants |
| Montagne Piché | A scenic area known for its nature trails and lush surroundings. Great for tourists looking to explore the natural beauty of Martinique. | Hiking trails, Bird watching, Local flora and fauna |
| Habitation Clément | A historic plantation and rum distillery that draws visitors interested in local culture and history. Ideal for cultural tourism. | Rum tasting tours, Historic buildings, Beautiful gardens |
| Anse Turin | A lesser-known beach spot perfect for those looking to escape the crowds and enjoy tranquility by the sea. Appeals to beach-combers and nature lovers. | Quiet beach area, Nearby hiking trails, Picnic spots |
| Fort Saint Louis | A historic site with charming views that attracts history enthusiasts and sightseers, making it a unique stay for guests interested in the past. | Fort Saint Louis tours, Scenic waterfront views, Historical exhibits |
| Centre Ville de Le Carbet | The town center with local shops, eateries, and cultural sites. Great for guests wanting to experience local life and cuisine. | Local markets, Restaurants serving Creole cuisine, Cultural events |
| Pointe des Châteaux | A picturesque viewpoint known for its breathtaking scenery. Ideal for picture-taking and nature appreciation. | Panoramic views, Birdwatching, Walking paths |
| Les Chutes du Carbet | Stunning waterfalls that attract adventure-seekers and nature enjoyment. A perfect place for hiking and exploring nature. | Hiking to waterfalls, Swimming spots, Scenic nature vistas |
Understanding Airbnb License Requirements & STR Laws in Le Carbet (2025)
While Le Carbet, Martinique, France currently shows low STR regulations, specific Airbnb license requirements might still exist or change. Always verify the latest short term rental regulations and Airbnb license requirements directly with local government authorities for Le Carbet to ensure full compliance before hosting.
(Source: AirROI data, 2025, finding no licensed listings among those analyzed)
Top Performing Airbnb Properties in Le Carbet (2025)
Benchmark your potential! Explore examples of top-performing Airbnb properties in Le Carbetbased on Trailing Twelve Month (TTM) revenue. Analyze their characteristics, revenue, occupancy rate, and ADR to understand what drives success in this market.

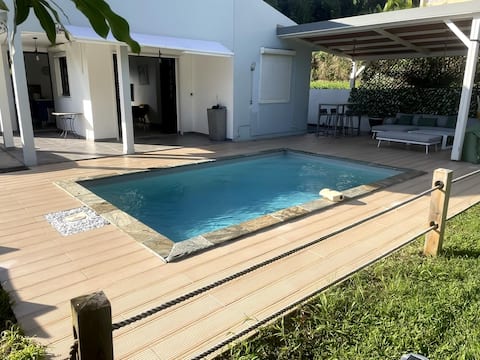
Large Creole villa with sea view and pelee
Entire Place • 4 bedrooms

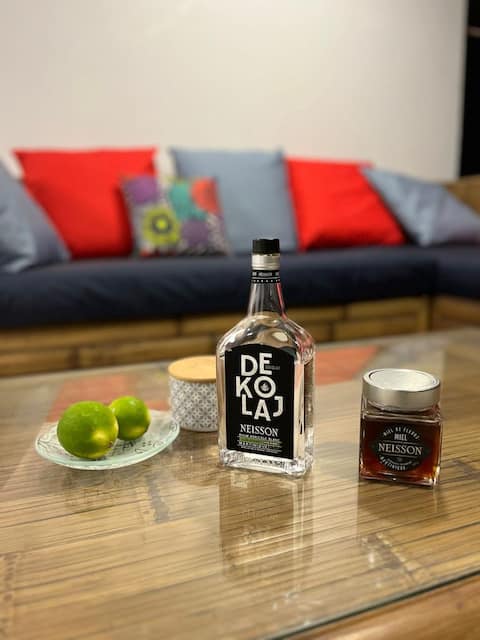
KAZ BEAUTIFUL SEA VIEW Carbet pool
Entire Place • 2 bedrooms
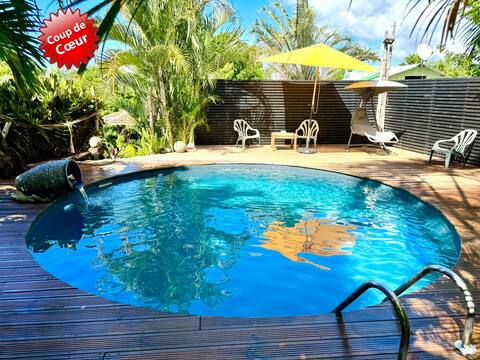
Villa LISA CARBET
Entire Place • 2 bedrooms
Villa OASIS
Entire Place • 3 bedrooms

LE FRANGIPANIER
Entire Place • 3 bedrooms
Grapefruit LODGE, Private Pool in Park
Entire Place • 1 bedroom
Note: Performance varies based on location, size, amenities, seasonality, and management quality. Data reflects the past 12 months.
Top Performing Airbnb Hosts in Le Carbet (2025)
Learn from the best! This table showcases top-performing Airbnb hosts in Le Carbet based on the number of properties managed and estimated total revenue over the past year. Analyze their scale and performance metrics.
| Host Name | Properties | Grossing Revenue | Stay Reviews | Avg Rating |
|---|---|---|---|---|
| Dina | 3 | $101,795 | 86 | 4.92/5.0 |
| André | 7 | $90,767 | 1122 | 4.34/5.0 |
| Jm | 3 | $90,020 | 23 | 3.21/5.0 |
| Thierry | 2 | $83,349 | 42 | 4.70/5.0 |
| Elise | 2 | $77,753 | 61 | 4.92/5.0 |
| Etienne | 1 | $76,612 | 16 | 4.81/5.0 |
| Cinthia | 2 | $69,624 | 58 | 4.63/5.0 |
| Dominique | 5 | $69,517 | 399 | 4.95/5.0 |
| Fiona | 2 | $64,500 | 51 | 4.96/5.0 |
| Lisa | 1 | $55,104 | 33 | 4.82/5.0 |
Analyzing the strategies of top hosts, such as their property selection, pricing, and guest communication, can offer valuable lessons for optimizing your own Airbnb operations in Le Carbet.
Dive Deeper: Advanced Le Carbet STR Market Data (2025)
Ready to unlock more insights? AirROI provides access to advanced metrics and comprehensive Airbnb data for Le Carbet. Explore detailed analytics beyond this report to refine your investment strategy, optimize pricing, and maximize your vacation rental profits.
Explore Advanced MetricsLe Carbet Short-Term Rental Market Composition (2025): Property & Room Types
Room Type Distribution
Property Type Distribution
Market Composition Insights for Le Carbet
- The Le Carbet Airbnb market composition is heavily skewed towards Entire Home/Apt listings, which make up 96.5% of the 143 active rentals. This indicates strong guest preference for privacy and space.
- Looking at the property type distribution in Le Carbet, House properties are the most common (54.5%), reflecting the local real estate landscape.
- Houses represent a significant 54.5% portion, catering likely to families or larger groups.
- Smaller segments like hotel/boutique, outdoor/unique, others (combined 4.9%) offer potential for unique stay experiences.
Le Carbet Airbnb Room Capacity Analysis (2025): Bedroom Distribution
Distribution of Listings by Number of Bedrooms
Room Capacity Insights for Le Carbet
- The dominant room capacity in Le Carbet is 1 bedroom listings, making up 42% of the market. This suggests a strong demand for properties suitable for couples or solo travelers.
- Together, 1 bedroom and 2 bedrooms properties represent 74.9% of the active Airbnb listings in Le Carbet, indicating a high concentration in these sizes.
Le Carbet Vacation Rental Guest Capacity Trends (2025)
Distribution of Listings by Guest Capacity
Guest Capacity Insights for Le Carbet
- The most common guest capacity trend in Le Carbet vacation rentals is listings accommodating 4 guests (32.2%). This suggests the primary traveler segment is likely small families or groups.
- Properties designed for 4 guests and 2 guests dominate the Le Carbet STR market, accounting for 58.8% of listings.
- 23.8% of properties accommodate 6+ guests, serving the market segment for larger families or group travel in Le Carbet.
- On average, properties in Le Carbet are equipped to host 4.0 guests.
Le Carbet Airbnb Booking Patterns (2025): Available vs. Booked Days
Available Days Distribution
Booked Days Distribution
Booking Pattern Insights for Le Carbet
- The most common availability pattern in Le Carbet falls within the 181-270 days range, representing 33.6% of listings. This suggests many properties have significant open periods on their calendars.
- Approximately 64.4% of listings show high availability (181+ days open annually), indicating potential for increased bookings or specific owner usage patterns.
- For booked days, the 91-180 days range is most frequent in Le Carbet (32.9%), reflecting common guest stay durations or potential owner blocking patterns.
- A notable 38.5% of properties secure long booking periods (181+ days booked per year), highlighting successful long-term rental strategies or significant owner usage.
Le Carbet Airbnb Minimum Stay Requirements Analysis
Distribution of Listings by Minimum Night Requirement
1 Night
10 listings
7.2% of total
2 Nights
19 listings
13.8% of total
3 Nights
21 listings
15.2% of total
4-6 Nights
62 listings
44.9% of total
7-29 Nights
9 listings
6.5% of total
30+ Nights
17 listings
12.3% of total
Key Insights
- The most prevalent minimum stay requirement in Le Carbet is 4-6 Nights, adopted by 44.9% of listings. This highlights the market's preference for longer commitments.
- A significant segment (12.3%) caters to monthly stays (30+ nights) in Le Carbet, pointing to opportunities in the extended-stay market.
Recommendations
- Align with the market by considering a 4-6 Nights minimum stay, as 44.9% of Le Carbet hosts use this setting.
- If feasible, allowing 1-night stays, especially midweek or during low season, could capture last-minute bookings, as only 7.2% currently do.
- Explore offering discounts for stays of 30+ nights to attract the 12.3% of the market seeking extended stays.
- Adjust minimum nights based on seasonality – potentially shorter during low season and longer during peak demand periods in Le Carbet.
Le Carbet Airbnb Cancellation Policy Trends Analysis (2025)
Flexible
55 listings
41.4% of total
Moderate
24 listings
18% of total
Firm
23 listings
17.3% of total
Strict
31 listings
23.3% of total
Cancellation Policy Insights for Le Carbet
- The prevailing Airbnb cancellation policy trend in Le Carbet is Flexible, used by 41.4% of listings.
- There's a relatively balanced mix between guest-friendly (59.4%) and stricter (40.6%) policies, offering choices for different guest needs.
Recommendations for Hosts
- Consider adopting a Flexible policy to align with the 41.4% market standard in Le Carbet.
- Regularly review your cancellation policy against competitors and market demand shifts in Le Carbet.
Le Carbet STR Booking Lead Time Analysis (2025)
Average Booking Lead Time by Month
Booking Lead Time Insights for Le Carbet
- The overall average booking lead time for vacation rentals in Le Carbet is 83 days.
- Guests book furthest in advance for stays during January (average 111 days), likely coinciding with peak travel demand or local events.
- The shortest booking windows occur for stays in September (average 49 days), indicating more last-minute travel plans during this time.
- Seasonally, Winter (99 days avg.) sees the longest lead times, while Fall (67 days avg.) has the shortest, reflecting typical travel planning cycles.
Recommendations for Hosts
- Use the overall average lead time (83 days) as a baseline for your pricing and availability strategy in Le Carbet.
- For January stays, consider implementing length-of-stay discounts or slightly higher rates for bookings made less than 111 days out to capitalize on advance planning.
- Target marketing efforts for the Winter season well in advance (at least 99 days) to capture early planners.
- Monitor your own booking lead times against these Le Carbet averages to identify opportunities for dynamic pricing adjustments.
Popular & Essential Airbnb Amenities in Le Carbet (2025)
Amenity Prevalence
Amenity Insights for Le Carbet
- Essential amenities in Le Carbet that guests expect include: Kitchen, Wifi. Lacking these (any) could significantly impact bookings.
- Popular amenities like Essentials, Hot water, Free parking on premises are common but not universal. Offering these can provide a competitive edge.
Recommendations for Hosts
- Ensure your listing includes all essential amenities for Le Carbet: Kitchen, Wifi.
- Prioritize adding missing essentials: Kitchen, Wifi.
- Consider adding popular differentiators like Essentials or Hot water to increase appeal.
- Highlight unique or less common amenities you offer (e.g., hot tub, dedicated workspace, EV charger) in your listing description and photos.
- Regularly check competitor amenities in Le Carbet to stay competitive.
Le Carbet Airbnb Guest Demographics & Profile Analysis (2025)
Guest Profile Summary for Le Carbet
- The typical guest profile for Airbnb in Le Carbet consists of primarily domestic travelers (70%), often arriving from nearby Paris, typically belonging to the Post-2000s (Gen Z/Alpha) group (50%), primarily speaking French or English.
- Domestic travelers account for 69.9% of guests.
- Key international markets include France (69.9%) and Canada (11.6%).
- Top languages spoken are French (46.1%) followed by English (34.3%).
- A significant demographic segment is the Post-2000s (Gen Z/Alpha) group, representing 50% of guests.
Recommendations for Hosts
- Target domestic marketing efforts towards travelers from Paris and Montreal.
- Tailor amenities and listing descriptions to appeal to the dominant Post-2000s (Gen Z/Alpha) demographic (e.g., highlight fast WiFi, smart home features, local guides).
- Highlight unique local experiences or amenities relevant to the primary guest profile.
- Consider seasonal promotions aligned with peak travel times for key origin markets.
Nearby Short-Term Rental Market Comparison
How does the Le Carbet Airbnb market stack up against its neighbors? Compare key performance metrics like average monthly revenue, ADR, and occupancy rates in surrounding areas to understand the broader regional STR landscape.
| Market | Active Properties | Monthly Revenue | Daily Rate | Avg. Occupancy |
|---|---|---|---|---|
| Soufrière | 91 | $3,734 | $277.78 | 49% |
| Coolie Town | 85 | $3,636 | $405.80 | 43% |
| Cap Estate | 20 | $3,175 | $485.96 | 34% |
| Gros Islet | 77 | $3,147 | $393.72 | 43% |
| Pigeon Island | 40 | $2,947 | $352.84 | 41% |
| Belvedere | 18 | $2,817 | $233.01 | 54% |
| Woodford Hill | 14 | $2,376 | $183.26 | 42% |
| Rodney Bay | 213 | $2,198 | $211.03 | 43% |
| Piaye | 21 | $1,947 | $183.71 | 38% |
| Bois D'orange | 53 | $1,904 | $362.93 | 35% |