Villepinte Airbnb Market Analysis 2025: Short Term Rental Data & Vacation Rental Statistics in Ile-de-France, France
Is Airbnb profitable in Villepinte in 2025? Explore comprehensive Airbnb analytics for Villepinte, Ile-de-France, France to uncover income potential. This 2025 STR market report for Villepinte, based on AirROI data from April 2024 to March 2025, reveals key trends in the niche market of 129 active listings.
Whether you're considering an Airbnb investment in Villepinte, optimizing your existing vacation rental, or exploring rental arbitrage opportunities, understanding the Villepinte Airbnb data is crucial. Leveraging the low regulation environment is key to maximizing your short term rental income potential. Let's dive into the specifics.
Key Villepinte Airbnb Performance Metrics Overview
Monthly Airbnb Revenue Variations & Income Potential in Villepinte (2025)
Understanding the monthly revenue variations for Airbnb listings in Villepinte is key to maximizing your short term rental income potential. Seasonality significantly impacts earnings. Our analysis, based on data from the past 12 months, shows that the peak revenue month for STRs in Villepinte is typically May, while February often presents the lowest earnings, highlighting opportunities for strategic pricing adjustments during shoulder and low seasons. Explore the typical Airbnb income in Villepinte across different performance tiers:
- Best-in-class properties (Top 10%) achieve $3,456+ monthly, often utilizing dynamic pricing and superior guest experiences.
- Strong performing properties (Top 25%) earn $2,121 or more, indicating effective management and desirable locations/amenities.
- Typical properties (Median) generate around $1,210 per month, representing the average market performance.
- Entry-level properties (Bottom 25%) see earnings around $585, often with potential for optimization.
Average Monthly Airbnb Earnings Trend in Villepinte
Villepinte Airbnb Occupancy Rate Trends (2025)
Maximize your bookings by understanding the Villepinte STR occupancy trends. Seasonal demand shifts significantly influence how often properties are booked. Typically, Aprilsees the highest demand (peak season occupancy), while March experiences the lowest (low season). Effective strategies, like adjusting minimum stays or offering promotions, can boost occupancy during slower periods. Here's how different property tiers perform in Villepinte:
- Best-in-class properties (Top 10%) achieve 76%+ occupancy, indicating high desirability and potentially optimized availability.
- Strong performing properties (Top 25%) maintain 58% or higher occupancy, suggesting good market fit and guest satisfaction.
- Typical properties (Median) have an occupancy rate around 37%.
- Entry-level properties (Bottom 25%) average 20% occupancy, potentially facing higher vacancy.
Average Monthly Occupancy Rate Trend in Villepinte
Average Daily Rate (ADR) Airbnb Trends in Villepinte (2025)
Effective short term rental pricing strategy in Villepinte involves understanding monthly ADR fluctuations. The Average Daily Rate (ADR) for Airbnb in Villepinte typically peaks in August and dips lowest during February. Leveraging Airbnb dynamic pricing tools or strategies based on this seasonality can significantly boost revenue. Here's a look at the typical nightly rates achieved:
- Best-in-class properties (Top 10%) command rates of $214+ per night, often due to premium features or locations.
- Strong performing properties (Top 25%) achieve nightly rates of $133 or more.
- Typical properties (Median) charge around $87 per night.
- Entry-level properties (Bottom 25%) earn around $61 per night.
Average Daily Rate (ADR) Trend by Month in Villepinte
Get Live Villepinte Market Intelligence 👇

Explore Real-time Analytics
Airbnb Seasonality Analysis & Trends in Villepinte (2025)
Peak Season (May, April, June)
- Revenue averages $2,564 per month
- Occupancy rates average 43.8%
- Daily rates average $116
Shoulder Season
- Revenue averages $1,435 per month
- Occupancy maintains around 40.8%
- Daily rates hold near $115
Low Season (February, March, November)
- Revenue drops to average $1,000 per month
- Occupancy decreases to average 35.1%
- Daily rates adjust to average $103
Seasonality Insights for Villepinte
- The Airbnb seasonality in Villepinte shows highly seasonal trends requiring careful strategy. While the sections above show seasonal averages, it's also insightful to look at the extremes:
- During the high season, the absolute peak month showcases Villepinte's highest earning potential, with monthly revenues capable of climbing to $2,647, occupancy reaching a high of 48.5%, and ADRs peaking at $130.
- Conversely, the slowest single month of the year, typically falling within the low season, marks the market's lowest point. In this month, revenue might dip to $975, occupancy could drop to 34.1%, and ADRs may adjust down to $99.
- Understanding both the seasonal averages and these monthly peaks and troughs in revenue, occupancy, and ADR is crucial for maximizing your Airbnb profit potential in Villepinte.
Seasonal Strategies for Maximizing Profit
- Peak Season: Maximize revenue through premium pricing and potentially longer minimum stays. Ensure high availability.
- Low Season: Offer competitive pricing, special promotions (e.g., extended stay discounts), and flexible cancellation policies. Target off-season travelers like remote workers or budget-conscious guests.
- Shoulder Seasons: Implement dynamic pricing that balances peak and low rates. Target weekend travelers or specific events. Offer slightly more flexible terms than peak season.
- Regularly analyze your own performance against these Villepinte seasonality benchmarks and adjust your pricing and availability strategy accordingly.
Best Areas for Airbnb Investment in Villepinte (2025)
Exploring the top neighborhoods for short-term rentals in Villepinte? This section highlights key areas, outlining why they are attractive for hosts and guests, along with notable local attractions. Consider these locations based on your target guest profile and investment strategy.
| Neighborhood / Area | Why Host Here? (Target Guests & Appeal) | Key Attractions & Landmarks |
|---|---|---|
| City Center | The heart of Villepinte, offering easy access to public transport and local amenities. Ideal for travelers who want to explore the city and surrounding areas. | Parc de la Courneuve, Aéroville Shopping Center, Parc Georges-Valbon, Cité des Sciences et de l'Industrie, Musee de l'Air et de l'Espace |
| Parc des Expositions | Close to the exhibition center, this area attracts business travelers and attendees of various events. Excellent for short-term rentals for visitors attending trade shows. | Parc des Expositions de Villepinte, Stade de France, Paris Nord Villepinte, Centre Commercial Aéroville |
| Rive Droite | A residential area with local charm and proximity to nature, perfect for families looking for a quieter atmosphere while still being close to Paris. | Canal de l'Ourcq, Parks and recreational areas, Local markets and shops, Cultural festivals in summer |
| Cesson | A suburban area with good transport links to Paris, attracting tourists wanting a more local experience while still being close to the city. | Lac de Cesson, Local parks, Architectural sights, Nearby shopping facilities |
| Montfermeil | Known for its historical sites and natural parks, offering a diverse range of activities for families and couples. | Parc Jean Valjean, Abbatiale Saint-Pierre, Musee de l'Air et de l'Espace, Domaine de Dangu |
| Sevran | A growing area with affordable housing options, appealing to budget travelers or long-term guests who need easy access to Paris. | Sevran-Livry train station, Parc de la Noue, Local shops, Cafes and restaurants |
| Tremblay-en-France | Features parks and is close to important transportation links, making it appealing for holiday rentals for families and travelers seeking relaxation. | Parc du Sausset, Golf de Gonesse, Parc d'Ingénierie |
| Aulnay-sous-Bois | A dynamic suburb with good public transport options to central Paris, ideal for tourists looking for budget-friendly accommodation away from the tourist traps. | Parc de la Poudrerie, Cultural venues, Shopping centers, Historic sites |
Understanding Airbnb License Requirements & STR Laws in Villepinte (2025)
While Villepinte, Ile-de-France, France currently shows low STR regulations, specific Airbnb license requirements might still exist or change. Always verify the latest short term rental regulations and Airbnb license requirements directly with local government authorities for Villepinte to ensure full compliance before hosting.
(Source: AirROI data, 2025, based on 1% licensed listings)
Top Performing Airbnb Properties in Villepinte (2025)
Benchmark your potential! Explore examples of top-performing Airbnb properties in Villepintebased on Trailing Twelve Month (TTM) revenue. Analyze their characteristics, revenue, occupancy rate, and ADR to understand what drives success in this market.
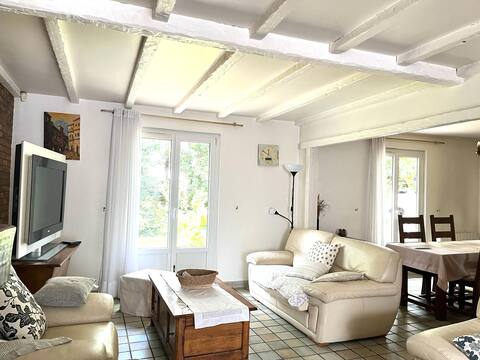
Un Havre de Paix
Entire Place • 5 bedrooms
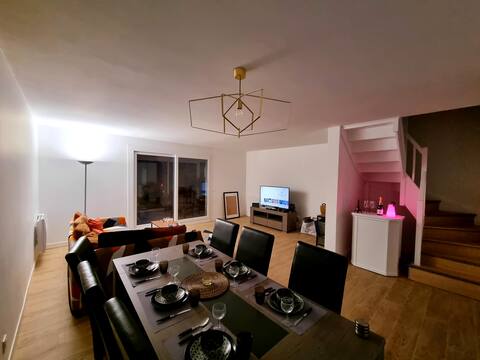
Warm Home
Entire Place • 4 bedrooms
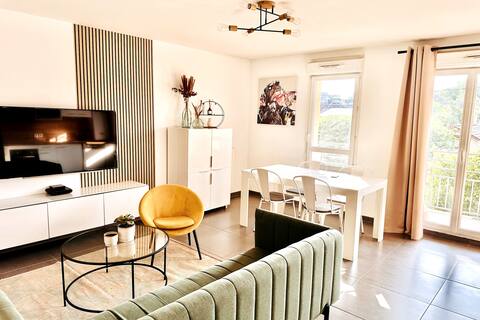
Wonderful 4 person apartment/Free parking
Entire Place • 2 bedrooms
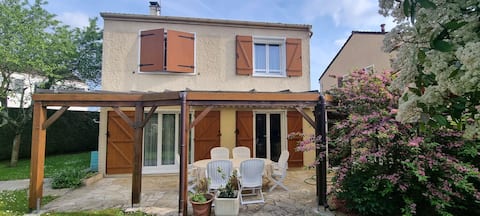
Country house 20 minutes from Paris
Entire Place • 3 bedrooms
apartment haut standing -CDG-DISNEY-PARIS
Entire Place • 4 bedrooms
The warm getaway Paris,Stade de France, CDG
Entire Place • 2 bedrooms
Note: Performance varies based on location, size, amenities, seasonality, and management quality. Data reflects the past 12 months.
Top Performing Airbnb Hosts in Villepinte (2025)
Learn from the best! This table showcases top-performing Airbnb hosts in Villepinte based on the number of properties managed and estimated total revenue over the past year. Analyze their scale and performance metrics.
| Host Name | Properties | Grossing Revenue | Stay Reviews | Avg Rating |
|---|---|---|---|---|
| Ghozel | 3 | $156,561 | 281 | 4.82/5.0 |
| William | 9 | $114,769 | 514 | 4.58/5.0 |
| Yann | 2 | $58,159 | 175 | 4.63/5.0 |
| Céline | 3 | $51,357 | 238 | 4.89/5.0 |
| Hafid | 2 | $49,854 | 41 | 2.48/5.0 |
| Sophie | 1 | $44,755 | 8 | 5.00/5.0 |
| Anissa | 2 | $41,806 | 163 | 4.87/5.0 |
| Sheherazade | 1 | $39,987 | 79 | 4.77/5.0 |
| Rafik | 2 | $36,940 | 100 | 4.89/5.0 |
| Michel | 1 | $35,575 | 88 | 4.81/5.0 |
Analyzing the strategies of top hosts, such as their property selection, pricing, and guest communication, can offer valuable lessons for optimizing your own Airbnb operations in Villepinte.
Dive Deeper: Advanced Villepinte STR Market Data (2025)
Ready to unlock more insights? AirROI provides access to advanced metrics and comprehensive Airbnb data for Villepinte. Explore detailed analytics beyond this report to refine your investment strategy, optimize pricing, and maximize your vacation rental profits.
Explore Advanced MetricsVillepinte Short-Term Rental Market Composition (2025): Property & Room Types
Room Type Distribution
Property Type Distribution
Market Composition Insights for Villepinte
- The Villepinte Airbnb market composition is heavily skewed towards Entire Home/Apt listings, which make up 80.6% of the 129 active rentals. This indicates strong guest preference for privacy and space.
- Looking at the property type distribution in Villepinte, Apartment/Condo properties are the most common (65.9%), reflecting the local real estate landscape.
- Houses represent a significant 29.5% portion, catering likely to families or larger groups.
- Smaller segments like hotel/boutique, others (combined 4.7%) offer potential for unique stay experiences.
Villepinte Airbnb Room Capacity Analysis (2025): Bedroom Distribution
Distribution of Listings by Number of Bedrooms
Room Capacity Insights for Villepinte
- The dominant room capacity in Villepinte is 1 bedroom listings, making up 52.7% of the market. This suggests a strong demand for properties suitable for couples or solo travelers.
- Together, 1 bedroom and 2 bedrooms properties represent 67.4% of the active Airbnb listings in Villepinte, indicating a high concentration in these sizes.
- With over half the market (52.7%) consisting of studios or 1-bedroom units, Villepinte is particularly well-suited for individuals or couples.
Villepinte Vacation Rental Guest Capacity Trends (2025)
Distribution of Listings by Guest Capacity
Guest Capacity Insights for Villepinte
- The most common guest capacity trend in Villepinte vacation rentals is listings accommodating 2 guests (32.6%). This suggests the primary traveler segment is likely couples or solo travelers.
- Properties designed for 2 guests and 4 guests dominate the Villepinte STR market, accounting for 55.1% of listings.
- 15.5% of properties accommodate 6+ guests, serving the market segment for larger families or group travel in Villepinte.
- On average, properties in Villepinte are equipped to host 3.1 guests.
Villepinte Airbnb Booking Patterns (2025): Available vs. Booked Days
Available Days Distribution
Booked Days Distribution
Booking Pattern Insights for Villepinte
- The most common availability pattern in Villepinte falls within the 271-366 days range, representing 47.3% of listings. This suggests many properties have significant open periods on their calendars.
- Approximately 77.5% of listings show high availability (181+ days open annually), indicating potential for increased bookings or specific owner usage patterns.
- For booked days, the 91-180 days range is most frequent in Villepinte (30.2%), reflecting common guest stay durations or potential owner blocking patterns.
- A notable 23.3% of properties secure long booking periods (181+ days booked per year), highlighting successful long-term rental strategies or significant owner usage.
Villepinte Airbnb Minimum Stay Requirements Analysis
Distribution of Listings by Minimum Night Requirement
1 Night
53 listings
45.7% of total
2 Nights
37 listings
31.9% of total
3 Nights
8 listings
6.9% of total
4-6 Nights
6 listings
5.2% of total
7-29 Nights
4 listings
3.4% of total
30+ Nights
8 listings
6.9% of total
Key Insights
- The most prevalent minimum stay requirement in Villepinte is 1 Night, adopted by 45.7% of listings. This highlights the market's preference for shorter, flexible bookings.
- A strong majority (77.6%) of the Villepinte Airbnb data shows acceptance of very short stays (1-2 nights), indicating a dynamic, high-turnover market.
Recommendations
- Align with the market by considering a 1 Night minimum stay, as 45.7% of Villepinte hosts use this setting.
- Explore offering discounts for stays of 30+ nights to attract the 6.9% of the market seeking extended stays.
- Adjust minimum nights based on seasonality – potentially shorter during low season and longer during peak demand periods in Villepinte.
Villepinte Airbnb Cancellation Policy Trends Analysis (2025)
Super Strict 60 Days
1 listings
1% of total
Flexible
23 listings
24% of total
Moderate
29 listings
30.2% of total
Firm
14 listings
14.6% of total
Strict
29 listings
30.2% of total
Cancellation Policy Insights for Villepinte
- The prevailing Airbnb cancellation policy trend in Villepinte is Moderate, used by 30.2% of listings.
- There's a relatively balanced mix between guest-friendly (54.2%) and stricter (44.8%) policies, offering choices for different guest needs.
Recommendations for Hosts
- Consider adopting a Moderate policy to align with the 30.2% market standard in Villepinte.
- With 30.2% using Strict terms, this is a viable option in Villepinte, particularly for high-value properties or during peak demand periods.
- Regularly review your cancellation policy against competitors and market demand shifts in Villepinte.
Villepinte STR Booking Lead Time Analysis (2025)
Average Booking Lead Time by Month
Booking Lead Time Insights for Villepinte
- The overall average booking lead time for vacation rentals in Villepinte is 46 days.
- Guests book furthest in advance for stays during July (average 112 days), likely coinciding with peak travel demand or local events.
- The shortest booking windows occur for stays in March (average 27 days), indicating more last-minute travel plans during this time.
- Seasonally, Summer (76 days avg.) sees the longest lead times, while Winter (33 days avg.) has the shortest, reflecting typical travel planning cycles.
Recommendations for Hosts
- Use the overall average lead time (46 days) as a baseline for your pricing and availability strategy in Villepinte.
- For July stays, consider implementing length-of-stay discounts or slightly higher rates for bookings made less than 112 days out to capitalize on advance planning.
- Target marketing efforts for the Summer season well in advance (at least 76 days) to capture early planners.
- Monitor your own booking lead times against these Villepinte averages to identify opportunities for dynamic pricing adjustments.
Popular & Essential Airbnb Amenities in Villepinte (2025)
Amenity Prevalence
Amenity Insights for Villepinte
- Essential amenities in Villepinte that guests expect include: Heating, Hot water, Wifi. Lacking these (any) could significantly impact bookings.
- Popular amenities like Kitchen, TV, Essentials are common but not universal. Offering these can provide a competitive edge.
Recommendations for Hosts
- Ensure your listing includes all essential amenities for Villepinte: Heating, Hot water, Wifi.
- Prioritize adding missing essentials: Heating, Hot water, Wifi.
- Consider adding popular differentiators like Kitchen or TV to increase appeal.
- Highlight unique or less common amenities you offer (e.g., hot tub, dedicated workspace, EV charger) in your listing description and photos.
- Regularly check competitor amenities in Villepinte to stay competitive.
Villepinte Airbnb Guest Demographics & Profile Analysis (2025)
Guest Profile Summary for Villepinte
- The typical guest profile for Airbnb in Villepinte consists of a mix of domestic (60%) and international guests, often arriving from nearby Paris, typically belonging to the Post-2000s (Gen Z/Alpha) group (50%), primarily speaking English or French.
- Domestic travelers account for 59.8% of guests.
- Key international markets include France (59.8%) and United States (8.1%).
- Top languages spoken are English (36.2%) followed by French (35.2%).
- A significant demographic segment is the Post-2000s (Gen Z/Alpha) group, representing 50% of guests.
Recommendations for Hosts
- Balance marketing efforts between domestic and international channels based on the guest mix.
- Tailor amenities and listing descriptions to appeal to the dominant Post-2000s (Gen Z/Alpha) demographic (e.g., highlight fast WiFi, smart home features, local guides).
- Highlight unique local experiences or amenities relevant to the primary guest profile.
- Consider seasonal promotions aligned with peak travel times for key origin markets.
Nearby Short-Term Rental Market Comparison
How does the Villepinte Airbnb market stack up against its neighbors? Compare key performance metrics like average monthly revenue, ADR, and occupancy rates in surrounding areas to understand the broader regional STR landscape.
| Market | Active Properties | Monthly Revenue | Daily Rate | Avg. Occupancy |
|---|---|---|---|---|
| Morienval | 10 | $5,794 | $400.84 | 32% |
| Verdelot | 13 | $3,885 | $300.79 | 46% |
| Trigny | 10 | $3,775 | $248.19 | 46% |
| La Couture-Boussey | 12 | $3,620 | $378.08 | 28% |
| Dourdan | 15 | $3,576 | $223.06 | 52% |
| Rosoy-en-Multien | 15 | $3,558 | $367.61 | 51% |
| Millançay | 11 | $3,476 | $370.42 | 39% |
| Chaintreaux | 11 | $3,136 | $278.28 | 34% |
| Langon-sur-Cher | 12 | $3,127 | $400.27 | 35% |
| Mesnils-sur-Iton | 22 | $3,028 | $309.05 | 40% |