Villeneuve-le-Roi Airbnb Market Analysis 2025: Short Term Rental Data & Vacation Rental Statistics in Ile-de-France, France
Is Airbnb profitable in Villeneuve-le-Roi in 2025? Explore comprehensive Airbnb analytics for Villeneuve-le-Roi, Ile-de-France, France to uncover income potential. This 2025 STR market report for Villeneuve-le-Roi, based on AirROI data from April 2024 to March 2025, reveals key trends in the niche market of 60 active listings.
Whether you're considering an Airbnb investment in Villeneuve-le-Roi, optimizing your existing vacation rental, or exploring rental arbitrage opportunities, understanding the Villeneuve-le-Roi Airbnb data is crucial. Leveraging the low regulation environment is key to maximizing your short term rental income potential. Let's dive into the specifics.
Key Villeneuve-le-Roi Airbnb Performance Metrics Overview
Monthly Airbnb Revenue Variations & Income Potential in Villeneuve-le-Roi (2025)
Understanding the monthly revenue variations for Airbnb listings in Villeneuve-le-Roi is key to maximizing your short term rental income potential. Seasonality significantly impacts earnings. Our analysis, based on data from the past 12 months, shows that the peak revenue month for STRs in Villeneuve-le-Roi is typically May, while March often presents the lowest earnings, highlighting opportunities for strategic pricing adjustments during shoulder and low seasons. Explore the typical Airbnb income in Villeneuve-le-Roi across different performance tiers:
- Best-in-class properties (Top 10%) achieve $3,225+ monthly, often utilizing dynamic pricing and superior guest experiences.
- Strong performing properties (Top 25%) earn $2,343 or more, indicating effective management and desirable locations/amenities.
- Typical properties (Median) generate around $1,372 per month, representing the average market performance.
- Entry-level properties (Bottom 25%) see earnings around $672, often with potential for optimization.
Average Monthly Airbnb Earnings Trend in Villeneuve-le-Roi
Villeneuve-le-Roi Airbnb Occupancy Rate Trends (2025)
Maximize your bookings by understanding the Villeneuve-le-Roi STR occupancy trends. Seasonal demand shifts significantly influence how often properties are booked. Typically, Septembersees the highest demand (peak season occupancy), while March experiences the lowest (low season). Effective strategies, like adjusting minimum stays or offering promotions, can boost occupancy during slower periods. Here's how different property tiers perform in Villeneuve-le-Roi:
- Best-in-class properties (Top 10%) achieve 85%+ occupancy, indicating high desirability and potentially optimized availability.
- Strong performing properties (Top 25%) maintain 65% or higher occupancy, suggesting good market fit and guest satisfaction.
- Typical properties (Median) have an occupancy rate around 39%.
- Entry-level properties (Bottom 25%) average 21% occupancy, potentially facing higher vacancy.
Average Monthly Occupancy Rate Trend in Villeneuve-le-Roi
Average Daily Rate (ADR) Airbnb Trends in Villeneuve-le-Roi (2025)
Effective short term rental pricing strategy in Villeneuve-le-Roi involves understanding monthly ADR fluctuations. The Average Daily Rate (ADR) for Airbnb in Villeneuve-le-Roi typically peaks in August and dips lowest during March. Leveraging Airbnb dynamic pricing tools or strategies based on this seasonality can significantly boost revenue. Here's a look at the typical nightly rates achieved:
- Best-in-class properties (Top 10%) command rates of $183+ per night, often due to premium features or locations.
- Strong performing properties (Top 25%) achieve nightly rates of $113 or more.
- Typical properties (Median) charge around $82 per night.
- Entry-level properties (Bottom 25%) earn around $63 per night.
Average Daily Rate (ADR) Trend by Month in Villeneuve-le-Roi
Get Live Villeneuve-le-Roi Market Intelligence 👇

Explore Real-time Analytics
Airbnb Seasonality Analysis & Trends in Villeneuve-le-Roi (2025)
Peak Season (May, April, July)
- Revenue averages $2,513 per month
- Occupancy rates average 50.7%
- Daily rates average $135
Shoulder Season
- Revenue averages $1,558 per month
- Occupancy maintains around 42.9%
- Daily rates hold near $120
Low Season (January, February, March)
- Revenue drops to average $802 per month
- Occupancy decreases to average 37.7%
- Daily rates adjust to average $88
Seasonality Insights for Villeneuve-le-Roi
- The Airbnb seasonality in Villeneuve-le-Roi shows highly seasonal trends requiring careful strategy. While the sections above show seasonal averages, it's also insightful to look at the extremes:
- During the high season, the absolute peak month showcases Villeneuve-le-Roi's highest earning potential, with monthly revenues capable of climbing to $2,806, occupancy reaching a high of 51.7%, and ADRs peaking at $142.
- Conversely, the slowest single month of the year, typically falling within the low season, marks the market's lowest point. In this month, revenue might dip to $690, occupancy could drop to 31.7%, and ADRs may adjust down to $87.
- Understanding both the seasonal averages and these monthly peaks and troughs in revenue, occupancy, and ADR is crucial for maximizing your Airbnb profit potential in Villeneuve-le-Roi.
Seasonal Strategies for Maximizing Profit
- Peak Season: Maximize revenue through premium pricing and potentially longer minimum stays. Ensure high availability.
- Low Season: Offer competitive pricing, special promotions (e.g., extended stay discounts), and flexible cancellation policies. Target off-season travelers like remote workers or budget-conscious guests.
- Shoulder Seasons: Implement dynamic pricing that balances peak and low rates. Target weekend travelers or specific events. Offer slightly more flexible terms than peak season.
- Regularly analyze your own performance against these Villeneuve-le-Roi seasonality benchmarks and adjust your pricing and availability strategy accordingly.
Best Areas for Airbnb Investment in Villeneuve-le-Roi (2025)
Exploring the top neighborhoods for short-term rentals in Villeneuve-le-Roi? This section highlights key areas, outlining why they are attractive for hosts and guests, along with notable local attractions. Consider these locations based on your target guest profile and investment strategy.
| Neighborhood / Area | Why Host Here? (Target Guests & Appeal) | Key Attractions & Landmarks |
|---|---|---|
| Centre Ville | The heart of Villeneuve-le-Roi with historic architecture, local shops, and restaurants. Attractive to visitors looking for a charming French town experience. | Villeneuve-le-Roi Town Hall, Eglise Saint-Antoine, Local markets, Banks of the Seine, Parc des Moulins |
| Parc de la Mairie | An area known for its green spaces and recreational activities. Ideal for families and those seeking relaxation amidst nature. | Parc de la Mairie, Playgrounds, Walking paths, Picnic areas, Lakeside views |
| Gare de Villeneuve-le-Roi | Proximity to the train station makes this area convenient for travelers commuting to Paris. Attractive for short-term rentals for business travelers. | RER Train Station, Transport links to Paris, Cafés and shops nearby, Local restaurants, Quick access to Paris |
| Les Moulins | A residential area with a mix of houses and green spaces, offering a quiet environment while still being close to the amenities of the town. | Les Moulins Park, Family-friendly environment, Local libraries, Community centers, Proximity to schools |
| Rue de la Gare | A vibrant street known for its shops and eateries. It attracts both locals and visitors, contributing to a lively atmosphere for Airbnb hosting. | Local boutiques, Bakeries and cafés, Restaurants, Cultural events, Street markets |
| Quai des Îles | Located near the Seine River, this area offers scenic views and a peaceful atmosphere. Perfect for guests looking for a serene stay. | Seine river views, Walking and cycling paths, Fishing spots, Picnic areas, Waterfront parks |
| Les Alvys | A mix of urban living and suburban charm, attracting families and young professionals. Good for longer-term rentals and group stays. | La Ferme des Alvys, Community parks, Local schools, Grocery stores, Family-friendly events |
| Avenue Paul Vaillant-Couturier | A busy avenue connecting different parts of Villeneuve-le-Roi, making it accessible and ideal for hosts who want high visibility for their listings. | Cinema, Shopping centers, Restaurants, Public transport access, Cultural events |
Understanding Airbnb License Requirements & STR Laws in Villeneuve-le-Roi (2025)
While Villeneuve-le-Roi, Ile-de-France, France currently shows low STR regulations, specific Airbnb license requirements might still exist or change. Always verify the latest short term rental regulations and Airbnb license requirements directly with local government authorities for Villeneuve-le-Roi to ensure full compliance before hosting.
(Source: AirROI data, 2025, based on 5% licensed listings)
Top Performing Airbnb Properties in Villeneuve-le-Roi (2025)
Benchmark your potential! Explore examples of top-performing Airbnb properties in Villeneuve-le-Roibased on Trailing Twelve Month (TTM) revenue. Analyze their characteristics, revenue, occupancy rate, and ADR to understand what drives success in this market.
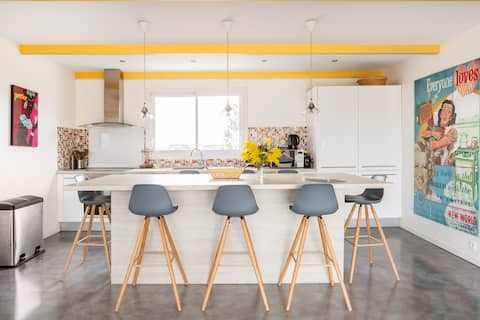
Poplars
Entire Place • 4 bedrooms
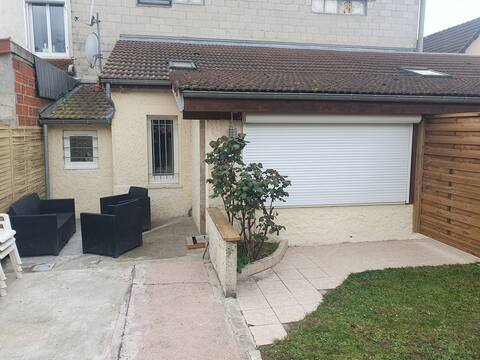
Maison Plein Pied with Terrace
Entire Place • 1 bedroom
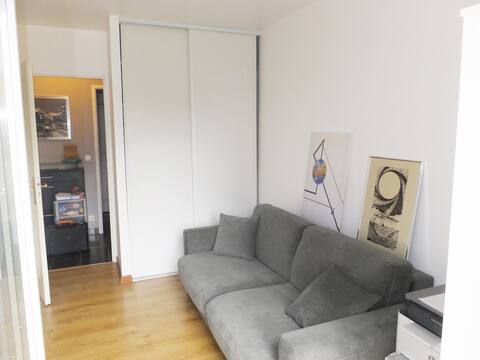
3 rooms 5 minutes' walk on foot, RER C
Entire Place • 2 bedrooms

Guibert Home: Cozy Studio 20 min from Paris
Entire Place • 1 bedroom

Jacuzzi suite near paris
Entire Place • 1 bedroom
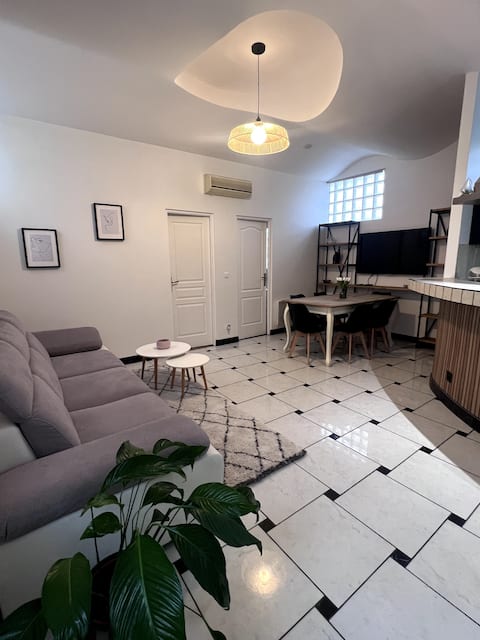
STEA Guesthouse near Paris
Entire Place • 2 bedrooms
Note: Performance varies based on location, size, amenities, seasonality, and management quality. Data reflects the past 12 months.
Top Performing Airbnb Hosts in Villeneuve-le-Roi (2025)
Learn from the best! This table showcases top-performing Airbnb hosts in Villeneuve-le-Roi based on the number of properties managed and estimated total revenue over the past year. Analyze their scale and performance metrics.
| Host Name | Properties | Grossing Revenue | Stay Reviews | Avg Rating |
|---|---|---|---|---|
| Laetitia | 3 | $62,630 | 67 | 3.31/5.0 |
| Joseph | 2 | $56,224 | 20 | 4.93/5.0 |
| Romain | 3 | $47,266 | 86 | 3.28/5.0 |
| Tislem | 2 | $31,682 | 54 | 4.96/5.0 |
| Evelyne | 1 | $31,612 | 17 | 4.88/5.0 |
| Charlton | 2 | $30,815 | 158 | 4.68/5.0 |
| Ravaka Et Florian | 1 | $29,761 | 27 | 4.85/5.0 |
| Virginie | 1 | $28,809 | 46 | 5.00/5.0 |
| Host #72846162 | 1 | $28,425 | 3 | 5.00/5.0 |
| Myriam Et Jonathan | 1 | $23,728 | 37 | 4.95/5.0 |
Analyzing the strategies of top hosts, such as their property selection, pricing, and guest communication, can offer valuable lessons for optimizing your own Airbnb operations in Villeneuve-le-Roi.
Dive Deeper: Advanced Villeneuve-le-Roi STR Market Data (2025)
Ready to unlock more insights? AirROI provides access to advanced metrics and comprehensive Airbnb data for Villeneuve-le-Roi. Explore detailed analytics beyond this report to refine your investment strategy, optimize pricing, and maximize your vacation rental profits.
Explore Advanced MetricsVilleneuve-le-Roi Short-Term Rental Market Composition (2025): Property & Room Types
Room Type Distribution
Property Type Distribution
Market Composition Insights for Villeneuve-le-Roi
- The Villeneuve-le-Roi Airbnb market composition is heavily skewed towards Entire Home/Apt listings, which make up 80% of the 60 active rentals. This indicates strong guest preference for privacy and space.
- Looking at the property type distribution in Villeneuve-le-Roi, Apartment/Condo properties are the most common (50%), reflecting the local real estate landscape.
- Houses represent a significant 40% portion, catering likely to families or larger groups.
Villeneuve-le-Roi Airbnb Room Capacity Analysis (2025): Bedroom Distribution
Distribution of Listings by Number of Bedrooms
Room Capacity Insights for Villeneuve-le-Roi
- The dominant room capacity in Villeneuve-le-Roi is 1 bedroom listings, making up 55% of the market. This suggests a strong demand for properties suitable for couples or solo travelers.
- Together, 1 bedroom and 2 bedrooms properties represent 75.0% of the active Airbnb listings in Villeneuve-le-Roi, indicating a high concentration in these sizes.
- With over half the market (55%) consisting of studios or 1-bedroom units, Villeneuve-le-Roi is particularly well-suited for individuals or couples.
Villeneuve-le-Roi Vacation Rental Guest Capacity Trends (2025)
Distribution of Listings by Guest Capacity
Guest Capacity Insights for Villeneuve-le-Roi
- The most common guest capacity trend in Villeneuve-le-Roi vacation rentals is listings accommodating 2 guests (30%). This suggests the primary traveler segment is likely couples or solo travelers.
- Properties designed for 2 guests and 4 guests dominate the Villeneuve-le-Roi STR market, accounting for 55.0% of listings.
- 13.3% of properties accommodate 6+ guests, serving the market segment for larger families or group travel in Villeneuve-le-Roi.
- On average, properties in Villeneuve-le-Roi are equipped to host 3.1 guests.
Villeneuve-le-Roi Airbnb Booking Patterns (2025): Available vs. Booked Days
Available Days Distribution
Booked Days Distribution
Booking Pattern Insights for Villeneuve-le-Roi
- The most common availability pattern in Villeneuve-le-Roi falls within the 271-366 days range, representing 51.7% of listings. This suggests many properties have significant open periods on their calendars.
- Approximately 81.7% of listings show high availability (181+ days open annually), indicating potential for increased bookings or specific owner usage patterns.
- For booked days, the 91-180 days range is most frequent in Villeneuve-le-Roi (28.3%), reflecting common guest stay durations or potential owner blocking patterns.
- A notable 20.0% of properties secure long booking periods (181+ days booked per year), highlighting successful long-term rental strategies or significant owner usage.
Villeneuve-le-Roi Airbnb Minimum Stay Requirements Analysis
Distribution of Listings by Minimum Night Requirement
1 Night
25 listings
47.2% of total
2 Nights
9 listings
17% of total
3 Nights
8 listings
15.1% of total
4-6 Nights
3 listings
5.7% of total
7-29 Nights
3 listings
5.7% of total
30+ Nights
5 listings
9.4% of total
Key Insights
- The most prevalent minimum stay requirement in Villeneuve-le-Roi is 1 Night, adopted by 47.2% of listings. This highlights the market's preference for shorter, flexible bookings.
- A strong majority (64.2%) of the Villeneuve-le-Roi Airbnb data shows acceptance of very short stays (1-2 nights), indicating a dynamic, high-turnover market.
Recommendations
- Align with the market by considering a 1 Night minimum stay, as 47.2% of Villeneuve-le-Roi hosts use this setting.
- Explore offering discounts for stays of 30+ nights to attract the 9.4% of the market seeking extended stays.
- Adjust minimum nights based on seasonality – potentially shorter during low season and longer during peak demand periods in Villeneuve-le-Roi.
Villeneuve-le-Roi Airbnb Cancellation Policy Trends Analysis (2025)
Flexible
19 listings
47.5% of total
Moderate
7 listings
17.5% of total
Firm
8 listings
20% of total
Strict
6 listings
15% of total
Cancellation Policy Insights for Villeneuve-le-Roi
- The prevailing Airbnb cancellation policy trend in Villeneuve-le-Roi is Flexible, used by 47.5% of listings.
- There's a relatively balanced mix between guest-friendly (65.0%) and stricter (35.0%) policies, offering choices for different guest needs.
Recommendations for Hosts
- Consider adopting a Flexible policy to align with the 47.5% market standard in Villeneuve-le-Roi.
- Regularly review your cancellation policy against competitors and market demand shifts in Villeneuve-le-Roi.
Villeneuve-le-Roi STR Booking Lead Time Analysis (2025)
Average Booking Lead Time by Month
Booking Lead Time Insights for Villeneuve-le-Roi
- The overall average booking lead time for vacation rentals in Villeneuve-le-Roi is 34 days.
- Guests book furthest in advance for stays during July (average 97 days), likely coinciding with peak travel demand or local events.
- The shortest booking windows occur for stays in February (average 35 days), indicating more last-minute travel plans during this time.
- Seasonally, Summer (60 days avg.) sees the longest lead times, while Winter (38 days avg.) has the shortest, reflecting typical travel planning cycles.
Recommendations for Hosts
- Use the overall average lead time (34 days) as a baseline for your pricing and availability strategy in Villeneuve-le-Roi.
- For July stays, consider implementing length-of-stay discounts or slightly higher rates for bookings made less than 97 days out to capitalize on advance planning.
- Target marketing efforts for the Summer season well in advance (at least 60 days) to capture early planners.
- Monitor your own booking lead times against these Villeneuve-le-Roi averages to identify opportunities for dynamic pricing adjustments.
Popular & Essential Airbnb Amenities in Villeneuve-le-Roi (2025)
Amenity Prevalence
Amenity Insights for Villeneuve-le-Roi
- Essential amenities in Villeneuve-le-Roi that guests expect include: Heating, Hot water, Wifi, Kitchen, TV. Lacking these (any) could significantly impact bookings.
- Popular amenities like Smoke alarm, Bed linens, Essentials are common but not universal. Offering these can provide a competitive edge.
Recommendations for Hosts
- Ensure your listing includes all essential amenities for Villeneuve-le-Roi: Heating, Hot water, Wifi, Kitchen, TV.
- Prioritize adding missing essentials: Heating, Hot water, Wifi, Kitchen, TV.
- Consider adding popular differentiators like Smoke alarm or Bed linens to increase appeal.
- Highlight unique or less common amenities you offer (e.g., hot tub, dedicated workspace, EV charger) in your listing description and photos.
- Regularly check competitor amenities in Villeneuve-le-Roi to stay competitive.
Villeneuve-le-Roi Airbnb Guest Demographics & Profile Analysis (2025)
Guest Profile Summary for Villeneuve-le-Roi
- The typical guest profile for Airbnb in Villeneuve-le-Roi consists of a mix of domestic (61%) and international guests, often arriving from nearby Paris, typically belonging to the Post-2000s (Gen Z/Alpha) group (50%), primarily speaking French or English.
- Domestic travelers account for 61.3% of guests.
- Key international markets include France (61.3%) and United States (6.1%).
- Top languages spoken are French (34.4%) followed by English (31.5%).
- A significant demographic segment is the Post-2000s (Gen Z/Alpha) group, representing 50% of guests.
Recommendations for Hosts
- Target domestic marketing efforts towards travelers from Paris and Lyon.
- Tailor amenities and listing descriptions to appeal to the dominant Post-2000s (Gen Z/Alpha) demographic (e.g., highlight fast WiFi, smart home features, local guides).
- Highlight unique local experiences or amenities relevant to the primary guest profile.
- Consider seasonal promotions aligned with peak travel times for key origin markets.
Nearby Short-Term Rental Market Comparison
How does the Villeneuve-le-Roi Airbnb market stack up against its neighbors? Compare key performance metrics like average monthly revenue, ADR, and occupancy rates in surrounding areas to understand the broader regional STR landscape.
| Market | Active Properties | Monthly Revenue | Daily Rate | Avg. Occupancy |
|---|---|---|---|---|
| Morienval | 10 | $5,794 | $400.84 | 32% |
| Verdelot | 13 | $3,885 | $300.79 | 46% |
| Trigny | 10 | $3,775 | $248.19 | 46% |
| La Couture-Boussey | 12 | $3,620 | $378.08 | 28% |
| Dourdan | 15 | $3,576 | $223.06 | 52% |
| Rosoy-en-Multien | 15 | $3,558 | $367.61 | 51% |
| Millançay | 11 | $3,476 | $370.42 | 39% |
| Chaintreaux | 11 | $3,136 | $278.28 | 34% |
| Langon-sur-Cher | 12 | $3,127 | $400.27 | 35% |
| Mesnils-sur-Iton | 22 | $3,028 | $309.05 | 40% |