Villebon-sur-Yvette Airbnb Market Analysis 2025: Short Term Rental Data & Vacation Rental Statistics in Ile-de-France, France
Is Airbnb profitable in Villebon-sur-Yvette in 2025? Explore comprehensive Airbnb analytics for Villebon-sur-Yvette, Ile-de-France, France to uncover income potential. This 2025 STR market report for Villebon-sur-Yvette, based on AirROI data from April 2024 to March 2025, reveals key trends in the niche market of 27 active listings.
Whether you're considering an Airbnb investment in Villebon-sur-Yvette, optimizing your existing vacation rental, or exploring rental arbitrage opportunities, understanding the Villebon-sur-Yvette Airbnb data is crucial. Leveraging the low regulation environment is key to maximizing your short term rental income potential. Let's dive into the specifics.
Key Villebon-sur-Yvette Airbnb Performance Metrics Overview
Monthly Airbnb Revenue Variations & Income Potential in Villebon-sur-Yvette (2025)
Understanding the monthly revenue variations for Airbnb listings in Villebon-sur-Yvette is key to maximizing your short term rental income potential. Seasonality significantly impacts earnings. Our analysis, based on data from the past 12 months, shows that the peak revenue month for STRs in Villebon-sur-Yvette is typically July, while November often presents the lowest earnings, highlighting opportunities for strategic pricing adjustments during shoulder and low seasons. Explore the typical Airbnb income in Villebon-sur-Yvette across different performance tiers:
- Best-in-class properties (Top 10%) achieve $2,882+ monthly, often utilizing dynamic pricing and superior guest experiences.
- Strong performing properties (Top 25%) earn $1,874 or more, indicating effective management and desirable locations/amenities.
- Typical properties (Median) generate around $939 per month, representing the average market performance.
- Entry-level properties (Bottom 25%) see earnings around $453, often with potential for optimization.
Average Monthly Airbnb Earnings Trend in Villebon-sur-Yvette
Villebon-sur-Yvette Airbnb Occupancy Rate Trends (2025)
Maximize your bookings by understanding the Villebon-sur-Yvette STR occupancy trends. Seasonal demand shifts significantly influence how often properties are booked. Typically, Julysees the highest demand (peak season occupancy), while November experiences the lowest (low season). Effective strategies, like adjusting minimum stays or offering promotions, can boost occupancy during slower periods. Here's how different property tiers perform in Villebon-sur-Yvette:
- Best-in-class properties (Top 10%) achieve 71%+ occupancy, indicating high desirability and potentially optimized availability.
- Strong performing properties (Top 25%) maintain 57% or higher occupancy, suggesting good market fit and guest satisfaction.
- Typical properties (Median) have an occupancy rate around 34%.
- Entry-level properties (Bottom 25%) average 16% occupancy, potentially facing higher vacancy.
Average Monthly Occupancy Rate Trend in Villebon-sur-Yvette
Average Daily Rate (ADR) Airbnb Trends in Villebon-sur-Yvette (2025)
Effective short term rental pricing strategy in Villebon-sur-Yvette involves understanding monthly ADR fluctuations. The Average Daily Rate (ADR) for Airbnb in Villebon-sur-Yvette typically peaks in August and dips lowest during February. Leveraging Airbnb dynamic pricing tools or strategies based on this seasonality can significantly boost revenue. Here's a look at the typical nightly rates achieved:
- Best-in-class properties (Top 10%) command rates of $235+ per night, often due to premium features or locations.
- Strong performing properties (Top 25%) achieve nightly rates of $121 or more.
- Typical properties (Median) charge around $65 per night.
- Entry-level properties (Bottom 25%) earn around $45 per night.
Average Daily Rate (ADR) Trend by Month in Villebon-sur-Yvette
Get Live Villebon-sur-Yvette Market Intelligence 👇

Explore Real-time Analytics
Airbnb Seasonality Analysis & Trends in Villebon-sur-Yvette (2025)
Peak Season (July, August, June)
- Revenue averages $2,029 per month
- Occupancy rates average 43.3%
- Daily rates average $326
Shoulder Season
- Revenue averages $1,340 per month
- Occupancy maintains around 39.5%
- Daily rates hold near $254
Low Season (January, March, November)
- Revenue drops to average $753 per month
- Occupancy decreases to average 31.9%
- Daily rates adjust to average $114
Seasonality Insights for Villebon-sur-Yvette
- The Airbnb seasonality in Villebon-sur-Yvette shows highly seasonal trends requiring careful strategy. While the sections above show seasonal averages, it's also insightful to look at the extremes:
- During the high season, the absolute peak month showcases Villebon-sur-Yvette's highest earning potential, with monthly revenues capable of climbing to $2,132, occupancy reaching a high of 51.2%, and ADRs peaking at $329.
- Conversely, the slowest single month of the year, typically falling within the low season, marks the market's lowest point. In this month, revenue might dip to $573, occupancy could drop to 28.2%, and ADRs may adjust down to $113.
- Understanding both the seasonal averages and these monthly peaks and troughs in revenue, occupancy, and ADR is crucial for maximizing your Airbnb profit potential in Villebon-sur-Yvette.
Seasonal Strategies for Maximizing Profit
- Peak Season: Maximize revenue through premium pricing and potentially longer minimum stays. Ensure high availability.
- Low Season: Offer competitive pricing, special promotions (e.g., extended stay discounts), and flexible cancellation policies. Target off-season travelers like remote workers or budget-conscious guests.
- Shoulder Seasons: Implement dynamic pricing that balances peak and low rates. Target weekend travelers or specific events. Offer slightly more flexible terms than peak season.
- Regularly analyze your own performance against these Villebon-sur-Yvette seasonality benchmarks and adjust your pricing and availability strategy accordingly.
Best Areas for Airbnb Investment in Villebon-sur-Yvette (2025)
Exploring the top neighborhoods for short-term rentals in Villebon-sur-Yvette? This section highlights key areas, outlining why they are attractive for hosts and guests, along with notable local attractions. Consider these locations based on your target guest profile and investment strategy.
| Neighborhood / Area | Why Host Here? (Target Guests & Appeal) | Key Attractions & Landmarks |
|---|---|---|
| Centre-Ville | The heart of Villebon-sur-Yvette with easy access to shops, restaurants, and public transport. An ideal location for visitors wanting to explore the local culture and amenities. | Local shops, Restaurants, Cafes, Public transport links, Parks |
| Campus universitaire | Close to universities and educational institutions, attracting students and academic visitors. A great choice for long-term stays and budget travelers. | Universities, Libraries, Student cafes, Academic events, Parks |
| Parc de la mairie | A serene area with green spaces and recreational facilities, perfect for families or those looking for a quiet getaway. | Parc de la Mairie, Children's playground, Outdoor fitness, Walking paths, Picnic areas |
| Bords de l'Yvette | Picturesque riverside area that's great for scenic walks and outdoor activities. Attracts nature lovers and those looking to unwind. | Yvette River, Walking and cycling paths, Fishing spots, Scenic viewpoints, Nature reserves |
| Zone industrielle | A bustling area with various businesses and companies, appealing to business travelers and those attending corporate events. | Corporate offices, Business parks, Conference centers, Local dining options, Transport hubs |
| Les Grands Moulins | A residential neighborhood that offers a local feel and is close to amenities, suitable for quiet family stays. | Local markets, Family-friendly parks, Community centers, Nearby schools, Cafes |
| Les Villas du Parc | A tranquil suburb known for its charming villas and gardens, perfect for visitors wanting a peaceful environment while still being near the city. | Beautiful villas, Gardens, Sidewalks, Quiet streets, Community events |
| Le Petit Parc | A smaller neighborhood with proximity to leisure activities, making it suitable for guests looking for a mix of relaxation and entertainment. | Small parks, Local restaurants, Community events, Cultural festivals, Art displays |
Understanding Airbnb License Requirements & STR Laws in Villebon-sur-Yvette (2025)
While Villebon-sur-Yvette, Ile-de-France, France currently shows low STR regulations, specific Airbnb license requirements might still exist or change. Always verify the latest short term rental regulations and Airbnb license requirements directly with local government authorities for Villebon-sur-Yvette to ensure full compliance before hosting.
(Source: AirROI data, 2025, finding no licensed listings among those analyzed)
Top Performing Airbnb Properties in Villebon-sur-Yvette (2025)
Benchmark your potential! Explore examples of top-performing Airbnb properties in Villebon-sur-Yvettebased on Trailing Twelve Month (TTM) revenue. Analyze their characteristics, revenue, occupancy rate, and ADR to understand what drives success in this market.
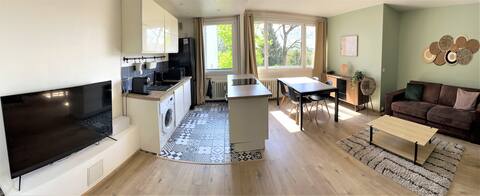
Le Natural Cottage* RER STATION *Close to Paris &Aéroport
Entire Place • 2 bedrooms

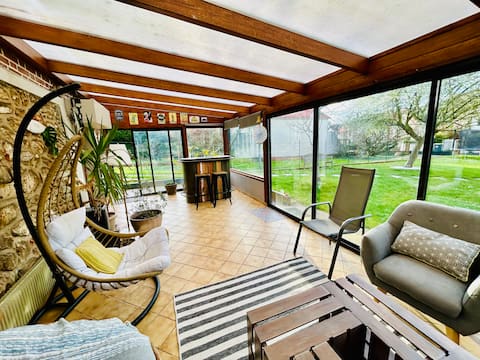
Hanging cabin in the trees
Entire Place • N/A
House 7 people near Paris OG 2024 RER B direct
Entire Place • 4 bedrooms
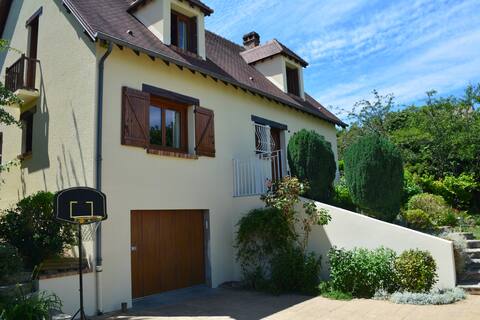
Villa - JO 2024 - 30 mn Paris
Entire Place • 3 bedrooms
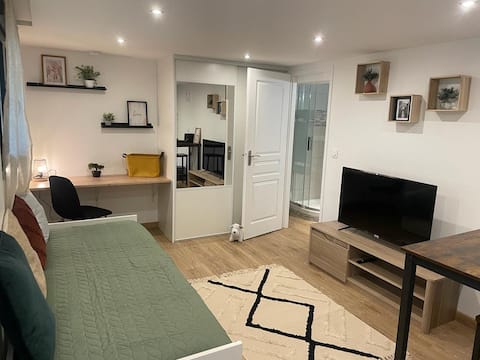
Cozy studio in Villebon
Entire Place • 1 bedroom
Charming studio fully equipped.
Entire Place • 1 bedroom
Note: Performance varies based on location, size, amenities, seasonality, and management quality. Data reflects the past 12 months.
Top Performing Airbnb Hosts in Villebon-sur-Yvette (2025)
Learn from the best! This table showcases top-performing Airbnb hosts in Villebon-sur-Yvette based on the number of properties managed and estimated total revenue over the past year. Analyze their scale and performance metrics.
| Host Name | Properties | Grossing Revenue | Stay Reviews | Avg Rating |
|---|---|---|---|---|
| Rose & Thomas Raphael | 1 | $31,112 | 34 | 4.85/5.0 |
| Patricia | 1 | $30,021 | 72 | 4.89/5.0 |
| Host #157682338 | 2 | $26,155 | 1 | 0.00/5.0 |
| Clemence | 1 | $19,826 | 3 | 5.00/5.0 |
| Eléonor | 1 | $18,692 | 82 | 4.91/5.0 |
| Florence Et Laurent | 1 | $16,807 | 36 | 4.89/5.0 |
| Host #46779537 | 1 | $13,202 | 1 | 0.00/5.0 |
| Host #41234702 | 1 | $12,350 | 1 | 0.00/5.0 |
| Antoine | 1 | $12,306 | 17 | 4.88/5.0 |
| Dominique | 3 | $10,953 | 170 | 4.75/5.0 |
Analyzing the strategies of top hosts, such as their property selection, pricing, and guest communication, can offer valuable lessons for optimizing your own Airbnb operations in Villebon-sur-Yvette.
Dive Deeper: Advanced Villebon-sur-Yvette STR Market Data (2025)
Ready to unlock more insights? AirROI provides access to advanced metrics and comprehensive Airbnb data for Villebon-sur-Yvette. Explore detailed analytics beyond this report to refine your investment strategy, optimize pricing, and maximize your vacation rental profits.
Explore Advanced MetricsVillebon-sur-Yvette Short-Term Rental Market Composition (2025): Property & Room Types
Room Type Distribution
Property Type Distribution
Market Composition Insights for Villebon-sur-Yvette
- The Villebon-sur-Yvette Airbnb market composition is heavily skewed towards Entire Home/Apt listings, which make up 66.7% of the 27 active rentals. This indicates strong guest preference for privacy and space.
- However, a notable 33.3% share for Private Rooms suggests opportunities for budget-conscious travelers or hosts renting out spare rooms.
- Looking at the property type distribution in Villebon-sur-Yvette, House properties are the most common (51.9%), reflecting the local real estate landscape.
- Houses represent a significant 51.9% portion, catering likely to families or larger groups.
- Smaller segments like unique stays, hotel/boutique (combined 7.4%) offer potential for unique stay experiences.
Villebon-sur-Yvette Airbnb Room Capacity Analysis (2025): Bedroom Distribution
Distribution of Listings by Number of Bedrooms
Room Capacity Insights for Villebon-sur-Yvette
- The dominant room capacity in Villebon-sur-Yvette is 1 bedroom listings, making up 37% of the market. This suggests a strong demand for properties suitable for couples or solo travelers.
- Together, 1 bedroom and 2 bedrooms properties represent 48.1% of the active Airbnb listings in Villebon-sur-Yvette, indicating a high concentration in these sizes.
Villebon-sur-Yvette Vacation Rental Guest Capacity Trends (2025)
Distribution of Listings by Guest Capacity
Guest Capacity Insights for Villebon-sur-Yvette
- The most common guest capacity trend in Villebon-sur-Yvette vacation rentals is listings accommodating 2 guests (18.5%). This suggests the primary traveler segment is likely couples or solo travelers.
- Properties designed for 2 guests and 4 guests dominate the Villebon-sur-Yvette STR market, accounting for 33.3% of listings.
- 25.9% of properties accommodate 6+ guests, serving the market segment for larger families or group travel in Villebon-sur-Yvette.
- On average, properties in Villebon-sur-Yvette are equipped to host 3.0 guests.
Villebon-sur-Yvette Airbnb Booking Patterns (2025): Available vs. Booked Days
Available Days Distribution
Booked Days Distribution
Booking Pattern Insights for Villebon-sur-Yvette
- The most common availability pattern in Villebon-sur-Yvette falls within the 271-366 days range, representing 59.3% of listings. This suggests many properties have significant open periods on their calendars.
- Approximately 88.9% of listings show high availability (181+ days open annually), indicating potential for increased bookings or specific owner usage patterns.
- For booked days, the 31-90 days range is most frequent in Villebon-sur-Yvette (33.3%), reflecting common guest stay durations or potential owner blocking patterns.
- A notable 11.1% of properties secure long booking periods (181+ days booked per year), highlighting successful long-term rental strategies or significant owner usage.
Villebon-sur-Yvette Airbnb Minimum Stay Requirements Analysis
Distribution of Listings by Minimum Night Requirement
1 Night
11 listings
45.8% of total
2 Nights
4 listings
16.7% of total
3 Nights
4 listings
16.7% of total
4-6 Nights
2 listings
8.3% of total
7-29 Nights
1 listings
4.2% of total
30+ Nights
2 listings
8.3% of total
Key Insights
- The most prevalent minimum stay requirement in Villebon-sur-Yvette is 1 Night, adopted by 45.8% of listings. This highlights the market's preference for shorter, flexible bookings.
- A strong majority (62.5%) of the Villebon-sur-Yvette Airbnb data shows acceptance of very short stays (1-2 nights), indicating a dynamic, high-turnover market.
Recommendations
- Align with the market by considering a 1 Night minimum stay, as 45.8% of Villebon-sur-Yvette hosts use this setting.
- Explore offering discounts for stays of 30+ nights to attract the 8.3% of the market seeking extended stays.
- Adjust minimum nights based on seasonality – potentially shorter during low season and longer during peak demand periods in Villebon-sur-Yvette.
Villebon-sur-Yvette Airbnb Cancellation Policy Trends Analysis (2025)
Flexible
7 listings
35% of total
Moderate
4 listings
20% of total
Firm
6 listings
30% of total
Strict
3 listings
15% of total
Cancellation Policy Insights for Villebon-sur-Yvette
- The prevailing Airbnb cancellation policy trend in Villebon-sur-Yvette is Flexible, used by 35% of listings.
- There's a relatively balanced mix between guest-friendly (55.0%) and stricter (45.0%) policies, offering choices for different guest needs.
Recommendations for Hosts
- Consider adopting a Flexible policy to align with the 35% market standard in Villebon-sur-Yvette.
- Regularly review your cancellation policy against competitors and market demand shifts in Villebon-sur-Yvette.
Villebon-sur-Yvette STR Booking Lead Time Analysis (2025)
Average Booking Lead Time by Month
Booking Lead Time Insights for Villebon-sur-Yvette
- The overall average booking lead time for vacation rentals in Villebon-sur-Yvette is 35 days.
- Guests book furthest in advance for stays during August (average 84 days), likely coinciding with peak travel demand or local events.
- The shortest booking windows occur for stays in March (average 9 days), indicating more last-minute travel plans during this time.
- Seasonally, Summer (43 days avg.) sees the longest lead times, while Spring (28 days avg.) has the shortest, reflecting typical travel planning cycles.
Recommendations for Hosts
- Use the overall average lead time (35 days) as a baseline for your pricing and availability strategy in Villebon-sur-Yvette.
- For August stays, consider implementing length-of-stay discounts or slightly higher rates for bookings made less than 84 days out to capitalize on advance planning.
- During March, focus on last-minute booking availability and promotions, as guests book with very short notice (9 days avg.).
- Target marketing efforts for the Summer season well in advance (at least 43 days) to capture early planners.
- Monitor your own booking lead times against these Villebon-sur-Yvette averages to identify opportunities for dynamic pricing adjustments.
Popular & Essential Airbnb Amenities in Villebon-sur-Yvette (2025)
Amenity Prevalence
Amenity Insights for Villebon-sur-Yvette
- Essential amenities in Villebon-sur-Yvette that guests expect include: Wifi. Lacking these (this) could significantly impact bookings.
- Popular amenities like Kitchen, Heating, Hot water are common but not universal. Offering these can provide a competitive edge.
Recommendations for Hosts
- Ensure your listing includes all essential amenities for Villebon-sur-Yvette: Wifi.
- Prioritize adding missing essentials: Wifi.
- Consider adding popular differentiators like Kitchen or Heating to increase appeal.
- Highlight unique or less common amenities you offer (e.g., hot tub, dedicated workspace, EV charger) in your listing description and photos.
- Regularly check competitor amenities in Villebon-sur-Yvette to stay competitive.
Villebon-sur-Yvette Airbnb Guest Demographics & Profile Analysis (2025)
Guest Profile Summary for Villebon-sur-Yvette
- The typical guest profile for Airbnb in Villebon-sur-Yvette consists of primarily domestic travelers (77%), often arriving from nearby Paris, typically belonging to the Post-2000s (Gen Z/Alpha) group (50%), primarily speaking French or English.
- Domestic travelers account for 76.8% of guests.
- Key international markets include France (76.8%) and Netherlands (6.5%).
- Top languages spoken are French (42.3%) followed by English (34.4%).
- A significant demographic segment is the Post-2000s (Gen Z/Alpha) group, representing 50% of guests.
Recommendations for Hosts
- Target domestic marketing efforts towards travelers from Paris and Nantes.
- Tailor amenities and listing descriptions to appeal to the dominant Post-2000s (Gen Z/Alpha) demographic (e.g., highlight fast WiFi, smart home features, local guides).
- Highlight unique local experiences or amenities relevant to the primary guest profile.
- Consider seasonal promotions aligned with peak travel times for key origin markets.
Nearby Short-Term Rental Market Comparison
How does the Villebon-sur-Yvette Airbnb market stack up against its neighbors? Compare key performance metrics like average monthly revenue, ADR, and occupancy rates in surrounding areas to understand the broader regional STR landscape.
| Market | Active Properties | Monthly Revenue | Daily Rate | Avg. Occupancy |
|---|---|---|---|---|
| Morienval | 10 | $5,794 | $400.84 | 32% |
| Verdelot | 13 | $3,885 | $300.79 | 46% |
| Trigny | 10 | $3,775 | $248.19 | 46% |
| La Couture-Boussey | 12 | $3,620 | $378.08 | 28% |
| Dourdan | 15 | $3,576 | $223.06 | 52% |
| Rosoy-en-Multien | 15 | $3,558 | $367.61 | 51% |
| Millançay | 11 | $3,476 | $370.42 | 39% |
| Chaintreaux | 11 | $3,136 | $278.28 | 34% |
| Langon-sur-Cher | 12 | $3,127 | $400.27 | 35% |
| Mesnils-sur-Iton | 22 | $3,028 | $309.05 | 40% |