Versailles Airbnb Market Analysis 2025: Short Term Rental Data & Vacation Rental Statistics in Ile-de-France, France
Is Airbnb profitable in Versailles in 2025? Explore comprehensive Airbnb analytics for Versailles, Ile-de-France, France to uncover income potential. This 2025 STR market report for Versailles, based on AirROI data from April 2024 to March 2025, reveals key trends in the market of 747 active listings.
Whether you're considering an Airbnb investment in Versailles, optimizing your existing vacation rental, or exploring rental arbitrage opportunities, understanding the Versailles Airbnb data is crucial. Navigating the high regulation landscape is key to maximizing your short term rental income potential. Let's dive into the specifics.
Key Versailles Airbnb Performance Metrics Overview
Monthly Airbnb Revenue Variations & Income Potential in Versailles (2025)
Understanding the monthly revenue variations for Airbnb listings in Versailles is key to maximizing your short term rental income potential. Seasonality significantly impacts earnings. Our analysis, based on data from the past 12 months, shows that the peak revenue month for STRs in Versailles is typically July, while February often presents the lowest earnings, highlighting opportunities for strategic pricing adjustments during shoulder and low seasons. Explore the typical Airbnb income in Versailles across different performance tiers:
- Best-in-class properties (Top 10%) achieve $4,913+ monthly, often utilizing dynamic pricing and superior guest experiences.
- Strong performing properties (Top 25%) earn $3,208 or more, indicating effective management and desirable locations/amenities.
- Typical properties (Median) generate around $1,851 per month, representing the average market performance.
- Entry-level properties (Bottom 25%) see earnings around $925, often with potential for optimization.
Average Monthly Airbnb Earnings Trend in Versailles
Versailles Airbnb Occupancy Rate Trends (2025)
Maximize your bookings by understanding the Versailles STR occupancy trends. Seasonal demand shifts significantly influence how often properties are booked. Typically, Octobersees the highest demand (peak season occupancy), while March experiences the lowest (low season). Effective strategies, like adjusting minimum stays or offering promotions, can boost occupancy during slower periods. Here's how different property tiers perform in Versailles:
- Best-in-class properties (Top 10%) achieve 81%+ occupancy, indicating high desirability and potentially optimized availability.
- Strong performing properties (Top 25%) maintain 65% or higher occupancy, suggesting good market fit and guest satisfaction.
- Typical properties (Median) have an occupancy rate around 41%.
- Entry-level properties (Bottom 25%) average 20% occupancy, potentially facing higher vacancy.
Average Monthly Occupancy Rate Trend in Versailles
Average Daily Rate (ADR) Airbnb Trends in Versailles (2025)
Effective short term rental pricing strategy in Versailles involves understanding monthly ADR fluctuations. The Average Daily Rate (ADR) for Airbnb in Versailles typically peaks in August and dips lowest during October. Leveraging Airbnb dynamic pricing tools or strategies based on this seasonality can significantly boost revenue. Here's a look at the typical nightly rates achieved:
- Best-in-class properties (Top 10%) command rates of $440+ per night, often due to premium features or locations.
- Strong performing properties (Top 25%) achieve nightly rates of $231 or more.
- Typical properties (Median) charge around $133 per night.
- Entry-level properties (Bottom 25%) earn around $90 per night.
Average Daily Rate (ADR) Trend by Month in Versailles
Get Live Versailles Market Intelligence 👇

Explore Real-time Analytics
Airbnb Seasonality Analysis & Trends in Versailles (2025)
Peak Season (July, May, June)
- Revenue averages $3,418 per month
- Occupancy rates average 45.9%
- Daily rates average $224
Shoulder Season
- Revenue averages $2,425 per month
- Occupancy maintains around 44.7%
- Daily rates hold near $219
Low Season (January, February, March)
- Revenue drops to average $1,500 per month
- Occupancy decreases to average 37.6%
- Daily rates adjust to average $220
Seasonality Insights for Versailles
- The Airbnb seasonality in Versailles shows highly seasonal trends requiring careful strategy. While the sections above show seasonal averages, it's also insightful to look at the extremes:
- During the high season, the absolute peak month showcases Versailles's highest earning potential, with monthly revenues capable of climbing to $3,879, occupancy reaching a high of 50.9%, and ADRs peaking at $237.
- Conversely, the slowest single month of the year, typically falling within the low season, marks the market's lowest point. In this month, revenue might dip to $1,353, occupancy could drop to 36.7%, and ADRs may adjust down to $208.
- Understanding both the seasonal averages and these monthly peaks and troughs in revenue, occupancy, and ADR is crucial for maximizing your Airbnb profit potential in Versailles.
Seasonal Strategies for Maximizing Profit
- Peak Season: Maximize revenue through premium pricing and potentially longer minimum stays. Ensure high availability.
- Low Season: Offer competitive pricing, special promotions (e.g., extended stay discounts), and flexible cancellation policies. Target off-season travelers like remote workers or budget-conscious guests.
- Shoulder Seasons: Implement dynamic pricing that balances peak and low rates. Target weekend travelers or specific events. Offer slightly more flexible terms than peak season.
- Regularly analyze your own performance against these Versailles seasonality benchmarks and adjust your pricing and availability strategy accordingly.
Best Areas for Airbnb Investment in Versailles (2025)
Exploring the top neighborhoods for short-term rentals in Versailles? This section highlights key areas, outlining why they are attractive for hosts and guests, along with notable local attractions. Consider these locations based on your target guest profile and investment strategy.
| Neighborhood / Area | Why Host Here? (Target Guests & Appeal) | Key Attractions & Landmarks |
|---|---|---|
| Palace of Versailles | A UNESCO World Heritage site, the Palace of Versailles attracts millions of visitors each year, making it a prime location for short-term rentals. Guests can enjoy the beautiful gardens and rich history. | Versailles Palace, Gardens of Versailles, The Grand Trianon, The Petit Trianon, Royal Stables |
| Le Chesnay | Adjacent to Versailles, Le Chesnay offers a quieter residential environment while being close to the attractions of Versailles. It appeals to families and long-term visitors. | Shopping at Parly 2, Parc de la mairie, Saint-Louis Cathedral, Les Etangs, Cultural events |
| Saint-Cyr-l'École | This suburb of Versailles provides excellent transport links to Paris and a more relaxed atmosphere. Great for guests who want to explore both Versailles and the capital. | Saint-Cyr-l'École railway station, Château de Saint-Cyr, Parc Naturel de la Vallée de Chevreuse, Les Caves de la Maison de Béranger |
| Montreuil | A historic neighborhood with a charming local vibe, Montreuil offers a unique experience and is just a short distance from the Palace. | Montreuil Park, Mairie de Montreuil, Historic buildings, Local markets, Lac du Parc Montreuil |
| Centre-Ville (Downtown Versailles) | The vibrant city center of Versailles is filled with shops, cafes, and restaurants. It's a lively area for tourists looking to explore the local culture. | Place du Marché, Versailles Cathedral, The Royal Opera of Versailles, Les Deux Ailes, Local boutiques |
| Versailles Rive Droite | This part of the city features a mix of residential and commercial areas, with easy access to the train station and local attractions. Ideal for business travelers. | Local cafes, Versailles railway station, Basilique Saint-Louis, Les colonies des Artistique |
| Versailles Rive Gauche | Known for its charm and proximity to the palace, this area attracts tourists eager to enjoy cultural events and nearby park areas. | Jardin des Étangs, Parc Balbi, Café de l'hôtel de ville, Local bistros, Cultural festivals |
| Château de Versailles Gardens | The vast gardens are not only stunning but also a hotspot for performances and events, making this area highly desirable for visitors. | Fountains of Versailles, Grand Canal, Orangerie of Versailles, Musical Fountains Show, Historical reenactments |
Understanding Airbnb License Requirements & STR Laws in Versailles (2025)
Yes, Versailles, Ile-de-France, France enforces high STR regulations. Obtaining a license and ensuring compliance is almost certainly required according to current 2025 STR laws. Always verify the latest short term rental regulations and Airbnb license requirements directly with local government authorities for Versailles to ensure full compliance before hosting.
(Source: AirROI data, 2025, based on 52% licensed listings)
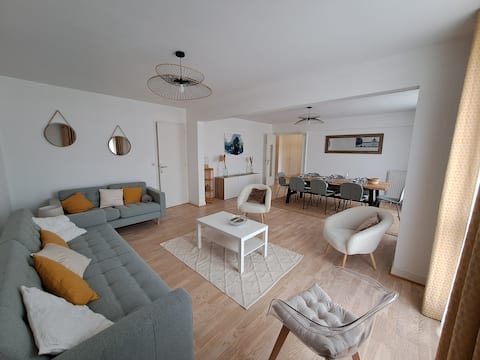
Top Performing Airbnb Properties in Versailles (2025)
Benchmark your potential! Explore examples of top-performing Airbnb properties in Versaillesbased on Trailing Twelve Month (TTM) revenue. Analyze their characteristics, revenue, occupancy rate, and ADR to understand what drives success in this market.
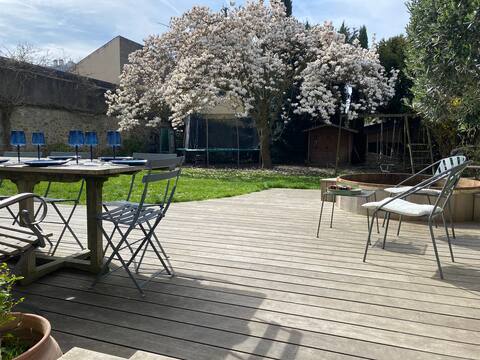
Grande villa centre ville avec spa - J0 Paris 2024
Entire Place • 8 bedrooms
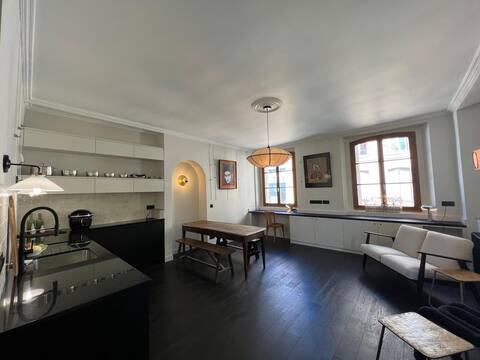
Suite Versailles Saint-Louis district 6 people
Entire Place • 3 bedrooms
Very beautiful apartment right in the center
Entire Place • 3 bedrooms
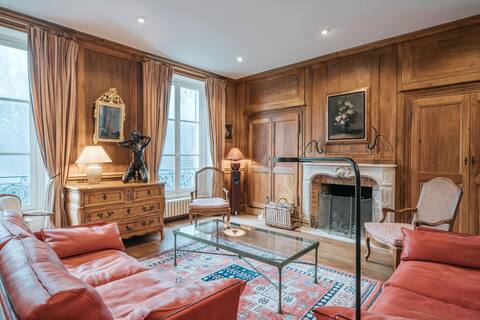
Versailles Château, house spirit
Entire Place • 3 bedrooms
Family apartment near the Palace of Versailles
Entire Place • 3 bedrooms

Beautiful flat, in the heart of Versailles
Entire Place • 2 bedrooms
Note: Performance varies based on location, size, amenities, seasonality, and management quality. Data reflects the past 12 months.
Top Performing Airbnb Hosts in Versailles (2025)
Learn from the best! This table showcases top-performing Airbnb hosts in Versailles based on the number of properties managed and estimated total revenue over the past year. Analyze their scale and performance metrics.
| Host Name | Properties | Grossing Revenue | Stay Reviews | Avg Rating |
|---|---|---|---|---|
| Katia | 24 | $719,096 | 850 | 3.41/5.0 |
| Patrick | 24 | $383,533 | 475 | 3.54/5.0 |
| Salwa Et Antoine | 8 | $294,622 | 370 | 4.10/5.0 |
| Antoine | 10 | $284,669 | 538 | 4.28/5.0 |
| Thierry | 9 | $219,615 | 492 | 4.33/5.0 |
| Charles Et Marthe | 7 | $162,310 | 59 | 4.86/5.0 |
| Hélène | 6 | $145,826 | 54 | 4.00/5.0 |
| Clement | 4 | $135,425 | 25 | 3.65/5.0 |
| Marc | 3 | $119,963 | 193 | 4.67/5.0 |
| Jérôme | 6 | $118,525 | 108 | 3.92/5.0 |
Analyzing the strategies of top hosts, such as their property selection, pricing, and guest communication, can offer valuable lessons for optimizing your own Airbnb operations in Versailles.
Dive Deeper: Advanced Versailles STR Market Data (2025)
Ready to unlock more insights? AirROI provides access to advanced metrics and comprehensive Airbnb data for Versailles. Explore detailed analytics beyond this report to refine your investment strategy, optimize pricing, and maximize your vacation rental profits.
Explore Advanced MetricsVersailles Short-Term Rental Market Composition (2025): Property & Room Types
Room Type Distribution
Property Type Distribution
Market Composition Insights for Versailles
- The Versailles Airbnb market composition is heavily skewed towards Entire Home/Apt listings, which make up 87.7% of the 747 active rentals. This indicates strong guest preference for privacy and space.
- Looking at the property type distribution in Versailles, Apartment/Condo properties are the most common (83.5%), reflecting the local real estate landscape.
- Smaller segments like hotel/boutique, others (combined 3.9%) offer potential for unique stay experiences.
Versailles Airbnb Room Capacity Analysis (2025): Bedroom Distribution
Distribution of Listings by Number of Bedrooms
Room Capacity Insights for Versailles
- The dominant room capacity in Versailles is 1 bedroom listings, making up 44.2% of the market. This suggests a strong demand for properties suitable for couples or solo travelers.
- Together, 1 bedroom and 2 bedrooms properties represent 63.9% of the active Airbnb listings in Versailles, indicating a high concentration in these sizes.
- A significant 21.9% of listings offer 3+ bedrooms, catering to larger groups and families seeking more space in Versailles.
Versailles Vacation Rental Guest Capacity Trends (2025)
Distribution of Listings by Guest Capacity
Guest Capacity Insights for Versailles
- The most common guest capacity trend in Versailles vacation rentals is listings accommodating 4 guests (30.8%). This suggests the primary traveler segment is likely small families or groups.
- Properties designed for 4 guests and 2 guests dominate the Versailles STR market, accounting for 60.8% of listings.
- 20.9% of properties accommodate 6+ guests, serving the market segment for larger families or group travel in Versailles.
- On average, properties in Versailles are equipped to host 3.7 guests.
Versailles Airbnb Booking Patterns (2025): Available vs. Booked Days
Available Days Distribution
Booked Days Distribution
Booking Pattern Insights for Versailles
- The most common availability pattern in Versailles falls within the 271-366 days range, representing 55.6% of listings. This suggests many properties have significant open periods on their calendars.
- Approximately 80.1% of listings show high availability (181+ days open annually), indicating potential for increased bookings or specific owner usage patterns.
- For booked days, the 1-30 days range is most frequent in Versailles (28.2%), reflecting common guest stay durations or potential owner blocking patterns.
- A notable 21.1% of properties secure long booking periods (181+ days booked per year), highlighting successful long-term rental strategies or significant owner usage.
Versailles Airbnb Minimum Stay Requirements Analysis
Distribution of Listings by Minimum Night Requirement
1 Night
152 listings
24.2% of total
2 Nights
222 listings
35.4% of total
3 Nights
85 listings
13.6% of total
4-6 Nights
77 listings
12.3% of total
7-29 Nights
18 listings
2.9% of total
30+ Nights
73 listings
11.6% of total
Key Insights
- The most prevalent minimum stay requirement in Versailles is 2 Nights, adopted by 35.4% of listings. This highlights the market's preference for shorter, flexible bookings.
- A significant segment (11.6%) caters to monthly stays (30+ nights) in Versailles, pointing to opportunities in the extended-stay market.
Recommendations
- Align with the market by considering a 2 Nights minimum stay, as 35.4% of Versailles hosts use this setting.
- If feasible, allowing 1-night stays, especially midweek or during low season, could capture last-minute bookings, as only 24.2% currently do.
- Explore offering discounts for stays of 30+ nights to attract the 11.6% of the market seeking extended stays.
- Adjust minimum nights based on seasonality – potentially shorter during low season and longer during peak demand periods in Versailles.
Versailles Airbnb Cancellation Policy Trends Analysis (2025)
Super Strict 60 Days
1 listings
0.2% of total
Flexible
105 listings
23% of total
Moderate
166 listings
36.4% of total
Firm
95 listings
20.8% of total
Strict
89 listings
19.5% of total
Cancellation Policy Insights for Versailles
- The prevailing Airbnb cancellation policy trend in Versailles is Moderate, used by 36.4% of listings.
- There's a relatively balanced mix between guest-friendly (59.4%) and stricter (40.3%) policies, offering choices for different guest needs.
Recommendations for Hosts
- Consider adopting a Moderate policy to align with the 36.4% market standard in Versailles.
- Regularly review your cancellation policy against competitors and market demand shifts in Versailles.
Versailles STR Booking Lead Time Analysis (2025)
Average Booking Lead Time by Month
Booking Lead Time Insights for Versailles
- The overall average booking lead time for vacation rentals in Versailles is 50 days.
- Guests book furthest in advance for stays during July (average 123 days), likely coinciding with peak travel demand or local events.
- The shortest booking windows occur for stays in February (average 38 days), indicating more last-minute travel plans during this time.
- Seasonally, Summer (94 days avg.) sees the longest lead times, while Winter (43 days avg.) has the shortest, reflecting typical travel planning cycles.
Recommendations for Hosts
- Use the overall average lead time (50 days) as a baseline for your pricing and availability strategy in Versailles.
- For July stays, consider implementing length-of-stay discounts or slightly higher rates for bookings made less than 123 days out to capitalize on advance planning.
- Target marketing efforts for the Summer season well in advance (at least 94 days) to capture early planners.
- Monitor your own booking lead times against these Versailles averages to identify opportunities for dynamic pricing adjustments.
Popular & Essential Airbnb Amenities in Versailles (2025)
Amenity Prevalence
Amenity Insights for Versailles
- Essential amenities in Versailles that guests expect include: Wifi, Heating, Kitchen. Lacking these (any) could significantly impact bookings.
- Popular amenities like Hot water, Smoke alarm, Essentials are common but not universal. Offering these can provide a competitive edge.
Recommendations for Hosts
- Ensure your listing includes all essential amenities for Versailles: Wifi, Heating, Kitchen.
- Prioritize adding missing essentials: Wifi, Heating, Kitchen.
- Consider adding popular differentiators like Hot water or Smoke alarm to increase appeal.
- Highlight unique or less common amenities you offer (e.g., hot tub, dedicated workspace, EV charger) in your listing description and photos.
- Regularly check competitor amenities in Versailles to stay competitive.
Versailles Airbnb Guest Demographics & Profile Analysis (2025)
Guest Profile Summary for Versailles
- The typical guest profile for Airbnb in Versailles consists of a mix of domestic (48%) and international guests, with top international origins including United States, typically belonging to the Post-2000s (Gen Z/Alpha) group (50%), primarily speaking English or French.
- Domestic travelers account for 47.7% of guests.
- Key international markets include France (47.7%) and United States (13.7%).
- Top languages spoken are English (38.6%) followed by French (29.3%).
- A significant demographic segment is the Post-2000s (Gen Z/Alpha) group, representing 50% of guests.
Recommendations for Hosts
- Balance marketing efforts between domestic and international channels based on the guest mix.
- Tailor amenities and listing descriptions to appeal to the dominant Post-2000s (Gen Z/Alpha) demographic (e.g., highlight fast WiFi, smart home features, local guides).
- Highlight unique local experiences or amenities relevant to the primary guest profile.
- Consider seasonal promotions aligned with peak travel times for key origin markets.
Nearby Short-Term Rental Market Comparison
How does the Versailles Airbnb market stack up against its neighbors? Compare key performance metrics like average monthly revenue, ADR, and occupancy rates in surrounding areas to understand the broader regional STR landscape.
| Market | Active Properties | Monthly Revenue | Daily Rate | Avg. Occupancy |
|---|---|---|---|---|
| Morienval | 10 | $5,794 | $400.84 | 32% |
| Verdelot | 13 | $3,885 | $300.79 | 46% |
| Trigny | 10 | $3,775 | $248.19 | 46% |
| La Couture-Boussey | 12 | $3,620 | $378.08 | 28% |
| Dourdan | 15 | $3,576 | $223.06 | 52% |
| Rosoy-en-Multien | 15 | $3,558 | $367.61 | 51% |
| Millançay | 11 | $3,476 | $370.42 | 39% |
| Chaintreaux | 11 | $3,136 | $278.28 | 34% |
| Langon-sur-Cher | 12 | $3,127 | $400.27 | 35% |
| Mesnils-sur-Iton | 22 | $3,028 | $309.05 | 40% |