Saint-Mandé Airbnb Market Analysis 2025: Short Term Rental Data & Vacation Rental Statistics in Ile-de-France, France
Is Airbnb profitable in Saint-Mandé in 2025? Explore comprehensive Airbnb analytics for Saint-Mandé, Ile-de-France, France to uncover income potential. This 2025 STR market report for Saint-Mandé, based on AirROI data from April 2024 to March 2025, reveals key trends in the niche market of 163 active listings.
Whether you're considering an Airbnb investment in Saint-Mandé, optimizing your existing vacation rental, or exploring rental arbitrage opportunities, understanding the Saint-Mandé Airbnb data is crucial. Understanding the local regulations is key to maximizing your short term rental income potential. Let's dive into the specifics.
Key Saint-Mandé Airbnb Performance Metrics Overview
Monthly Airbnb Revenue Variations & Income Potential in Saint-Mandé (2025)
Understanding the monthly revenue variations for Airbnb listings in Saint-Mandé is key to maximizing your short term rental income potential. Seasonality significantly impacts earnings. Our analysis, based on data from the past 12 months, shows that the peak revenue month for STRs in Saint-Mandé is typically June, while March often presents the lowest earnings, highlighting opportunities for strategic pricing adjustments during shoulder and low seasons. Explore the typical Airbnb income in Saint-Mandé across different performance tiers:
- Best-in-class properties (Top 10%) achieve $5,385+ monthly, often utilizing dynamic pricing and superior guest experiences.
- Strong performing properties (Top 25%) earn $3,371 or more, indicating effective management and desirable locations/amenities.
- Typical properties (Median) generate around $1,982 per month, representing the average market performance.
- Entry-level properties (Bottom 25%) see earnings around $1,050, often with potential for optimization.
Average Monthly Airbnb Earnings Trend in Saint-Mandé
Saint-Mandé Airbnb Occupancy Rate Trends (2025)
Maximize your bookings by understanding the Saint-Mandé STR occupancy trends. Seasonal demand shifts significantly influence how often properties are booked. Typically, Octobersees the highest demand (peak season occupancy), while August experiences the lowest (low season). Effective strategies, like adjusting minimum stays or offering promotions, can boost occupancy during slower periods. Here's how different property tiers perform in Saint-Mandé:
- Best-in-class properties (Top 10%) achieve 87%+ occupancy, indicating high desirability and potentially optimized availability.
- Strong performing properties (Top 25%) maintain 72% or higher occupancy, suggesting good market fit and guest satisfaction.
- Typical properties (Median) have an occupancy rate around 47%.
- Entry-level properties (Bottom 25%) average 24% occupancy, potentially facing higher vacancy.
Average Monthly Occupancy Rate Trend in Saint-Mandé
Average Daily Rate (ADR) Airbnb Trends in Saint-Mandé (2025)
Effective short term rental pricing strategy in Saint-Mandé involves understanding monthly ADR fluctuations. The Average Daily Rate (ADR) for Airbnb in Saint-Mandé typically peaks in July and dips lowest during April. Leveraging Airbnb dynamic pricing tools or strategies based on this seasonality can significantly boost revenue. Here's a look at the typical nightly rates achieved:
- Best-in-class properties (Top 10%) command rates of $306+ per night, often due to premium features or locations.
- Strong performing properties (Top 25%) achieve nightly rates of $201 or more.
- Typical properties (Median) charge around $124 per night.
- Entry-level properties (Bottom 25%) earn around $86 per night.
Average Daily Rate (ADR) Trend by Month in Saint-Mandé
Get Live Saint-Mandé Market Intelligence 👇

Explore Real-time Analytics
Airbnb Seasonality Analysis & Trends in Saint-Mandé (2025)
Peak Season (June, May, April)
- Revenue averages $3,433 per month
- Occupancy rates average 53.8%
- Daily rates average $160
Shoulder Season
- Revenue averages $2,407 per month
- Occupancy maintains around 47.0%
- Daily rates hold near $165
Low Season (January, February, March)
- Revenue drops to average $1,801 per month
- Occupancy decreases to average 43.8%
- Daily rates adjust to average $160
Seasonality Insights for Saint-Mandé
- The Airbnb seasonality in Saint-Mandé shows highly seasonal trends requiring careful strategy. While the sections above show seasonal averages, it's also insightful to look at the extremes:
- During the high season, the absolute peak month showcases Saint-Mandé's highest earning potential, with monthly revenues capable of climbing to $3,513, occupancy reaching a high of 59.2%, and ADRs peaking at $175.
- Conversely, the slowest single month of the year, typically falling within the low season, marks the market's lowest point. In this month, revenue might dip to $1,661, occupancy could drop to 37.4%, and ADRs may adjust down to $157.
- Understanding both the seasonal averages and these monthly peaks and troughs in revenue, occupancy, and ADR is crucial for maximizing your Airbnb profit potential in Saint-Mandé.
Seasonal Strategies for Maximizing Profit
- Peak Season: Maximize revenue through premium pricing and potentially longer minimum stays. Ensure high availability.
- Low Season: Offer competitive pricing, special promotions (e.g., extended stay discounts), and flexible cancellation policies. Target off-season travelers like remote workers or budget-conscious guests.
- Shoulder Seasons: Implement dynamic pricing that balances peak and low rates. Target weekend travelers or specific events. Offer slightly more flexible terms than peak season.
- Regularly analyze your own performance against these Saint-Mandé seasonality benchmarks and adjust your pricing and availability strategy accordingly.
Best Areas for Airbnb Investment in Saint-Mandé (2025)
Exploring the top neighborhoods for short-term rentals in Saint-Mandé? This section highlights key areas, outlining why they are attractive for hosts and guests, along with notable local attractions. Consider these locations based on your target guest profile and investment strategy.
| Neighborhood / Area | Why Host Here? (Target Guests & Appeal) | Key Attractions & Landmarks |
|---|---|---|
| Parc Floral | A beautiful park known for its gardens and outdoor events, attracting families and nature lovers. Close to public transportation and offers a peaceful environment. | Parc Floral de Paris, Café de l'Orangerie, Festival Classique au Vert, Gardens of the Château de Vincennes |
| Saint-Mandé Town Center | The bustling heart of Saint-Mandé, filled with shops, cafes, and restaurants. It’s an ideal spot for visitors wanting to experience local life. | Place Charles Dauriac, Local markets, Cafés and Bistros |
| Bois de Vincennes | A large urban park perfect for outdoor activities such as jogging, biking, and picnicking. Attracts visitors looking for outdoor recreation. | Parc Zoologique de Paris, Lac de Saint-Mandé, Château de Vincennes, Boating activities |
| Metro Saint-Mandé - Tourelle | Conveniently located near the metro station, providing easy access to Paris. Ideal for travelers wanting to explore the city while enjoying a quieter neighborhood. | Quick access to Paris, Nearby restaurants, Cultural attractions, Shops |
| Bords de Marne | Picturesque riverside area, perfect for a relaxing stroll or a scenic bike ride along the Marne river. Popular for its charming landscapes. | Marne River promenade, Boating and kayaking, Parks, Local eateries |
| Rue du Puits Vert | A vibrant street known for its proximity to various restaurants and cafes, attracting both locals and tourists looking for authentic cuisine. | Local dining options, Shops, Cafes, Cultural events |
| Vincennes Forest | Located near the entrance of the Vincennes Forest, great for nature lovers and those seeking outdoor adventures. A unique selling point for eco-tourism. | Nature trails, Wildlife, Café in the forest |
| Saint-Mandé Arts District | An area showcasing local artists and cultural venues. Perfect for those interested in the arts and attending exhibitions and events. | Art galleries, Exhibition spaces, Cultural festivals |
Understanding Airbnb License Requirements & STR Laws in Saint-Mandé (2025)
With 18% of listings showing registration in 2025, understanding potential Airbnb license requirements is crucial in Saint-Mandé. Always verify the latest short term rental regulations and Airbnb license requirements directly with local government authorities for Saint-Mandé to ensure full compliance before hosting.
(Source: AirROI data, 2025, based on 18% licensed listings)
Top Performing Airbnb Properties in Saint-Mandé (2025)
Benchmark your potential! Explore examples of top-performing Airbnb properties in Saint-Mandébased on Trailing Twelve Month (TTM) revenue. Analyze their characteristics, revenue, occupancy rate, and ADR to understand what drives success in this market.

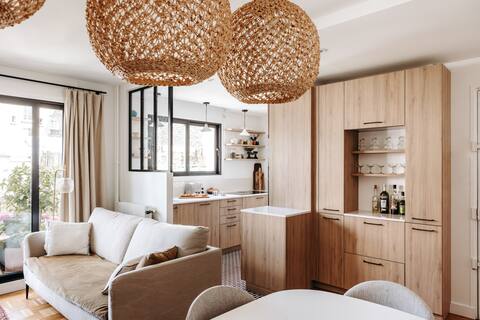
Charming parisian rooftop ! 120m2 for 8 people
Entire Place • 4 bedrooms
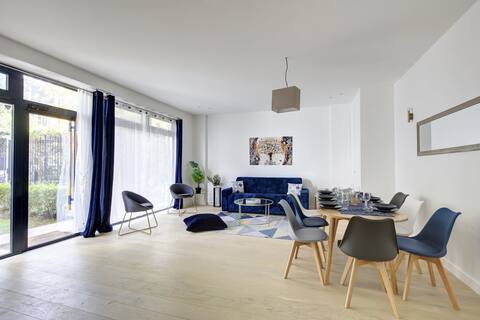
Very nice apartment 15’ Centre Paris
Entire Place • 2 bedrooms
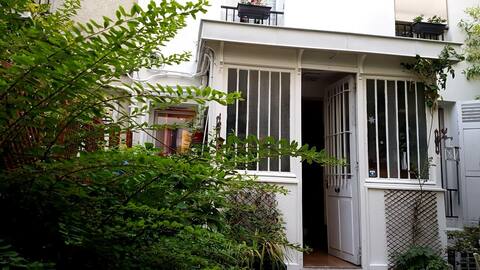
A house near the Bois
Entire Place • 3 bedrooms
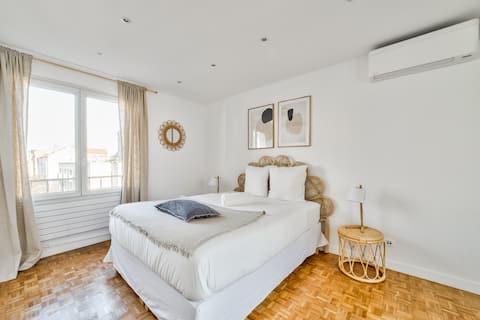
Beautiful terrace apartment 75m Paris
Entire Place • 2 bedrooms
328 Suite Nathaniel - Superb apartment in Paris
Entire Place • 3 bedrooms
Chic neighborhood close to Paris-Nice view-Quiet
Entire Place • 2 bedrooms
Note: Performance varies based on location, size, amenities, seasonality, and management quality. Data reflects the past 12 months.
Top Performing Airbnb Hosts in Saint-Mandé (2025)
Learn from the best! This table showcases top-performing Airbnb hosts in Saint-Mandé based on the number of properties managed and estimated total revenue over the past year. Analyze their scale and performance metrics.
| Host Name | Properties | Grossing Revenue | Stay Reviews | Avg Rating |
|---|---|---|---|---|
| Françoise | 1 | $82,452 | 134 | 4.92/5.0 |
| Amélie | 1 | $78,521 | 24 | 5.00/5.0 |
| Karine | 1 | $69,339 | 196 | 4.89/5.0 |
| Estelle | 2 | $69,226 | 58 | 4.99/5.0 |
| Francois | 1 | $68,383 | 30 | 4.93/5.0 |
| Cédric De ClickYourFlat | 1 | $66,343 | 57 | 4.65/5.0 |
| Johann | 1 | $63,903 | 25 | 4.96/5.0 |
| Host #6235909 | 1 | $62,287 | 0 | 0.00/5.0 |
| Sophie | 1 | $59,094 | 113 | 4.95/5.0 |
| Host #5391930 | 1 | $58,917 | 0 | 0.00/5.0 |
Analyzing the strategies of top hosts, such as their property selection, pricing, and guest communication, can offer valuable lessons for optimizing your own Airbnb operations in Saint-Mandé.
Dive Deeper: Advanced Saint-Mandé STR Market Data (2025)
Ready to unlock more insights? AirROI provides access to advanced metrics and comprehensive Airbnb data for Saint-Mandé. Explore detailed analytics beyond this report to refine your investment strategy, optimize pricing, and maximize your vacation rental profits.
Explore Advanced MetricsSaint-Mandé Short-Term Rental Market Composition (2025): Property & Room Types
Room Type Distribution
Property Type Distribution
Market Composition Insights for Saint-Mandé
- The Saint-Mandé Airbnb market composition is heavily skewed towards Entire Home/Apt listings, which make up 93.9% of the 163 active rentals. This indicates strong guest preference for privacy and space.
- Looking at the property type distribution in Saint-Mandé, Apartment/Condo properties are the most common (95.7%), reflecting the local real estate landscape.
- Smaller segments like house, hotel/boutique (combined 4.3%) offer potential for unique stay experiences.
Saint-Mandé Airbnb Room Capacity Analysis (2025): Bedroom Distribution
Distribution of Listings by Number of Bedrooms
Room Capacity Insights for Saint-Mandé
- The dominant room capacity in Saint-Mandé is 1 bedroom listings, making up 55.8% of the market. This suggests a strong demand for properties suitable for couples or solo travelers.
- Together, 1 bedroom and 2 bedrooms properties represent 79.7% of the active Airbnb listings in Saint-Mandé, indicating a high concentration in these sizes.
- With over half the market (55.8%) consisting of studios or 1-bedroom units, Saint-Mandé is particularly well-suited for individuals or couples.
- Listings with 3+ bedrooms (8.6%) represent a smaller niche, potentially indicating an underserved market for larger group accommodations in Saint-Mandé.
Saint-Mandé Vacation Rental Guest Capacity Trends (2025)
Distribution of Listings by Guest Capacity
Guest Capacity Insights for Saint-Mandé
- The most common guest capacity trend in Saint-Mandé vacation rentals is listings accommodating 4 guests (33.1%). This suggests the primary traveler segment is likely small families or groups.
- Properties designed for 4 guests and 2 guests dominate the Saint-Mandé STR market, accounting for 63.8% of listings.
- 13.5% of properties accommodate 6+ guests, serving the market segment for larger families or group travel in Saint-Mandé.
- On average, properties in Saint-Mandé are equipped to host 3.4 guests.
Saint-Mandé Airbnb Booking Patterns (2025): Available vs. Booked Days
Available Days Distribution
Booked Days Distribution
Booking Pattern Insights for Saint-Mandé
- The most common availability pattern in Saint-Mandé falls within the 271-366 days range, representing 50.3% of listings. This suggests many properties have significant open periods on their calendars.
- Approximately 75.5% of listings show high availability (181+ days open annually), indicating potential for increased bookings or specific owner usage patterns.
- For booked days, the 1-30 days range is most frequent in Saint-Mandé (25.8%), reflecting common guest stay durations or potential owner blocking patterns.
- A notable 26.4% of properties secure long booking periods (181+ days booked per year), highlighting successful long-term rental strategies or significant owner usage.
Saint-Mandé Airbnb Minimum Stay Requirements Analysis
Distribution of Listings by Minimum Night Requirement
1 Night
39 listings
27.5% of total
2 Nights
43 listings
30.3% of total
3 Nights
21 listings
14.8% of total
4-6 Nights
23 listings
16.2% of total
7-29 Nights
6 listings
4.2% of total
30+ Nights
10 listings
7% of total
Key Insights
- The most prevalent minimum stay requirement in Saint-Mandé is 2 Nights, adopted by 30.3% of listings. This highlights the market's preference for shorter, flexible bookings.
Recommendations
- Align with the market by considering a 2 Nights minimum stay, as 30.3% of Saint-Mandé hosts use this setting.
- If feasible, allowing 1-night stays, especially midweek or during low season, could capture last-minute bookings, as only 27.5% currently do.
- Explore offering discounts for stays of 30+ nights to attract the 7% of the market seeking extended stays.
- Adjust minimum nights based on seasonality – potentially shorter during low season and longer during peak demand periods in Saint-Mandé.
Saint-Mandé Airbnb Cancellation Policy Trends Analysis (2025)
Flexible
18 listings
18.6% of total
Moderate
36 listings
37.1% of total
Firm
16 listings
16.5% of total
Strict
27 listings
27.8% of total
Cancellation Policy Insights for Saint-Mandé
- The prevailing Airbnb cancellation policy trend in Saint-Mandé is Moderate, used by 37.1% of listings.
- There's a relatively balanced mix between guest-friendly (55.7%) and stricter (44.3%) policies, offering choices for different guest needs.
Recommendations for Hosts
- Consider adopting a Moderate policy to align with the 37.1% market standard in Saint-Mandé.
- Regularly review your cancellation policy against competitors and market demand shifts in Saint-Mandé.
Saint-Mandé STR Booking Lead Time Analysis (2025)
Average Booking Lead Time by Month
Booking Lead Time Insights for Saint-Mandé
- The overall average booking lead time for vacation rentals in Saint-Mandé is 48 days.
- Guests book furthest in advance for stays during July (average 107 days), likely coinciding with peak travel demand or local events.
- The shortest booking windows occur for stays in February (average 40 days), indicating more last-minute travel plans during this time.
- Seasonally, Summer (78 days avg.) sees the longest lead times, while Fall (43 days avg.) has the shortest, reflecting typical travel planning cycles.
Recommendations for Hosts
- Use the overall average lead time (48 days) as a baseline for your pricing and availability strategy in Saint-Mandé.
- For July stays, consider implementing length-of-stay discounts or slightly higher rates for bookings made less than 107 days out to capitalize on advance planning.
- Target marketing efforts for the Summer season well in advance (at least 78 days) to capture early planners.
- Monitor your own booking lead times against these Saint-Mandé averages to identify opportunities for dynamic pricing adjustments.
Popular & Essential Airbnb Amenities in Saint-Mandé (2025)
Amenity Prevalence
Amenity Insights for Saint-Mandé
- Essential amenities in Saint-Mandé that guests expect include: Wifi, Kitchen, Heating, Hot water. Lacking these (any) could significantly impact bookings.
- Popular amenities like Smoke alarm, Essentials, Washer are common but not universal. Offering these can provide a competitive edge.
Recommendations for Hosts
- Ensure your listing includes all essential amenities for Saint-Mandé: Wifi, Kitchen, Heating, Hot water.
- Prioritize adding missing essentials: Wifi, Kitchen, Heating, Hot water.
- Consider adding popular differentiators like Smoke alarm or Essentials to increase appeal.
- Highlight unique or less common amenities you offer (e.g., hot tub, dedicated workspace, EV charger) in your listing description and photos.
- Regularly check competitor amenities in Saint-Mandé to stay competitive.
Saint-Mandé Airbnb Guest Demographics & Profile Analysis (2025)
Guest Profile Summary for Saint-Mandé
- The typical guest profile for Airbnb in Saint-Mandé consists of a mix of domestic (39%) and international guests, with top international origins including United States, typically belonging to the Post-2000s (Gen Z/Alpha) group (50%), primarily speaking English or French.
- Domestic travelers account for 38.8% of guests.
- Key international markets include France (38.8%) and United States (11.2%).
- Top languages spoken are English (39.2%) followed by French (24.7%).
- A significant demographic segment is the Post-2000s (Gen Z/Alpha) group, representing 50% of guests.
Recommendations for Hosts
- Focus marketing internationally, particularly towards travelers from United States.
- Tailor amenities and listing descriptions to appeal to the dominant Post-2000s (Gen Z/Alpha) demographic (e.g., highlight fast WiFi, smart home features, local guides).
- Highlight unique local experiences or amenities relevant to the primary guest profile.
- Consider seasonal promotions aligned with peak travel times for key origin markets.
Nearby Short-Term Rental Market Comparison
How does the Saint-Mandé Airbnb market stack up against its neighbors? Compare key performance metrics like average monthly revenue, ADR, and occupancy rates in surrounding areas to understand the broader regional STR landscape.
| Market | Active Properties | Monthly Revenue | Daily Rate | Avg. Occupancy |
|---|---|---|---|---|
| Morienval | 10 | $5,794 | $400.84 | 32% |
| Verdelot | 13 | $3,885 | $300.79 | 46% |
| Trigny | 10 | $3,775 | $248.19 | 46% |
| La Couture-Boussey | 12 | $3,620 | $378.08 | 28% |
| Dourdan | 15 | $3,576 | $223.06 | 52% |
| Rosoy-en-Multien | 15 | $3,558 | $367.61 | 51% |
| Millançay | 11 | $3,476 | $370.42 | 39% |
| Chaintreaux | 11 | $3,136 | $278.28 | 34% |
| Langon-sur-Cher | 12 | $3,127 | $400.27 | 35% |
| Mesnils-sur-Iton | 22 | $3,028 | $309.05 | 40% |