Saint-Cloud Airbnb Market Analysis 2025: Short Term Rental Data & Vacation Rental Statistics in Ile-de-France, France
Is Airbnb profitable in Saint-Cloud in 2025? Explore comprehensive Airbnb analytics for Saint-Cloud, Ile-de-France, France to uncover income potential. This 2025 STR market report for Saint-Cloud, based on AirROI data from April 2024 to March 2025, reveals key trends in the market of 253 active listings.
Whether you're considering an Airbnb investment in Saint-Cloud, optimizing your existing vacation rental, or exploring rental arbitrage opportunities, understanding the Saint-Cloud Airbnb data is crucial. Leveraging the low regulation environment is key to maximizing your short term rental income potential. Let's dive into the specifics.
Key Saint-Cloud Airbnb Performance Metrics Overview
Monthly Airbnb Revenue Variations & Income Potential in Saint-Cloud (2025)
Understanding the monthly revenue variations for Airbnb listings in Saint-Cloud is key to maximizing your short term rental income potential. Seasonality significantly impacts earnings. Our analysis, based on data from the past 12 months, shows that the peak revenue month for STRs in Saint-Cloud is typically June, while February often presents the lowest earnings, highlighting opportunities for strategic pricing adjustments during shoulder and low seasons. Explore the typical Airbnb income in Saint-Cloud across different performance tiers:
- Best-in-class properties (Top 10%) achieve $4,998+ monthly, often utilizing dynamic pricing and superior guest experiences.
- Strong performing properties (Top 25%) earn $3,082 or more, indicating effective management and desirable locations/amenities.
- Typical properties (Median) generate around $1,807 per month, representing the average market performance.
- Entry-level properties (Bottom 25%) see earnings around $910, often with potential for optimization.
Average Monthly Airbnb Earnings Trend in Saint-Cloud
Saint-Cloud Airbnb Occupancy Rate Trends (2025)
Maximize your bookings by understanding the Saint-Cloud STR occupancy trends. Seasonal demand shifts significantly influence how often properties are booked. Typically, Octobersees the highest demand (peak season occupancy), while June experiences the lowest (low season). Effective strategies, like adjusting minimum stays or offering promotions, can boost occupancy during slower periods. Here's how different property tiers perform in Saint-Cloud:
- Best-in-class properties (Top 10%) achieve 82%+ occupancy, indicating high desirability and potentially optimized availability.
- Strong performing properties (Top 25%) maintain 65% or higher occupancy, suggesting good market fit and guest satisfaction.
- Typical properties (Median) have an occupancy rate around 40%.
- Entry-level properties (Bottom 25%) average 21% occupancy, potentially facing higher vacancy.
Average Monthly Occupancy Rate Trend in Saint-Cloud
Average Daily Rate (ADR) Airbnb Trends in Saint-Cloud (2025)
Effective short term rental pricing strategy in Saint-Cloud involves understanding monthly ADR fluctuations. The Average Daily Rate (ADR) for Airbnb in Saint-Cloud typically peaks in July and dips lowest during March. Leveraging Airbnb dynamic pricing tools or strategies based on this seasonality can significantly boost revenue. Here's a look at the typical nightly rates achieved:
- Best-in-class properties (Top 10%) command rates of $479+ per night, often due to premium features or locations.
- Strong performing properties (Top 25%) achieve nightly rates of $241 or more.
- Typical properties (Median) charge around $132 per night.
- Entry-level properties (Bottom 25%) earn around $90 per night.
Average Daily Rate (ADR) Trend by Month in Saint-Cloud
Get Live Saint-Cloud Market Intelligence 👇

Explore Real-time Analytics
Airbnb Seasonality Analysis & Trends in Saint-Cloud (2025)
Peak Season (June, July, May)
- Revenue averages $3,470 per month
- Occupancy rates average 40.1%
- Daily rates average $248
Shoulder Season
- Revenue averages $2,307 per month
- Occupancy maintains around 45.5%
- Daily rates hold near $231
Low Season (February, March, November)
- Revenue drops to average $1,675 per month
- Occupancy decreases to average 41.8%
- Daily rates adjust to average $206
Seasonality Insights for Saint-Cloud
- The Airbnb seasonality in Saint-Cloud shows highly seasonal trends requiring careful strategy. While the sections above show seasonal averages, it's also insightful to look at the extremes:
- During the high season, the absolute peak month showcases Saint-Cloud's highest earning potential, with monthly revenues capable of climbing to $3,547, occupancy reaching a high of 52.3%, and ADRs peaking at $257.
- Conversely, the slowest single month of the year, typically falling within the low season, marks the market's lowest point. In this month, revenue might dip to $1,598, occupancy could drop to 38.4%, and ADRs may adjust down to $199.
- Understanding both the seasonal averages and these monthly peaks and troughs in revenue, occupancy, and ADR is crucial for maximizing your Airbnb profit potential in Saint-Cloud.
Seasonal Strategies for Maximizing Profit
- Peak Season: Maximize revenue through premium pricing and potentially longer minimum stays. Ensure high availability.
- Low Season: Offer competitive pricing, special promotions (e.g., extended stay discounts), and flexible cancellation policies. Target off-season travelers like remote workers or budget-conscious guests.
- Shoulder Seasons: Implement dynamic pricing that balances peak and low rates. Target weekend travelers or specific events. Offer slightly more flexible terms than peak season.
- Regularly analyze your own performance against these Saint-Cloud seasonality benchmarks and adjust your pricing and availability strategy accordingly.
Best Areas for Airbnb Investment in Saint-Cloud (2025)
Exploring the top neighborhoods for short-term rentals in Saint-Cloud? This section highlights key areas, outlining why they are attractive for hosts and guests, along with notable local attractions. Consider these locations based on your target guest profile and investment strategy.
| Neighborhood / Area | Why Host Here? (Target Guests & Appeal) | Key Attractions & Landmarks |
|---|---|---|
| Parc de Saint Cloud | A beautiful park offering stunning views of Paris and lush greenery, perfect for tourists looking for a peaceful retreat close to the city. | Parc de Saint Cloud, Château de Saint-Cloud, Grand Canal, Orangerie, Rose Garden |
| Saint-Cloud City Center | The city center is vibrant and culturally rich, attracting visitors interested in local shops, cafes, and cultural attractions. | Église Saint-Cloud, Place des Trois Échelles, Cultural events, Local boutiques, Restaurants |
| Boulogne-Billancourt | Adjacent to Saint-Cloud, it's known for its residential charm and proximity to Paris, making it a desirable location for both tourists and business travelers. | Parc de Billancourt, Museum of Contemporary Art, Shopping centers, Restaurants along the Seine |
| La Défense | As the largest business district in Europe, La Défense attracts many business travelers and tourists seeking modern architecture and amenities. | Grande Arche, Les Quatre Temps shopping center, La Défense esplanade, Art installations |
| Seine River Walks | Offering scenic walks and views of the Seine river, this area is popular among those looking to enjoy Paris's romantic side. | Seine River, Various walking paths, Parks along the river, Cafes with river views |
| Versailles | Famous for its grand palace and gardens, Versailles attracts tourists who want to explore French history and architecture. | Palace of Versailles, Gardens of Versailles, Trianon Palaces, Versailles Market |
| Sèvres | Known for its porcelain and artistic heritage, this area appeals to visitors interested in art and craftsmanship, with a charming village atmosphere. | Sèvres Museum, Porcelain factories, Charming streets, Art galleries |
| Rueil-Malmaison | Rich in history with connections to Napoleon, this suburb offers historical sites and a peaceful suburban environment. | Château de Malmaison, Historical museums, Local parks, Restaurants |
Understanding Airbnb License Requirements & STR Laws in Saint-Cloud (2025)
While Saint-Cloud, Ile-de-France, France currently shows low STR regulations, specific Airbnb license requirements might still exist or change. Always verify the latest short term rental regulations and Airbnb license requirements directly with local government authorities for Saint-Cloud to ensure full compliance before hosting.
(Source: AirROI data, 2025, based on 4% licensed listings)
Top Performing Airbnb Properties in Saint-Cloud (2025)
Benchmark your potential! Explore examples of top-performing Airbnb properties in Saint-Cloudbased on Trailing Twelve Month (TTM) revenue. Analyze their characteristics, revenue, occupancy rate, and ADR to understand what drives success in this market.
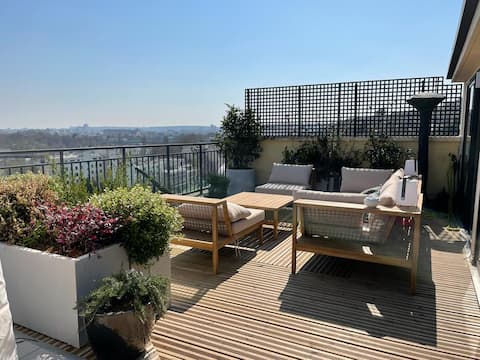
4 pers apartment - Terrace & Panoramic view
Entire Place • 2 bedrooms

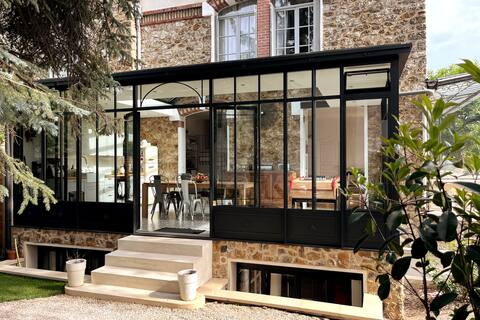
Greenery and tranquility at the gates of Paris
Entire Place • 5 bedrooms

Great house with panoramic view
Entire Place • 7 bedrooms
Villa M - St Cloud / Montretout
Entire Place • 5 bedrooms

Péniche de 180 m² près de Paris
Entire Place • 2 bedrooms

Apt with terrace Access Paris and LaDéfense Tramway
Entire Place • 2 bedrooms
Note: Performance varies based on location, size, amenities, seasonality, and management quality. Data reflects the past 12 months.
Top Performing Airbnb Hosts in Saint-Cloud (2025)
Learn from the best! This table showcases top-performing Airbnb hosts in Saint-Cloud based on the number of properties managed and estimated total revenue over the past year. Analyze their scale and performance metrics.
| Host Name | Properties | Grossing Revenue | Stay Reviews | Avg Rating |
|---|---|---|---|---|
| Severine | 1 | $109,564 | 15 | 5.00/5.0 |
| Karine | 1 | $105,583 | 65 | 4.91/5.0 |
| Emmanuel | 1 | $94,470 | 5 | 5.00/5.0 |
| Marion | 1 | $84,822 | 9 | 4.89/5.0 |
| Host #11168907 | 1 | $72,578 | 0 | 0.00/5.0 |
| Richard | 1 | $57,611 | 125 | 4.85/5.0 |
| Manon | 2 | $57,065 | 94 | 4.72/5.0 |
| Maxime | 4 | $55,230 | 165 | 4.47/5.0 |
| Sophie | 1 | $54,744 | 15 | 5.00/5.0 |
| Abby | 2 | $53,658 | 64 | 4.75/5.0 |
Analyzing the strategies of top hosts, such as their property selection, pricing, and guest communication, can offer valuable lessons for optimizing your own Airbnb operations in Saint-Cloud.
Dive Deeper: Advanced Saint-Cloud STR Market Data (2025)
Ready to unlock more insights? AirROI provides access to advanced metrics and comprehensive Airbnb data for Saint-Cloud. Explore detailed analytics beyond this report to refine your investment strategy, optimize pricing, and maximize your vacation rental profits.
Explore Advanced MetricsSaint-Cloud Short-Term Rental Market Composition (2025): Property & Room Types
Room Type Distribution
Property Type Distribution
Market Composition Insights for Saint-Cloud
- The Saint-Cloud Airbnb market composition is heavily skewed towards Entire Home/Apt listings, which make up 80.6% of the 253 active rentals. This indicates strong guest preference for privacy and space.
- Looking at the property type distribution in Saint-Cloud, Apartment/Condo properties are the most common (75.9%), reflecting the local real estate landscape.
- Houses represent a significant 17% portion, catering likely to families or larger groups.
- Smaller segments like outdoor/unique, hotel/boutique (combined 7.2%) offer potential for unique stay experiences.
Saint-Cloud Airbnb Room Capacity Analysis (2025): Bedroom Distribution
Distribution of Listings by Number of Bedrooms
Room Capacity Insights for Saint-Cloud
- The dominant room capacity in Saint-Cloud is 1 bedroom listings, making up 41.9% of the market. This suggests a strong demand for properties suitable for couples or solo travelers.
- Together, 1 bedroom and 2 bedrooms properties represent 64.4% of the active Airbnb listings in Saint-Cloud, indicating a high concentration in these sizes.
- A significant 20.2% of listings offer 3+ bedrooms, catering to larger groups and families seeking more space in Saint-Cloud.
Saint-Cloud Vacation Rental Guest Capacity Trends (2025)
Distribution of Listings by Guest Capacity
Guest Capacity Insights for Saint-Cloud
- The most common guest capacity trend in Saint-Cloud vacation rentals is listings accommodating 2 guests (27.7%). This suggests the primary traveler segment is likely couples or solo travelers.
- Properties designed for 2 guests and 4 guests dominate the Saint-Cloud STR market, accounting for 50.6% of listings.
- 19.8% of properties accommodate 6+ guests, serving the market segment for larger families or group travel in Saint-Cloud.
- On average, properties in Saint-Cloud are equipped to host 3.4 guests.
Saint-Cloud Airbnb Booking Patterns (2025): Available vs. Booked Days
Available Days Distribution
Booked Days Distribution
Booking Pattern Insights for Saint-Cloud
- The most common availability pattern in Saint-Cloud falls within the 271-366 days range, representing 56.5% of listings. This suggests many properties have significant open periods on their calendars.
- Approximately 81.4% of listings show high availability (181+ days open annually), indicating potential for increased bookings or specific owner usage patterns.
- For booked days, the 31-90 days range is most frequent in Saint-Cloud (29.2%), reflecting common guest stay durations or potential owner blocking patterns.
- A notable 18.9% of properties secure long booking periods (181+ days booked per year), highlighting successful long-term rental strategies or significant owner usage.
Saint-Cloud Airbnb Minimum Stay Requirements Analysis
Distribution of Listings by Minimum Night Requirement
1 Night
50 listings
23.5% of total
2 Nights
60 listings
28.2% of total
3 Nights
40 listings
18.8% of total
4-6 Nights
29 listings
13.6% of total
7-29 Nights
11 listings
5.2% of total
30+ Nights
23 listings
10.8% of total
Key Insights
- The most prevalent minimum stay requirement in Saint-Cloud is 2 Nights, adopted by 28.2% of listings. This highlights the market's preference for shorter, flexible bookings.
- A significant segment (10.8%) caters to monthly stays (30+ nights) in Saint-Cloud, pointing to opportunities in the extended-stay market.
Recommendations
- Align with the market by considering a 2 Nights minimum stay, as 28.2% of Saint-Cloud hosts use this setting.
- If feasible, allowing 1-night stays, especially midweek or during low season, could capture last-minute bookings, as only 23.5% currently do.
- Explore offering discounts for stays of 30+ nights to attract the 10.8% of the market seeking extended stays.
- Adjust minimum nights based on seasonality – potentially shorter during low season and longer during peak demand periods in Saint-Cloud.
Saint-Cloud Airbnb Cancellation Policy Trends Analysis (2025)
Flexible
47 listings
28.1% of total
Moderate
44 listings
26.3% of total
Firm
40 listings
24% of total
Strict
36 listings
21.6% of total
Cancellation Policy Insights for Saint-Cloud
- The prevailing Airbnb cancellation policy trend in Saint-Cloud is Flexible, used by 28.1% of listings.
- There's a relatively balanced mix between guest-friendly (54.4%) and stricter (45.6%) policies, offering choices for different guest needs.
Recommendations for Hosts
- Consider adopting a Flexible policy to align with the 28.1% market standard in Saint-Cloud.
- Regularly review your cancellation policy against competitors and market demand shifts in Saint-Cloud.
Saint-Cloud STR Booking Lead Time Analysis (2025)
Average Booking Lead Time by Month
Booking Lead Time Insights for Saint-Cloud
- The overall average booking lead time for vacation rentals in Saint-Cloud is 44 days.
- Guests book furthest in advance for stays during July (average 129 days), likely coinciding with peak travel demand or local events.
- The shortest booking windows occur for stays in March (average 35 days), indicating more last-minute travel plans during this time.
- Seasonally, Summer (96 days avg.) sees the longest lead times, while Winter (40 days avg.) has the shortest, reflecting typical travel planning cycles.
Recommendations for Hosts
- Use the overall average lead time (44 days) as a baseline for your pricing and availability strategy in Saint-Cloud.
- For July stays, consider implementing length-of-stay discounts or slightly higher rates for bookings made less than 129 days out to capitalize on advance planning.
- Target marketing efforts for the Summer season well in advance (at least 96 days) to capture early planners.
- Monitor your own booking lead times against these Saint-Cloud averages to identify opportunities for dynamic pricing adjustments.
Popular & Essential Airbnb Amenities in Saint-Cloud (2025)
Amenity Prevalence
Amenity Insights for Saint-Cloud
- Essential amenities in Saint-Cloud that guests expect include: Wifi. Lacking these (this) could significantly impact bookings.
- Popular amenities like Heating, Kitchen, Hot water are common but not universal. Offering these can provide a competitive edge.
Recommendations for Hosts
- Ensure your listing includes all essential amenities for Saint-Cloud: Wifi.
- Prioritize adding missing essentials: Wifi.
- Consider adding popular differentiators like Heating or Kitchen to increase appeal.
- Highlight unique or less common amenities you offer (e.g., hot tub, dedicated workspace, EV charger) in your listing description and photos.
- Regularly check competitor amenities in Saint-Cloud to stay competitive.
Saint-Cloud Airbnb Guest Demographics & Profile Analysis (2025)
Guest Profile Summary for Saint-Cloud
- The typical guest profile for Airbnb in Saint-Cloud consists of a mix of domestic (59%) and international guests, often arriving from nearby Paris, typically belonging to the Post-2000s (Gen Z/Alpha) group (50%), primarily speaking English or French.
- Domestic travelers account for 58.6% of guests.
- Key international markets include France (58.6%) and Germany (6%).
- Top languages spoken are English (37.5%) followed by French (30.8%).
- A significant demographic segment is the Post-2000s (Gen Z/Alpha) group, representing 50% of guests.
Recommendations for Hosts
- Balance marketing efforts between domestic and international channels based on the guest mix.
- Tailor amenities and listing descriptions to appeal to the dominant Post-2000s (Gen Z/Alpha) demographic (e.g., highlight fast WiFi, smart home features, local guides).
- Highlight unique local experiences or amenities relevant to the primary guest profile.
- Consider seasonal promotions aligned with peak travel times for key origin markets.
Nearby Short-Term Rental Market Comparison
How does the Saint-Cloud Airbnb market stack up against its neighbors? Compare key performance metrics like average monthly revenue, ADR, and occupancy rates in surrounding areas to understand the broader regional STR landscape.
| Market | Active Properties | Monthly Revenue | Daily Rate | Avg. Occupancy |
|---|---|---|---|---|
| Morienval | 10 | $5,794 | $400.84 | 32% |
| Verdelot | 13 | $3,885 | $300.79 | 46% |
| Trigny | 10 | $3,775 | $248.19 | 46% |
| La Couture-Boussey | 12 | $3,620 | $378.08 | 28% |
| Dourdan | 15 | $3,576 | $223.06 | 52% |
| Rosoy-en-Multien | 15 | $3,558 | $367.61 | 51% |
| Millançay | 11 | $3,476 | $370.42 | 39% |
| Chaintreaux | 11 | $3,136 | $278.28 | 34% |
| Langon-sur-Cher | 12 | $3,127 | $400.27 | 35% |
| Mesnils-sur-Iton | 22 | $3,028 | $309.05 | 40% |