Pontault-Combault Airbnb Market Analysis 2025: Short Term Rental Data & Vacation Rental Statistics in Ile-de-France, France
Is Airbnb profitable in Pontault-Combault in 2025? Explore comprehensive Airbnb analytics for Pontault-Combault, Ile-de-France, France to uncover income potential. This 2025 STR market report for Pontault-Combault, based on AirROI data from April 2024 to March 2025, reveals key trends in the niche market of 81 active listings.
Whether you're considering an Airbnb investment in Pontault-Combault, optimizing your existing vacation rental, or exploring rental arbitrage opportunities, understanding the Pontault-Combault Airbnb data is crucial. Leveraging the low regulation environment is key to maximizing your short term rental income potential. Let's dive into the specifics.
Key Pontault-Combault Airbnb Performance Metrics Overview
Monthly Airbnb Revenue Variations & Income Potential in Pontault-Combault (2025)
Understanding the monthly revenue variations for Airbnb listings in Pontault-Combault is key to maximizing your short term rental income potential. Seasonality significantly impacts earnings. Our analysis, based on data from the past 12 months, shows that the peak revenue month for STRs in Pontault-Combault is typically May, while March often presents the lowest earnings, highlighting opportunities for strategic pricing adjustments during shoulder and low seasons. Explore the typical Airbnb income in Pontault-Combault across different performance tiers:
- Best-in-class properties (Top 10%) achieve $3,463+ monthly, often utilizing dynamic pricing and superior guest experiences.
- Strong performing properties (Top 25%) earn $2,148 or more, indicating effective management and desirable locations/amenities.
- Typical properties (Median) generate around $1,211 per month, representing the average market performance.
- Entry-level properties (Bottom 25%) see earnings around $558, often with potential for optimization.
Average Monthly Airbnb Earnings Trend in Pontault-Combault
Pontault-Combault Airbnb Occupancy Rate Trends (2025)
Maximize your bookings by understanding the Pontault-Combault STR occupancy trends. Seasonal demand shifts significantly influence how often properties are booked. Typically, Maysees the highest demand (peak season occupancy), while March experiences the lowest (low season). Effective strategies, like adjusting minimum stays or offering promotions, can boost occupancy during slower periods. Here's how different property tiers perform in Pontault-Combault:
- Best-in-class properties (Top 10%) achieve 77%+ occupancy, indicating high desirability and potentially optimized availability.
- Strong performing properties (Top 25%) maintain 56% or higher occupancy, suggesting good market fit and guest satisfaction.
- Typical properties (Median) have an occupancy rate around 31%.
- Entry-level properties (Bottom 25%) average 15% occupancy, potentially facing higher vacancy.
Average Monthly Occupancy Rate Trend in Pontault-Combault
Average Daily Rate (ADR) Airbnb Trends in Pontault-Combault (2025)
Effective short term rental pricing strategy in Pontault-Combault involves understanding monthly ADR fluctuations. The Average Daily Rate (ADR) for Airbnb in Pontault-Combault typically peaks in August and dips lowest during October. Leveraging Airbnb dynamic pricing tools or strategies based on this seasonality can significantly boost revenue. Here's a look at the typical nightly rates achieved:
- Best-in-class properties (Top 10%) command rates of $202+ per night, often due to premium features or locations.
- Strong performing properties (Top 25%) achieve nightly rates of $138 or more.
- Typical properties (Median) charge around $89 per night.
- Entry-level properties (Bottom 25%) earn around $63 per night.
Average Daily Rate (ADR) Trend by Month in Pontault-Combault
Get Live Pontault-Combault Market Intelligence 👇

Explore Real-time Analytics
Airbnb Seasonality Analysis & Trends in Pontault-Combault (2025)
Peak Season (May, June, April)
- Revenue averages $2,563 per month
- Occupancy rates average 37.2%
- Daily rates average $121
Shoulder Season
- Revenue averages $1,476 per month
- Occupancy maintains around 39.8%
- Daily rates hold near $127
Low Season (January, February, March)
- Revenue drops to average $918 per month
- Occupancy decreases to average 31.1%
- Daily rates adjust to average $125
Seasonality Insights for Pontault-Combault
- The Airbnb seasonality in Pontault-Combault shows highly seasonal trends requiring careful strategy. While the sections above show seasonal averages, it's also insightful to look at the extremes:
- During the high season, the absolute peak month showcases Pontault-Combault's highest earning potential, with monthly revenues capable of climbing to $2,865, occupancy reaching a high of 46.7%, and ADRs peaking at $136.
- Conversely, the slowest single month of the year, typically falling within the low season, marks the market's lowest point. In this month, revenue might dip to $854, occupancy could drop to 27.2%, and ADRs may adjust down to $115.
- Understanding both the seasonal averages and these monthly peaks and troughs in revenue, occupancy, and ADR is crucial for maximizing your Airbnb profit potential in Pontault-Combault.
Seasonal Strategies for Maximizing Profit
- Peak Season: Maximize revenue through premium pricing and potentially longer minimum stays. Ensure high availability.
- Low Season: Offer competitive pricing, special promotions (e.g., extended stay discounts), and flexible cancellation policies. Target off-season travelers like remote workers or budget-conscious guests.
- Shoulder Seasons: Implement dynamic pricing that balances peak and low rates. Target weekend travelers or specific events. Offer slightly more flexible terms than peak season.
- Regularly analyze your own performance against these Pontault-Combault seasonality benchmarks and adjust your pricing and availability strategy accordingly.
Best Areas for Airbnb Investment in Pontault-Combault (2025)
Exploring the top neighborhoods for short-term rentals in Pontault-Combault? This section highlights key areas, outlining why they are attractive for hosts and guests, along with notable local attractions. Consider these locations based on your target guest profile and investment strategy.
| Neighborhood / Area | Why Host Here? (Target Guests & Appeal) | Key Attractions & Landmarks |
|---|---|---|
| Centre-ville | The center of Pontault-Combault features various shops, cafés, and services, making it an attractive place for visitors. It's conveniently located near public transportation, providing easy access to Paris and other attractions in the Île-de-France region. | Town Hall, Maurice Béjart Park, Pontault-Combault Market, Café Le Saint Georges, Public Library |
| Les Noyers | A quiet residential area that appeals to families and longer-term visitors looking for comfort and amenities. It has good parks and a community feel, making it desirable for those wanting a restful stay. | Parc des Noyers, Local restaurants, Nearby schools, Family-friendly amenities |
| Gretz-Armainvilliers | Just a short distance from Pontault-Combault, Gretz-Armainvilliers offers a serene environment with beautiful green spaces. Ideal for tourists interested in nature and outdoor activities, while still being close to the city. | Parc de la Mairie, Lac de la Reine, Historic countryside views, Local hiking trails |
| La Gare | This area has a strong connection to public transport with its train station, making it easy for tourists to explore the surrounding areas, including easy access to Paris. It is a great option for business travelers and those on short trips. | Train station, Cafés and brasseries, Shopping options, Convenient transport links |
| Quartier des Fleurs | Known for its residential charm and green spaces, this peaceful neighborhood appeals to visitors seeking a retreat. It offers the comfort of a home away from home with access to parks and local shops. | Parc de la Fosse, Flower markets, Family-friendly atmosphere, Local bakeries and shops |
| Les Saisons | A modern neighborhood with newer developments, attracting young professionals and modern families looking for trendy living spaces. It has various amenities and is within reach of educational institutions. | Modern amenities, Retail outlets, Cafés and bistros, Community events |
| Parc de la Bourdinière | This area is noted for its spacious parks and recreational opportunities, making it ideal for families and nature enthusiasts. It's a calm area well-suited for longer-term visitors. | Parc de la Bourdinière, Outdoor sporting facilities, Scenic walking paths, Playgrounds for children |
| Boulevard de l'Europe | A bustling area with various shops, restaurants, and cafes, making it popular among tourists who want a lively environment. It offers easy access to transport links and local attractions. | Shopping centers, Dining options, Public transport access, Vibrant street life |
Understanding Airbnb License Requirements & STR Laws in Pontault-Combault (2025)
While Pontault-Combault, Ile-de-France, France currently shows low STR regulations, specific Airbnb license requirements might still exist or change. Always verify the latest short term rental regulations and Airbnb license requirements directly with local government authorities for Pontault-Combault to ensure full compliance before hosting.
(Source: AirROI data, 2025, based on 9% licensed listings)
Top Performing Airbnb Properties in Pontault-Combault (2025)
Benchmark your potential! Explore examples of top-performing Airbnb properties in Pontault-Combaultbased on Trailing Twelve Month (TTM) revenue. Analyze their characteristics, revenue, occupancy rate, and ADR to understand what drives success in this market.
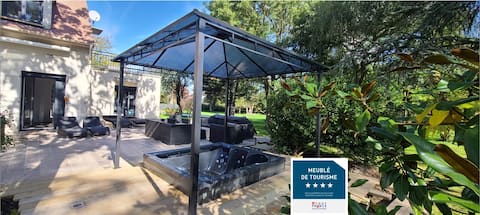
16pers - 240m2 - 3800m2 garden - 6 seater hot tub
Entire Place • 5 bedrooms
240m2 - 3800m2 jardin - jacuzzi 6 places - 16pers
Entire Place • 5 bedrooms

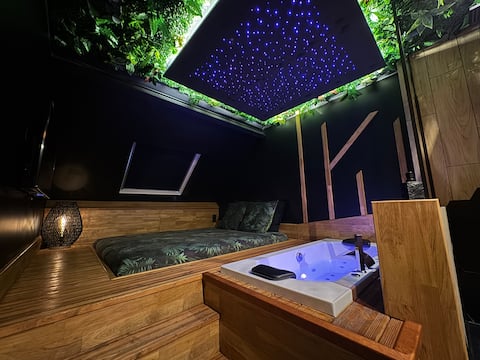
Diamond Suite, one night under the stars.
Entire Place • 1 bedroom
Need'Amour - Hot Tub - Close to Disney
Entire Place • 1 bedroom
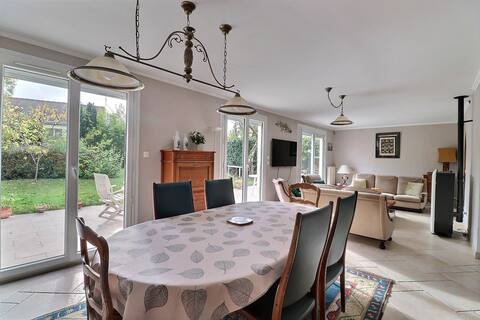
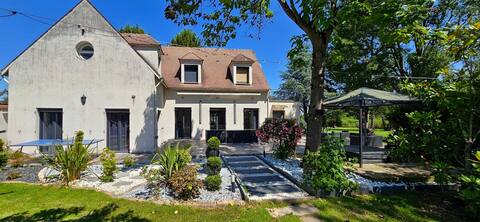
Family home near Disney and Vallée Village
Entire Place • 3 bedrooms
Disney⭐Paris🤩10pers⭐cocoon😍Netflix😍Air-conditioned
Entire Place • 3 bedrooms
Note: Performance varies based on location, size, amenities, seasonality, and management quality. Data reflects the past 12 months.
Top Performing Airbnb Hosts in Pontault-Combault (2025)
Learn from the best! This table showcases top-performing Airbnb hosts in Pontault-Combault based on the number of properties managed and estimated total revenue over the past year. Analyze their scale and performance metrics.
| Host Name | Properties | Grossing Revenue | Stay Reviews | Avg Rating |
|---|---|---|---|---|
| Sci | 3 | $95,284 | 55 | 4.65/5.0 |
| Audrey | 5 | $88,152 | 86 | 4.83/5.0 |
| Karine Et Julien | 2 | $70,257 | 232 | 4.94/5.0 |
| Suite Diamant | 1 | $53,566 | 22 | 5.00/5.0 |
| Sophie | 1 | $34,348 | 29 | 5.00/5.0 |
| Shayram | 2 | $32,520 | 36 | 4.54/5.0 |
| Nina-Naty Et Christian | 1 | $31,422 | 480 | 4.71/5.0 |
| Chloe | 1 | $28,721 | 47 | 4.55/5.0 |
| Secret Dreams | 2 | $28,607 | 189 | 4.95/5.0 |
| Amaury | 2 | $28,293 | 13 | 4.48/5.0 |
Analyzing the strategies of top hosts, such as their property selection, pricing, and guest communication, can offer valuable lessons for optimizing your own Airbnb operations in Pontault-Combault.
Dive Deeper: Advanced Pontault-Combault STR Market Data (2025)
Ready to unlock more insights? AirROI provides access to advanced metrics and comprehensive Airbnb data for Pontault-Combault. Explore detailed analytics beyond this report to refine your investment strategy, optimize pricing, and maximize your vacation rental profits.
Explore Advanced MetricsPontault-Combault Short-Term Rental Market Composition (2025): Property & Room Types
Room Type Distribution
Property Type Distribution
Market Composition Insights for Pontault-Combault
- The Pontault-Combault Airbnb market composition is heavily skewed towards Entire Home/Apt listings, which make up 85.2% of the 81 active rentals. This indicates strong guest preference for privacy and space.
- Looking at the property type distribution in Pontault-Combault, Apartment/Condo properties are the most common (54.3%), reflecting the local real estate landscape.
- Houses represent a significant 38.3% portion, catering likely to families or larger groups.
- Smaller segments like others, hotel/boutique (combined 7.4%) offer potential for unique stay experiences.
Pontault-Combault Airbnb Room Capacity Analysis (2025): Bedroom Distribution
Distribution of Listings by Number of Bedrooms
Room Capacity Insights for Pontault-Combault
- The dominant room capacity in Pontault-Combault is 1 bedroom listings, making up 50.6% of the market. This suggests a strong demand for properties suitable for couples or solo travelers.
- Together, 1 bedroom and 2 bedrooms properties represent 65.4% of the active Airbnb listings in Pontault-Combault, indicating a high concentration in these sizes.
- With over half the market (50.6%) consisting of studios or 1-bedroom units, Pontault-Combault is particularly well-suited for individuals or couples.
Pontault-Combault Vacation Rental Guest Capacity Trends (2025)
Distribution of Listings by Guest Capacity
Guest Capacity Insights for Pontault-Combault
- The most common guest capacity trend in Pontault-Combault vacation rentals is listings accommodating 4 guests (30.9%). This suggests the primary traveler segment is likely small families or groups.
- Properties designed for 4 guests and 2 guests dominate the Pontault-Combault STR market, accounting for 56.8% of listings.
- 25.9% of properties accommodate 6+ guests, serving the market segment for larger families or group travel in Pontault-Combault.
- On average, properties in Pontault-Combault are equipped to host 3.9 guests.
Pontault-Combault Airbnb Booking Patterns (2025): Available vs. Booked Days
Available Days Distribution
Booked Days Distribution
Booking Pattern Insights for Pontault-Combault
- The most common availability pattern in Pontault-Combault falls within the 271-366 days range, representing 50.6% of listings. This suggests many properties have significant open periods on their calendars.
- Approximately 83.9% of listings show high availability (181+ days open annually), indicating potential for increased bookings or specific owner usage patterns.
- For booked days, the 31-90 days range is most frequent in Pontault-Combault (34.6%), reflecting common guest stay durations or potential owner blocking patterns.
- A notable 17.3% of properties secure long booking periods (181+ days booked per year), highlighting successful long-term rental strategies or significant owner usage.
Pontault-Combault Airbnb Minimum Stay Requirements Analysis
Distribution of Listings by Minimum Night Requirement
1 Night
34 listings
50% of total
2 Nights
18 listings
26.5% of total
3 Nights
5 listings
7.4% of total
4-6 Nights
2 listings
2.9% of total
7-29 Nights
1 listings
1.5% of total
30+ Nights
8 listings
11.8% of total
Key Insights
- The most prevalent minimum stay requirement in Pontault-Combault is 1 Night, adopted by 50% of listings. This highlights the market's preference for shorter, flexible bookings.
- A strong majority (76.5%) of the Pontault-Combault Airbnb data shows acceptance of very short stays (1-2 nights), indicating a dynamic, high-turnover market.
- A significant segment (11.8%) caters to monthly stays (30+ nights) in Pontault-Combault, pointing to opportunities in the extended-stay market.
Recommendations
- Align with the market by considering a 1 Night minimum stay, as 50% of Pontault-Combault hosts use this setting.
- Explore offering discounts for stays of 30+ nights to attract the 11.8% of the market seeking extended stays.
- Adjust minimum nights based on seasonality – potentially shorter during low season and longer during peak demand periods in Pontault-Combault.
Pontault-Combault Airbnb Cancellation Policy Trends Analysis (2025)
Flexible
18 listings
26.9% of total
Moderate
20 listings
29.9% of total
Firm
11 listings
16.4% of total
Strict
18 listings
26.9% of total
Cancellation Policy Insights for Pontault-Combault
- The prevailing Airbnb cancellation policy trend in Pontault-Combault is Moderate, used by 29.9% of listings.
- There's a relatively balanced mix between guest-friendly (56.8%) and stricter (43.3%) policies, offering choices for different guest needs.
Recommendations for Hosts
- Consider adopting a Moderate policy to align with the 29.9% market standard in Pontault-Combault.
- Regularly review your cancellation policy against competitors and market demand shifts in Pontault-Combault.
Pontault-Combault STR Booking Lead Time Analysis (2025)
Average Booking Lead Time by Month
Booking Lead Time Insights for Pontault-Combault
- The overall average booking lead time for vacation rentals in Pontault-Combault is 39 days.
- Guests book furthest in advance for stays during July (average 129 days), likely coinciding with peak travel demand or local events.
- The shortest booking windows occur for stays in October (average 20 days), indicating more last-minute travel plans during this time.
- Seasonally, Summer (86 days avg.) sees the longest lead times, while Fall (25 days avg.) has the shortest, reflecting typical travel planning cycles.
Recommendations for Hosts
- Use the overall average lead time (39 days) as a baseline for your pricing and availability strategy in Pontault-Combault.
- For July stays, consider implementing length-of-stay discounts or slightly higher rates for bookings made less than 129 days out to capitalize on advance planning.
- Target marketing efforts for the Summer season well in advance (at least 86 days) to capture early planners.
- Monitor your own booking lead times against these Pontault-Combault averages to identify opportunities for dynamic pricing adjustments.
Popular & Essential Airbnb Amenities in Pontault-Combault (2025)
Amenity Prevalence
Amenity Insights for Pontault-Combault
- Essential amenities in Pontault-Combault that guests expect include: TV. Lacking these (this) could significantly impact bookings.
- Popular amenities like Kitchen, Wifi, Smoke alarm are common but not universal. Offering these can provide a competitive edge.
- Warning: Wifi is not universally provided but is considered essential globally. Ensure reliable Wifi is offered.
Recommendations for Hosts
- Ensure your listing includes all essential amenities for Pontault-Combault: TV.
- Prioritize adding missing essentials: TV.
- Consider adding popular differentiators like Kitchen or Wifi to increase appeal.
- Highlight unique or less common amenities you offer (e.g., hot tub, dedicated workspace, EV charger) in your listing description and photos.
- Regularly check competitor amenities in Pontault-Combault to stay competitive.
Pontault-Combault Airbnb Guest Demographics & Profile Analysis (2025)
Guest Profile Summary for Pontault-Combault
- The typical guest profile for Airbnb in Pontault-Combault consists of primarily domestic travelers (78%), often arriving from nearby Paris, typically belonging to the Post-2000s (Gen Z/Alpha) group (50%), primarily speaking French or English.
- Domestic travelers account for 78.4% of guests.
- Key international markets include France (78.4%) and Germany (3.6%).
- Top languages spoken are French (43%) followed by English (28.2%).
- A significant demographic segment is the Post-2000s (Gen Z/Alpha) group, representing 50% of guests.
Recommendations for Hosts
- Target domestic marketing efforts towards travelers from Paris and Pontault-Combault.
- Tailor amenities and listing descriptions to appeal to the dominant Post-2000s (Gen Z/Alpha) demographic (e.g., highlight fast WiFi, smart home features, local guides).
- Highlight unique local experiences or amenities relevant to the primary guest profile.
- Consider seasonal promotions aligned with peak travel times for key origin markets.
Nearby Short-Term Rental Market Comparison
How does the Pontault-Combault Airbnb market stack up against its neighbors? Compare key performance metrics like average monthly revenue, ADR, and occupancy rates in surrounding areas to understand the broader regional STR landscape.
| Market | Active Properties | Monthly Revenue | Daily Rate | Avg. Occupancy |
|---|---|---|---|---|
| Morienval | 10 | $5,794 | $400.84 | 32% |
| Verdelot | 13 | $3,885 | $300.79 | 46% |
| Trigny | 10 | $3,775 | $248.19 | 46% |
| La Couture-Boussey | 12 | $3,620 | $378.08 | 28% |
| Dourdan | 15 | $3,576 | $223.06 | 52% |
| Rosoy-en-Multien | 15 | $3,558 | $367.61 | 51% |
| Millançay | 11 | $3,476 | $370.42 | 39% |
| Chaintreaux | 11 | $3,136 | $278.28 | 34% |
| Langon-sur-Cher | 12 | $3,127 | $400.27 | 35% |
| Mesnils-sur-Iton | 22 | $3,028 | $309.05 | 40% |