Paris Airbnb Market Analysis 2025: Short Term Rental Data & Vacation Rental Statistics in Ile-de-France, France
Is Airbnb profitable in Paris in 2025? Explore comprehensive Airbnb analytics for Paris, Ile-de-France, France to uncover income potential. This 2025 STR market report for Paris, based on AirROI data from April 2024 to March 2025, reveals key trends in the bustling market of 44,683 active listings.
Whether you're considering an Airbnb investment in Paris, optimizing your existing vacation rental, or exploring rental arbitrage opportunities, understanding the Paris Airbnb data is crucial. Navigating the high regulation landscape is key to maximizing your short term rental income potential. Let's dive into the specifics.
Key Paris Airbnb Performance Metrics Overview
Monthly Airbnb Revenue Variations & Income Potential in Paris (2025)
Understanding the monthly revenue variations for Airbnb listings in Paris is key to maximizing your short term rental income potential. Seasonality significantly impacts earnings. Our analysis, based on data from the past 12 months, shows that the peak revenue month for STRs in Paris is typically May, while February often presents the lowest earnings, highlighting opportunities for strategic pricing adjustments during shoulder and low seasons. Explore the typical Airbnb income in Paris across different performance tiers:
- Best-in-class properties (Top 10%) achieve $8,744+ monthly, often utilizing dynamic pricing and superior guest experiences.
- Strong performing properties (Top 25%) earn $5,213 or more, indicating effective management and desirable locations/amenities.
- Typical properties (Median) generate around $3,016 per month, representing the average market performance.
- Entry-level properties (Bottom 25%) see earnings around $1,545, often with potential for optimization.
Average Monthly Airbnb Earnings Trend in Paris
Paris Airbnb Occupancy Rate Trends (2025)
Maximize your bookings by understanding the Paris STR occupancy trends. Seasonal demand shifts significantly influence how often properties are booked. Typically, Octobersees the highest demand (peak season occupancy), while August experiences the lowest (low season). Effective strategies, like adjusting minimum stays or offering promotions, can boost occupancy during slower periods. Here's how different property tiers perform in Paris:
- Best-in-class properties (Top 10%) achieve 90%+ occupancy, indicating high desirability and potentially optimized availability.
- Strong performing properties (Top 25%) maintain 77% or higher occupancy, suggesting good market fit and guest satisfaction.
- Typical properties (Median) have an occupancy rate around 51%.
- Entry-level properties (Bottom 25%) average 23% occupancy, potentially facing higher vacancy.
Average Monthly Occupancy Rate Trend in Paris
Average Daily Rate (ADR) Airbnb Trends in Paris (2025)
Effective short term rental pricing strategy in Paris involves understanding monthly ADR fluctuations. The Average Daily Rate (ADR) for Airbnb in Paris typically peaks in July and dips lowest during February. Leveraging Airbnb dynamic pricing tools or strategies based on this seasonality can significantly boost revenue. Here's a look at the typical nightly rates achieved:
- Best-in-class properties (Top 10%) command rates of $471+ per night, often due to premium features or locations.
- Strong performing properties (Top 25%) achieve nightly rates of $284 or more.
- Typical properties (Median) charge around $171 per night.
- Entry-level properties (Bottom 25%) earn around $111 per night.
Average Daily Rate (ADR) Trend by Month in Paris
Get Live Paris Market Intelligence 👇

Explore Real-time Analytics
Airbnb Seasonality Analysis & Trends in Paris (2025)
Peak Season (May, June, April)
- Revenue averages $5,304 per month
- Occupancy rates average 52.6%
- Daily rates average $243
Shoulder Season
- Revenue averages $4,086 per month
- Occupancy maintains around 51.0%
- Daily rates hold near $249
Low Season (January, February, March)
- Revenue drops to average $3,221 per month
- Occupancy decreases to average 46.5%
- Daily rates adjust to average $239
Seasonality Insights for Paris
- The Airbnb seasonality in Paris shows moderate seasonality with distinct peak and low periods. While the sections above show seasonal averages, it's also insightful to look at the extremes:
- During the high season, the absolute peak month showcases Paris's highest earning potential, with monthly revenues capable of climbing to $5,521, occupancy reaching a high of 59.2%, and ADRs peaking at $263.
- Conversely, the slowest single month of the year, typically falling within the low season, marks the market's lowest point. In this month, revenue might dip to $2,899, occupancy could drop to 42.7%, and ADRs may adjust down to $236.
- Understanding both the seasonal averages and these monthly peaks and troughs in revenue, occupancy, and ADR is crucial for maximizing your Airbnb profit potential in Paris.
Seasonal Strategies for Maximizing Profit
- Peak Season: Maximize revenue through premium pricing and potentially longer minimum stays. Ensure high availability.
- Low Season: Offer competitive pricing, special promotions (e.g., extended stay discounts), and flexible cancellation policies. Target off-season travelers like remote workers or budget-conscious guests.
- Shoulder Seasons: Implement dynamic pricing that balances peak and low rates. Target weekend travelers or specific events. Offer slightly more flexible terms than peak season.
- Regularly analyze your own performance against these Paris seasonality benchmarks and adjust your pricing and availability strategy accordingly.
Best Areas for Airbnb Investment in Paris (2025)
Exploring the top neighborhoods for short-term rentals in Paris? This section highlights key areas, outlining why they are attractive for hosts and guests, along with notable local attractions. Consider these locations based on your target guest profile and investment strategy.
| Neighborhood / Area | Why Host Here? (Target Guests & Appeal) | Key Attractions & Landmarks |
|---|---|---|
| Montmartre | A historic district known for its bohemian atmosphere, breathtaking views, and the iconic Sacré-Cœur Basilica. Montmartre attracts artists, tourists, and those seeking charm and character in Paris. | Sacré-Cœur Basilica, Place du Tertre, Espace Dalí, Montmartre Museum, Moulin Rouge |
| Le Marais | A trendy neighborhood celebrated for its historic architecture, vibrant nightlife, and eclectic boutiques. Le Marais is popular with both tourists and locals looking for culture, shopping, and dining. | Place des Vosges, Picasso Museum, Jewish Quarter, Shopping on Rue des Francs-Bourgeois, Carnavalet Museum |
| Saint-Germain-des-Prés | Known for its intellectual history and chic cafes, this area is a cultural hub that draws tourists seeking art, literature, and the classic Parisian experience. | Café de Flore, Les Deux Magots, Saint-Sulpice Church, Luxembourg Gardens, Musée Delacroix |
| Latin Quarter | Famous for its student life and vibrant atmosphere, the Latin Quarter offers a mix of history, education, and lively entertainment, attracting young travelers and scholars alike. | Sorbonne University, Panthéon, Rue Mouffetard, Jardin des Plantes, Musée de Cluny |
| Champs-Élysées | One of the most famous avenues in the world, Champs-Élysées is a prime location for tourists seeking luxury shopping, dining, and iconic attractions like the Arc de Triomphe. | Arc de Triomphe, Lido de Paris, Grand Palais, Champs-Élysées gardens, cinemas and theaters |
| Canal Saint-Martin | A picturesque area with trendy shops and cafes beside a scenic canal, Canal Saint-Martin is popular with young Parisian locals and tourists looking for a relaxed atmosphere. | Canal Saint-Martin, Le roi de L’Inde, Café Prune, Église Saint-Martin, Pavillon des Canaux |
| Belleville | A vibrant and diverse neighborhood known for its multicultural atmosphere, street art, and panoramic views of Paris. It appeals to those interested in an authentic Parisian experience. | Parc de Belleville, Belleville Street Art, Café des Musées, La Bellevilloise, Buttes-Chaumont Park |
| Bastille | A lively area known for its nightlife, Bastille is filled with bars, restaurants, and the historic Opera Bastille, attracting a younger crowd and those looking for a fun evening. | Place de la Bastille, Opera Bastille, Marché Bastille, Cafés and nightlife, Promenade Plantée |
Understanding Airbnb License Requirements & STR Laws in Paris (2025)
Yes, Paris, Ile-de-France, France enforces high STR regulations. Obtaining a license and ensuring compliance is almost certainly required according to current 2025 STR laws. Always verify the latest short term rental regulations and Airbnb license requirements directly with local government authorities for Paris to ensure full compliance before hosting.
(Source: AirROI data, 2025, based on 64% licensed listings)
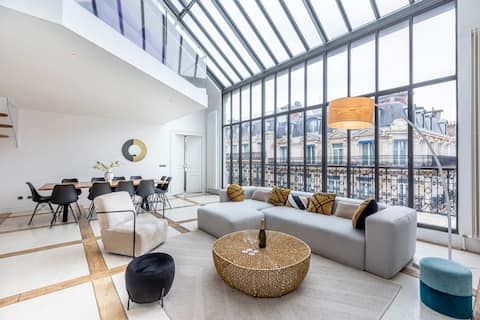
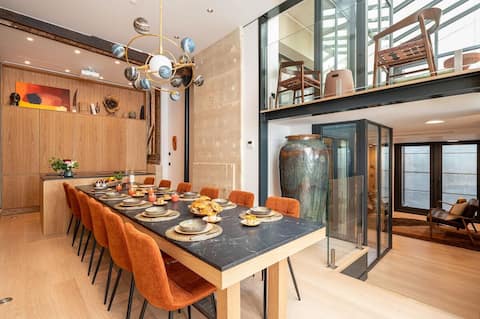
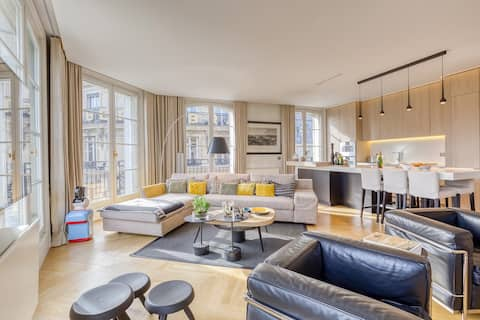
Top Performing Airbnb Properties in Paris (2025)
Benchmark your potential! Explore examples of top-performing Airbnb properties in Parisbased on Trailing Twelve Month (TTM) revenue. Analyze their characteristics, revenue, occupancy rate, and ADR to understand what drives success in this market.
Sweett | Boccador V
Entire Place • 5 bedrooms

Outstanding 7 bedrooms apartment in Montorgueil
Entire Place • 7 bedrooms

Luxurious 250m² 7BR at Galeries Lafayette - Rare
Entire Place • 7 bedrooms

StGermain Odeon Penthouse Terrace View AC!!! (5BR)
Entire Place • 5 bedrooms
My Skydome in Paris
Entire Place • 4 bedrooms
Saint Michel elegant flat 3 BR
Entire Place • 3 bedrooms
Note: Performance varies based on location, size, amenities, seasonality, and management quality. Data reflects the past 12 months.
Top Performing Airbnb Hosts in Paris (2025)
Learn from the best! This table showcases top-performing Airbnb hosts in Paris based on the number of properties managed and estimated total revenue over the past year. Analyze their scale and performance metrics.
| Host Name | Properties | Grossing Revenue | Stay Reviews | Avg Rating |
|---|---|---|---|---|
| Sweett | 143 | $16,434,233 | 5081 | 3.95/5.0 |
| Studioprestige | 160 | $14,790,393 | 5835 | 4.49/5.0 |
| Merveil | 95 | $14,279,260 | 4094 | 4.28/5.0 |
| David Et Warren | 190 | $13,774,831 | 5830 | 4.31/5.0 |
| Michael & Johanna | 108 | $10,419,137 | 3106 | 4.43/5.0 |
| Cédric De ClickYourFlat | 218 | $9,042,592 | 8892 | 3.77/5.0 |
| Sébastien | 316 | $8,358,636 | 9254 | 3.27/5.0 |
| Élise & Sébastien | 36 | $7,225,078 | 9167 | 4.84/5.0 |
| Ludovic | 108 | $7,030,787 | 2995 | 4.54/5.0 |
| Veeve | 153 | $6,402,070 | 432 | 1.28/5.0 |
Analyzing the strategies of top hosts, such as their property selection, pricing, and guest communication, can offer valuable lessons for optimizing your own Airbnb operations in Paris.
Dive Deeper: Advanced Paris STR Market Data (2025)
Ready to unlock more insights? AirROI provides access to advanced metrics and comprehensive Airbnb data for Paris. Explore detailed analytics beyond this report to refine your investment strategy, optimize pricing, and maximize your vacation rental profits.
Explore Advanced MetricsParis Short-Term Rental Market Composition (2025): Property & Room Types
Room Type Distribution
Property Type Distribution
Market Composition Insights for Paris
- The Paris Airbnb market composition is heavily skewed towards Entire Home/Apt listings, which make up 90.8% of the 44,683 active rentals. This indicates strong guest preference for privacy and space.
- Looking at the property type distribution in Paris, Apartment/Condo properties are the most common (95.4%), reflecting the local real estate landscape.
- Smaller segments like hotel/boutique, house, others (combined 4.6%) offer potential for unique stay experiences.
Paris Airbnb Room Capacity Analysis (2025): Bedroom Distribution
Distribution of Listings by Number of Bedrooms
Room Capacity Insights for Paris
- The dominant room capacity in Paris is 1 bedroom listings, making up 59.1% of the market. This suggests a strong demand for properties suitable for couples or solo travelers.
- Together, 1 bedroom and 2 bedrooms properties represent 78.6% of the active Airbnb listings in Paris, indicating a high concentration in these sizes.
- With over half the market (59.1%) consisting of studios or 1-bedroom units, Paris is particularly well-suited for individuals or couples.
- Listings with 3+ bedrooms (9.3%) represent a smaller niche, potentially indicating an underserved market for larger group accommodations in Paris.
Paris Vacation Rental Guest Capacity Trends (2025)
Distribution of Listings by Guest Capacity
Guest Capacity Insights for Paris
- The most common guest capacity trend in Paris vacation rentals is listings accommodating 2 guests (39.9%). This suggests the primary traveler segment is likely couples or solo travelers.
- Properties designed for 2 guests and 4 guests dominate the Paris STR market, accounting for 67.7% of listings.
- A significant 42.1% of listings cater specifically to 1-2 guests, highlighting strong demand from couples and solo travelers in Paris.
- 12.8% of properties accommodate 6+ guests, serving the market segment for larger families or group travel in Paris.
- On average, properties in Paris are equipped to host 3.3 guests.
Paris Airbnb Booking Patterns (2025): Available vs. Booked Days
Available Days Distribution
Booked Days Distribution
Booking Pattern Insights for Paris
- The most common availability pattern in Paris falls within the 271-366 days range, representing 42.8% of listings. This suggests many properties have significant open periods on their calendars.
- Approximately 70.3% of listings show high availability (181+ days open annually), indicating potential for increased bookings or specific owner usage patterns.
- For booked days, the 91-180 days range is most frequent in Paris (27.6%), reflecting common guest stay durations or potential owner blocking patterns.
- A notable 30.8% of properties secure long booking periods (181+ days booked per year), highlighting successful long-term rental strategies or significant owner usage.
Paris Airbnb Minimum Stay Requirements Analysis
Distribution of Listings by Minimum Night Requirement
1 Night
6298 listings
16.1% of total
2 Nights
9314 listings
23.8% of total
3 Nights
6776 listings
17.3% of total
4-6 Nights
5613 listings
14.3% of total
7-29 Nights
1595 listings
4.1% of total
30+ Nights
9570 listings
24.4% of total
Key Insights
- The most prevalent minimum stay requirement in Paris is 30+ Nights, adopted by 24.4% of listings. This highlights the market's preference for longer commitments.
- A significant segment (24.4%) caters to monthly stays (30+ nights) in Paris, pointing to opportunities in the extended-stay market.
Recommendations
- Align with the market by considering a 30+ Nights minimum stay, as 24.4% of Paris hosts use this setting.
- If feasible, allowing 1-night stays, especially midweek or during low season, could capture last-minute bookings, as only 16.1% currently do.
- Explore offering discounts for stays of 30+ nights to attract the 24.4% of the market seeking extended stays.
- Adjust minimum nights based on seasonality – potentially shorter during low season and longer during peak demand periods in Paris.
Paris Airbnb Cancellation Policy Trends Analysis (2025)
Super Strict 60 Days
249 listings
0.8% of total
Super Strict 30 Days
226 listings
0.7% of total
Non-refundable
24 listings
0.1% of total
Refundable
29 listings
0.1% of total
Flexible
5763 listings
18.2% of total
Moderate
9475 listings
29.9% of total
Firm
7838 listings
24.7% of total
Strict
8073 listings
25.5% of total
Cancellation Policy Insights for Paris
- The prevailing Airbnb cancellation policy trend in Paris is Moderate, used by 29.9% of listings.
- A majority (50.2%) of hosts in Paris utilize Firm or Strict policies, indicating a market where hosts prioritize booking security.
Recommendations for Hosts
- Consider adopting a Moderate policy to align with the 29.9% market standard in Paris.
- Regularly review your cancellation policy against competitors and market demand shifts in Paris.
Paris STR Booking Lead Time Analysis (2025)
Average Booking Lead Time by Month
Booking Lead Time Insights for Paris
- The overall average booking lead time for vacation rentals in Paris is 56 days.
- Guests book furthest in advance for stays during July (average 111 days), likely coinciding with peak travel demand or local events.
- The shortest booking windows occur for stays in February (average 45 days), indicating more last-minute travel plans during this time.
- Seasonally, Summer (95 days avg.) sees the longest lead times, while Winter (47 days avg.) has the shortest, reflecting typical travel planning cycles.
Recommendations for Hosts
- Use the overall average lead time (56 days) as a baseline for your pricing and availability strategy in Paris.
- For July stays, consider implementing length-of-stay discounts or slightly higher rates for bookings made less than 111 days out to capitalize on advance planning.
- Target marketing efforts for the Summer season well in advance (at least 95 days) to capture early planners.
- Monitor your own booking lead times against these Paris averages to identify opportunities for dynamic pricing adjustments.
Popular & Essential Airbnb Amenities in Paris (2025)
Amenity Prevalence
Amenity Insights for Paris
- Essential amenities in Paris that guests expect include: Wifi, Kitchen, Heating. Lacking these (any) could significantly impact bookings.
- Popular amenities like Hot water, Essentials, Smoke alarm are common but not universal. Offering these can provide a competitive edge.
Recommendations for Hosts
- Ensure your listing includes all essential amenities for Paris: Wifi, Kitchen, Heating.
- Prioritize adding missing essentials: Wifi, Kitchen, Heating.
- Consider adding popular differentiators like Hot water or Essentials to increase appeal.
- Highlight unique or less common amenities you offer (e.g., hot tub, dedicated workspace, EV charger) in your listing description and photos.
- Regularly check competitor amenities in Paris to stay competitive.
Paris Airbnb Guest Demographics & Profile Analysis (2025)
Guest Profile Summary for Paris
- The typical guest profile for Airbnb in Paris consists of predominantly international visitors (82%), with top international origins including France, typically belonging to the Post-2000s (Gen Z/Alpha) group (50%), primarily speaking English or French.
- Domestic travelers account for 18.3% of guests.
- Key international markets include United States (27.3%) and France (18.3%).
- Top languages spoken are English (44%) followed by French (17.2%).
- A significant demographic segment is the Post-2000s (Gen Z/Alpha) group, representing 50% of guests.
Recommendations for Hosts
- Focus marketing internationally, particularly towards travelers from France.
- Tailor amenities and listing descriptions to appeal to the dominant Post-2000s (Gen Z/Alpha) demographic (e.g., highlight fast WiFi, smart home features, local guides).
- Highlight unique local experiences or amenities relevant to the primary guest profile.
- Consider seasonal promotions aligned with peak travel times for key origin markets.
Nearby Short-Term Rental Market Comparison
How does the Paris Airbnb market stack up against its neighbors? Compare key performance metrics like average monthly revenue, ADR, and occupancy rates in surrounding areas to understand the broader regional STR landscape.
| Market | Active Properties | Monthly Revenue | Daily Rate | Avg. Occupancy |
|---|---|---|---|---|
| Morienval | 10 | $5,794 | $400.84 | 32% |
| Verdelot | 13 | $3,885 | $300.79 | 46% |
| Trigny | 10 | $3,775 | $248.19 | 46% |
| La Couture-Boussey | 12 | $3,620 | $378.08 | 28% |
| Dourdan | 15 | $3,576 | $223.06 | 52% |
| Rosoy-en-Multien | 15 | $3,558 | $367.61 | 51% |
| Millançay | 11 | $3,476 | $370.42 | 39% |
| Chaintreaux | 11 | $3,136 | $278.28 | 34% |
| Langon-sur-Cher | 12 | $3,127 | $400.27 | 35% |
| Mesnils-sur-Iton | 22 | $3,028 | $309.05 | 40% |