Louvres Airbnb Market Analysis 2025: Short Term Rental Data & Vacation Rental Statistics in Ile-de-France, France
Is Airbnb profitable in Louvres in 2025? Explore comprehensive Airbnb analytics for Louvres, Ile-de-France, France to uncover income potential. This 2025 STR market report for Louvres, based on AirROI data from April 2024 to March 2025, reveals key trends in the niche market of 53 active listings.
Whether you're considering an Airbnb investment in Louvres, optimizing your existing vacation rental, or exploring rental arbitrage opportunities, understanding the Louvres Airbnb data is crucial. Understanding the local regulations is key to maximizing your short term rental income potential. Let's dive into the specifics.
Key Louvres Airbnb Performance Metrics Overview
Monthly Airbnb Revenue Variations & Income Potential in Louvres (2025)
Understanding the monthly revenue variations for Airbnb listings in Louvres is key to maximizing your short term rental income potential. Seasonality significantly impacts earnings. Our analysis, based on data from the past 12 months, shows that the peak revenue month for STRs in Louvres is typically June, while March often presents the lowest earnings, highlighting opportunities for strategic pricing adjustments during shoulder and low seasons. Explore the typical Airbnb income in Louvres across different performance tiers:
- Best-in-class properties (Top 10%) achieve $3,132+ monthly, often utilizing dynamic pricing and superior guest experiences.
- Strong performing properties (Top 25%) earn $2,124 or more, indicating effective management and desirable locations/amenities.
- Typical properties (Median) generate around $1,274 per month, representing the average market performance.
- Entry-level properties (Bottom 25%) see earnings around $788, often with potential for optimization.
Average Monthly Airbnb Earnings Trend in Louvres
Louvres Airbnb Occupancy Rate Trends (2025)
Maximize your bookings by understanding the Louvres STR occupancy trends. Seasonal demand shifts significantly influence how often properties are booked. Typically, Julysees the highest demand (peak season occupancy), while March experiences the lowest (low season). Effective strategies, like adjusting minimum stays or offering promotions, can boost occupancy during slower periods. Here's how different property tiers perform in Louvres:
- Best-in-class properties (Top 10%) achieve 83%+ occupancy, indicating high desirability and potentially optimized availability.
- Strong performing properties (Top 25%) maintain 68% or higher occupancy, suggesting good market fit and guest satisfaction.
- Typical properties (Median) have an occupancy rate around 48%.
- Entry-level properties (Bottom 25%) average 26% occupancy, potentially facing higher vacancy.
Average Monthly Occupancy Rate Trend in Louvres
Average Daily Rate (ADR) Airbnb Trends in Louvres (2025)
Effective short term rental pricing strategy in Louvres involves understanding monthly ADR fluctuations. The Average Daily Rate (ADR) for Airbnb in Louvres typically peaks in August and dips lowest during March. Leveraging Airbnb dynamic pricing tools or strategies based on this seasonality can significantly boost revenue. Here's a look at the typical nightly rates achieved:
- Best-in-class properties (Top 10%) command rates of $167+ per night, often due to premium features or locations.
- Strong performing properties (Top 25%) achieve nightly rates of $119 or more.
- Typical properties (Median) charge around $80 per night.
- Entry-level properties (Bottom 25%) earn around $59 per night.
Average Daily Rate (ADR) Trend by Month in Louvres
Get Live Louvres Market Intelligence 👇

Explore Real-time Analytics
Airbnb Seasonality Analysis & Trends in Louvres (2025)
Peak Season (June, May, April)
- Revenue averages $2,565 per month
- Occupancy rates average 51.3%
- Daily rates average $103
Shoulder Season
- Revenue averages $1,519 per month
- Occupancy maintains around 50.7%
- Daily rates hold near $100
Low Season (February, March, November)
- Revenue drops to average $864 per month
- Occupancy decreases to average 40.3%
- Daily rates adjust to average $83
Seasonality Insights for Louvres
- The Airbnb seasonality in Louvres shows highly seasonal trends requiring careful strategy. While the sections above show seasonal averages, it's also insightful to look at the extremes:
- During the high season, the absolute peak month showcases Louvres's highest earning potential, with monthly revenues capable of climbing to $2,715, occupancy reaching a high of 59.8%, and ADRs peaking at $115.
- Conversely, the slowest single month of the year, typically falling within the low season, marks the market's lowest point. In this month, revenue might dip to $736, occupancy could drop to 34.7%, and ADRs may adjust down to $80.
- Understanding both the seasonal averages and these monthly peaks and troughs in revenue, occupancy, and ADR is crucial for maximizing your Airbnb profit potential in Louvres.
Seasonal Strategies for Maximizing Profit
- Peak Season: Maximize revenue through premium pricing and potentially longer minimum stays. Ensure high availability.
- Low Season: Offer competitive pricing, special promotions (e.g., extended stay discounts), and flexible cancellation policies. Target off-season travelers like remote workers or budget-conscious guests.
- Shoulder Seasons: Implement dynamic pricing that balances peak and low rates. Target weekend travelers or specific events. Offer slightly more flexible terms than peak season.
- Regularly analyze your own performance against these Louvres seasonality benchmarks and adjust your pricing and availability strategy accordingly.
Best Areas for Airbnb Investment in Louvres (2025)
Exploring the top neighborhoods for short-term rentals in Louvres? This section highlights key areas, outlining why they are attractive for hosts and guests, along with notable local attractions. Consider these locations based on your target guest profile and investment strategy.
| Neighborhood / Area | Why Host Here? (Target Guests & Appeal) | Key Attractions & Landmarks |
|---|---|---|
| Louvre Museum Area | This iconic area is not only famous for the Louvre Museum but also offers a central location in Paris. It's ideal for tourists who want to explore classical art and experience the heart of the city. | Louvre Museum, Tuileries Garden, Palais Royal, Pont des Arts, Place Vandôme, Rue de Rivoli |
| Île de la Cité | A historic island in the Seine River, famous for Notre-Dame Cathedral and Sainte-Chapelle. It attracts visitors interested in history and architecture. | Notre-Dame Cathedral, Sainte-Chapelle, Conciergerie, Palais de Justice, Flower Market |
| Saint-Germain-des-Prés | Known for its vibrant café culture and intellectual history, this neighborhood is favored by artists and visitors seeking a classic Parisian experience. | Les Deux Magots, Café de Flore, Saint-Germain-des-Prés Church, Luxembourg Gardens, Shakespeare and Company |
| Montmartre | Famous for its bohemian past and the stunning Sacre-Cœur Basilica, Montmartre is a vibrant area that attracts artists, couples, and tourists looking for a charming Parisian vibe. | Sacré-Cœur Basilica, Place du Tertre, Montmartre Museum, Dalí Paris, Moulin Rouge |
| Le Marais | A trendy district known for its historic architecture, shops, and vibrant LGBTQ+ community. It appeals to younger travelers and those looking for a mix of culture and nightlife. | Place des Vosges, Picasso Museum, Shopping boutiques, Jewish Quarter, Rue des Rosiers |
| Latin Quarter | Famous for its student life and picturesque streets, it offers a lively atmosphere with many cafés, bookstores, and historical sites, perfect for tourists. | Panthéon, Sorbonne University, Luxembourg Gardens, Rue Mouffetard, Cluny Museum |
| Canal Saint-Martin | Trendy and picturesque, this area is popular among young Parisians and offers charming waterfront spots, perfect for those looking for a more local experience. | Canal Saint-Martin, Café de l'Époque, Porte de l'Avenue de la République, Ateliers d'Artistes |
| Bastille | This vibrant area is known for its nightlife and dining options, attracting a young crowd looking for entertainment and cultural scenes. | Bastille Opera, Place de la Bastille, Marché Bastille, Rue de Lappe, Canal de l'Ourcq |
Understanding Airbnb License Requirements & STR Laws in Louvres (2025)
With 11% of listings showing registration in 2025, understanding potential Airbnb license requirements is crucial in Louvres. Always verify the latest short term rental regulations and Airbnb license requirements directly with local government authorities for Louvres to ensure full compliance before hosting.
(Source: AirROI data, 2025, based on 11% licensed listings)
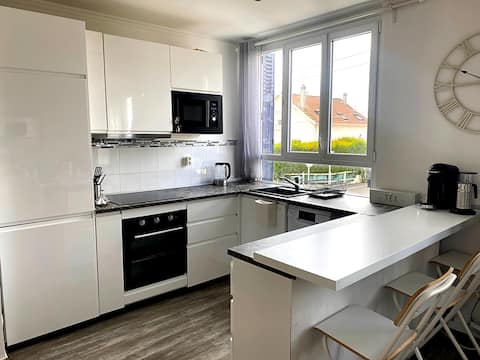
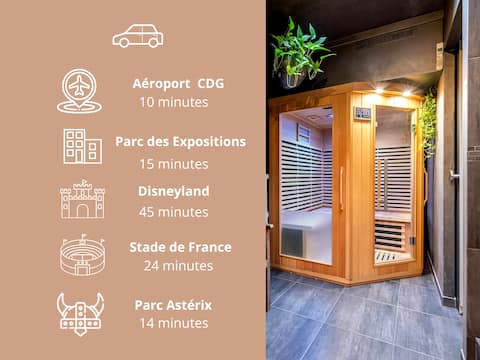
Top Performing Airbnb Properties in Louvres (2025)
Benchmark your potential! Explore examples of top-performing Airbnb properties in Louvresbased on Trailing Twelve Month (TTM) revenue. Analyze their characteristics, revenue, occupancy rate, and ADR to understand what drives success in this market.
House with garden and pool
Entire Place • 3 bedrooms

House with Jacuzzi - nearby Roissy CDG / PARIS
Entire Place • 1 bedroom
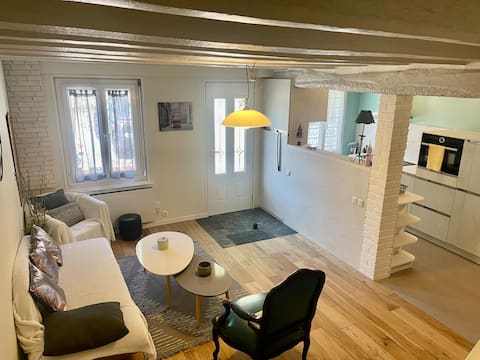
Cozy House * Roissy CDG Paris* Parc-expo* Asterix
Entire Place • 2 bedrooms
3 Douches/2 wc/Terrace/Sauna
Entire Place • 3 bedrooms
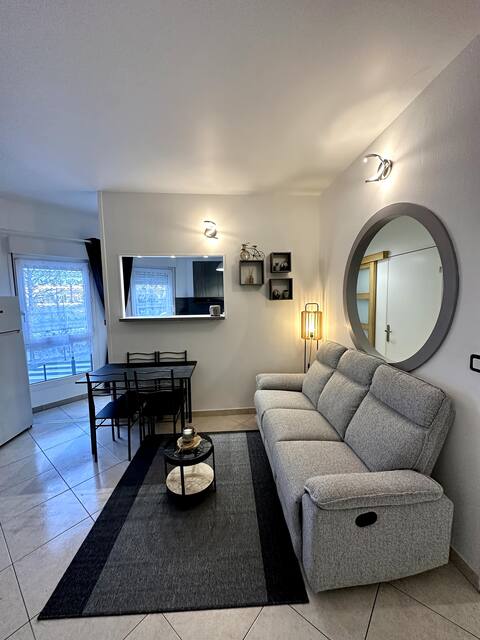
Apartment near CDG / Asterix
Entire Place • 3 bedrooms
7 beds Close to airport-Paris- Parc Astérix
Entire Place • 3 bedrooms
Note: Performance varies based on location, size, amenities, seasonality, and management quality. Data reflects the past 12 months.
Top Performing Airbnb Hosts in Louvres (2025)
Learn from the best! This table showcases top-performing Airbnb hosts in Louvres based on the number of properties managed and estimated total revenue over the past year. Analyze their scale and performance metrics.
| Host Name | Properties | Grossing Revenue | Stay Reviews | Avg Rating |
|---|---|---|---|---|
| Johan | 1 | $56,536 | 33 | 4.64/5.0 |
| Eric | 2 | $49,506 | 211 | 4.82/5.0 |
| Celine | 3 | $48,039 | 1074 | 4.80/5.0 |
| Estelle | 1 | $43,438 | 37 | 4.73/5.0 |
| Patrick | 1 | $38,667 | 68 | 4.91/5.0 |
| Pierre | 1 | $36,344 | 265 | 4.90/5.0 |
| Praveen | 1 | $33,761 | 80 | 4.79/5.0 |
| Julien | 2 | $27,993 | 45 | 4.52/5.0 |
| Marie | 1 | $26,082 | 363 | 4.98/5.0 |
| Ze'Loc | 1 | $23,915 | 61 | 5.00/5.0 |
Analyzing the strategies of top hosts, such as their property selection, pricing, and guest communication, can offer valuable lessons for optimizing your own Airbnb operations in Louvres.
Dive Deeper: Advanced Louvres STR Market Data (2025)
Ready to unlock more insights? AirROI provides access to advanced metrics and comprehensive Airbnb data for Louvres. Explore detailed analytics beyond this report to refine your investment strategy, optimize pricing, and maximize your vacation rental profits.
Explore Advanced MetricsLouvres Short-Term Rental Market Composition (2025): Property & Room Types
Room Type Distribution
Property Type Distribution
Market Composition Insights for Louvres
- The Louvres Airbnb market composition is heavily skewed towards Entire Home/Apt listings, which make up 86.8% of the 53 active rentals. This indicates strong guest preference for privacy and space.
- Looking at the property type distribution in Louvres, Apartment/Condo properties are the most common (69.8%), reflecting the local real estate landscape.
- Houses represent a significant 28.3% portion, catering likely to families or larger groups.
- Smaller segments like hotel/boutique (combined 1.9%) offer potential for unique stay experiences.
Louvres Airbnb Room Capacity Analysis (2025): Bedroom Distribution
Distribution of Listings by Number of Bedrooms
Room Capacity Insights for Louvres
- The dominant room capacity in Louvres is 1 bedroom listings, making up 56.6% of the market. This suggests a strong demand for properties suitable for couples or solo travelers.
- Together, 1 bedroom and 2 bedrooms properties represent 71.7% of the active Airbnb listings in Louvres, indicating a high concentration in these sizes.
- With over half the market (56.6%) consisting of studios or 1-bedroom units, Louvres is particularly well-suited for individuals or couples.
Louvres Vacation Rental Guest Capacity Trends (2025)
Distribution of Listings by Guest Capacity
Guest Capacity Insights for Louvres
- The most common guest capacity trend in Louvres vacation rentals is listings accommodating 2 guests (26.4%). This suggests the primary traveler segment is likely couples or solo travelers.
- Properties designed for 2 guests and 4 guests dominate the Louvres STR market, accounting for 49.0% of listings.
- 20.8% of properties accommodate 6+ guests, serving the market segment for larger families or group travel in Louvres.
- On average, properties in Louvres are equipped to host 3.4 guests.
Louvres Airbnb Booking Patterns (2025): Available vs. Booked Days
Available Days Distribution
Booked Days Distribution
Booking Pattern Insights for Louvres
- The most common availability pattern in Louvres falls within the 91-180 days range, representing 32.1% of listings. This suggests many properties have significant open periods on their calendars.
- Approximately 58.5% of listings show high availability (181+ days open annually), indicating potential for increased bookings or specific owner usage patterns.
- For booked days, the 181-270 days range is most frequent in Louvres (34%), reflecting common guest stay durations or potential owner blocking patterns.
- A notable 45.3% of properties secure long booking periods (181+ days booked per year), highlighting successful long-term rental strategies or significant owner usage.
Louvres Airbnb Minimum Stay Requirements Analysis
Distribution of Listings by Minimum Night Requirement
1 Night
35 listings
79.5% of total
2 Nights
6 listings
13.6% of total
3 Nights
1 listings
2.3% of total
30+ Nights
2 listings
4.5% of total
Key Insights
- The most prevalent minimum stay requirement in Louvres is 1 Night, adopted by 79.5% of listings. This highlights the market's preference for shorter, flexible bookings.
- A strong majority (93.1%) of the Louvres Airbnb data shows acceptance of very short stays (1-2 nights), indicating a dynamic, high-turnover market.
Recommendations
- Align with the market by considering a 1 Night minimum stay, as 79.5% of Louvres hosts use this setting.
- Adjust minimum nights based on seasonality – potentially shorter during low season and longer during peak demand periods in Louvres.
Louvres Airbnb Cancellation Policy Trends Analysis (2025)
Flexible
8 listings
18.2% of total
Moderate
12 listings
27.3% of total
Firm
5 listings
11.4% of total
Strict
19 listings
43.2% of total
Cancellation Policy Insights for Louvres
- The prevailing Airbnb cancellation policy trend in Louvres is Strict, used by 43.2% of listings.
- A majority (54.6%) of hosts in Louvres utilize Firm or Strict policies, indicating a market where hosts prioritize booking security.
Recommendations for Hosts
- Consider adopting a Strict policy to align with the 43.2% market standard in Louvres.
- With 43.2% using Strict terms, this is a viable option in Louvres, particularly for high-value properties or during peak demand periods.
- Regularly review your cancellation policy against competitors and market demand shifts in Louvres.
Louvres STR Booking Lead Time Analysis (2025)
Average Booking Lead Time by Month
Booking Lead Time Insights for Louvres
- The overall average booking lead time for vacation rentals in Louvres is 38 days.
- Guests book furthest in advance for stays during July (average 78 days), likely coinciding with peak travel demand or local events.
- The shortest booking windows occur for stays in February (average 24 days), indicating more last-minute travel plans during this time.
- Seasonally, Summer (75 days avg.) sees the longest lead times, while Winter (31 days avg.) has the shortest, reflecting typical travel planning cycles.
Recommendations for Hosts
- Use the overall average lead time (38 days) as a baseline for your pricing and availability strategy in Louvres.
- For July stays, consider implementing length-of-stay discounts or slightly higher rates for bookings made less than 78 days out to capitalize on advance planning.
- Target marketing efforts for the Summer season well in advance (at least 75 days) to capture early planners.
- Monitor your own booking lead times against these Louvres averages to identify opportunities for dynamic pricing adjustments.
Popular & Essential Airbnb Amenities in Louvres (2025)
Amenity Prevalence
Amenity Insights for Louvres
- Essential amenities in Louvres that guests expect include: Wifi, TV, Heating. Lacking these (any) could significantly impact bookings.
- Popular amenities like Hot water, Bed linens, Kitchen are common but not universal. Offering these can provide a competitive edge.
Recommendations for Hosts
- Ensure your listing includes all essential amenities for Louvres: Wifi, TV, Heating.
- Prioritize adding missing essentials: TV, Heating.
- Consider adding popular differentiators like Hot water or Bed linens to increase appeal.
- Highlight unique or less common amenities you offer (e.g., hot tub, dedicated workspace, EV charger) in your listing description and photos.
- Regularly check competitor amenities in Louvres to stay competitive.
Louvres Airbnb Guest Demographics & Profile Analysis (2025)
Guest Profile Summary for Louvres
- The typical guest profile for Airbnb in Louvres consists of a mix of domestic (61%) and international guests, often arriving from nearby Paris, typically belonging to the Post-2000s (Gen Z/Alpha) group (50%), primarily speaking French or English.
- Domestic travelers account for 61.0% of guests.
- Key international markets include France (61%) and United States (14.7%).
- Top languages spoken are French (36.6%) followed by English (36.5%).
- A significant demographic segment is the Post-2000s (Gen Z/Alpha) group, representing 50% of guests.
Recommendations for Hosts
- Target domestic marketing efforts towards travelers from Paris and Argenteuil.
- Tailor amenities and listing descriptions to appeal to the dominant Post-2000s (Gen Z/Alpha) demographic (e.g., highlight fast WiFi, smart home features, local guides).
- Highlight unique local experiences or amenities relevant to the primary guest profile.
- Consider seasonal promotions aligned with peak travel times for key origin markets.
Nearby Short-Term Rental Market Comparison
How does the Louvres Airbnb market stack up against its neighbors? Compare key performance metrics like average monthly revenue, ADR, and occupancy rates in surrounding areas to understand the broader regional STR landscape.
| Market | Active Properties | Monthly Revenue | Daily Rate | Avg. Occupancy |
|---|---|---|---|---|
| Lo-Reninge | 12 | $6,193 | $432.10 | 49% |
| Morienval | 10 | $5,794 | $400.84 | 32% |
| Mont-de-l'Enclus | 10 | $5,508 | $360.62 | 39% |
| Verdelot | 13 | $3,885 | $300.79 | 46% |
| Trigny | 10 | $3,775 | $248.19 | 46% |
| La Couture-Boussey | 12 | $3,620 | $378.08 | 28% |
| Kluisbergen | 17 | $3,584 | $401.50 | 44% |
| Dourdan | 15 | $3,576 | $223.06 | 52% |
| Rosoy-en-Multien | 15 | $3,558 | $367.61 | 51% |
| Ellezelles | 13 | $3,492 | $292.68 | 45% |