Livry-Gargan Airbnb Market Analysis 2025: Short Term Rental Data & Vacation Rental Statistics in Ile-de-France, France
Is Airbnb profitable in Livry-Gargan in 2025? Explore comprehensive Airbnb analytics for Livry-Gargan, Ile-de-France, France to uncover income potential. This 2025 STR market report for Livry-Gargan, based on AirROI data from April 2024 to March 2025, reveals key trends in the niche market of 105 active listings.
Whether you're considering an Airbnb investment in Livry-Gargan, optimizing your existing vacation rental, or exploring rental arbitrage opportunities, understanding the Livry-Gargan Airbnb data is crucial. Leveraging the low regulation environment is key to maximizing your short term rental income potential. Let's dive into the specifics.
Key Livry-Gargan Airbnb Performance Metrics Overview
Monthly Airbnb Revenue Variations & Income Potential in Livry-Gargan (2025)
Understanding the monthly revenue variations for Airbnb listings in Livry-Gargan is key to maximizing your short term rental income potential. Seasonality significantly impacts earnings. Our analysis, based on data from the past 12 months, shows that the peak revenue month for STRs in Livry-Gargan is typically April, while February often presents the lowest earnings, highlighting opportunities for strategic pricing adjustments during shoulder and low seasons. Explore the typical Airbnb income in Livry-Gargan across different performance tiers:
- Best-in-class properties (Top 10%) achieve $3,116+ monthly, often utilizing dynamic pricing and superior guest experiences.
- Strong performing properties (Top 25%) earn $2,080 or more, indicating effective management and desirable locations/amenities.
- Typical properties (Median) generate around $1,243 per month, representing the average market performance.
- Entry-level properties (Bottom 25%) see earnings around $581, often with potential for optimization.
Average Monthly Airbnb Earnings Trend in Livry-Gargan
Livry-Gargan Airbnb Occupancy Rate Trends (2025)
Maximize your bookings by understanding the Livry-Gargan STR occupancy trends. Seasonal demand shifts significantly influence how often properties are booked. Typically, Octobersees the highest demand (peak season occupancy), while March experiences the lowest (low season). Effective strategies, like adjusting minimum stays or offering promotions, can boost occupancy during slower periods. Here's how different property tiers perform in Livry-Gargan:
- Best-in-class properties (Top 10%) achieve 78%+ occupancy, indicating high desirability and potentially optimized availability.
- Strong performing properties (Top 25%) maintain 57% or higher occupancy, suggesting good market fit and guest satisfaction.
- Typical properties (Median) have an occupancy rate around 34%.
- Entry-level properties (Bottom 25%) average 16% occupancy, potentially facing higher vacancy.
Average Monthly Occupancy Rate Trend in Livry-Gargan
Average Daily Rate (ADR) Airbnb Trends in Livry-Gargan (2025)
Effective short term rental pricing strategy in Livry-Gargan involves understanding monthly ADR fluctuations. The Average Daily Rate (ADR) for Airbnb in Livry-Gargan typically peaks in July and dips lowest during March. Leveraging Airbnb dynamic pricing tools or strategies based on this seasonality can significantly boost revenue. Here's a look at the typical nightly rates achieved:
- Best-in-class properties (Top 10%) command rates of $238+ per night, often due to premium features or locations.
- Strong performing properties (Top 25%) achieve nightly rates of $142 or more.
- Typical properties (Median) charge around $95 per night.
- Entry-level properties (Bottom 25%) earn around $66 per night.
Average Daily Rate (ADR) Trend by Month in Livry-Gargan
Get Live Livry-Gargan Market Intelligence 👇

Explore Real-time Analytics
Airbnb Seasonality Analysis & Trends in Livry-Gargan (2025)
Peak Season (April, May, June)
- Revenue averages $2,640 per month
- Occupancy rates average 40.9%
- Daily rates average $126
Shoulder Season
- Revenue averages $1,435 per month
- Occupancy maintains around 39.4%
- Daily rates hold near $127
Low Season (January, February, March)
- Revenue drops to average $897 per month
- Occupancy decreases to average 30.4%
- Daily rates adjust to average $115
Seasonality Insights for Livry-Gargan
- The Airbnb seasonality in Livry-Gargan shows highly seasonal trends requiring careful strategy. While the sections above show seasonal averages, it's also insightful to look at the extremes:
- During the high season, the absolute peak month showcases Livry-Gargan's highest earning potential, with monthly revenues capable of climbing to $2,855, occupancy reaching a high of 44.3%, and ADRs peaking at $144.
- Conversely, the slowest single month of the year, typically falling within the low season, marks the market's lowest point. In this month, revenue might dip to $738, occupancy could drop to 27.6%, and ADRs may adjust down to $114.
- Understanding both the seasonal averages and these monthly peaks and troughs in revenue, occupancy, and ADR is crucial for maximizing your Airbnb profit potential in Livry-Gargan.
Seasonal Strategies for Maximizing Profit
- Peak Season: Maximize revenue through premium pricing and potentially longer minimum stays. Ensure high availability.
- Low Season: Offer competitive pricing, special promotions (e.g., extended stay discounts), and flexible cancellation policies. Target off-season travelers like remote workers or budget-conscious guests.
- Shoulder Seasons: Implement dynamic pricing that balances peak and low rates. Target weekend travelers or specific events. Offer slightly more flexible terms than peak season.
- Regularly analyze your own performance against these Livry-Gargan seasonality benchmarks and adjust your pricing and availability strategy accordingly.
Best Areas for Airbnb Investment in Livry-Gargan (2025)
Exploring the top neighborhoods for short-term rentals in Livry-Gargan? This section highlights key areas, outlining why they are attractive for hosts and guests, along with notable local attractions. Consider these locations based on your target guest profile and investment strategy.
| Neighborhood / Area | Why Host Here? (Target Guests & Appeal) | Key Attractions & Landmarks |
|---|---|---|
| Centre Ville | The main city center of Livry-Gargan, offering easy access to shops, restaurants, and transport links. A prime location for guests wanting a central base to explore the city and nearby areas. | Place du Marché, Parc F. Mitterrand, Église Saint-Louis, Shopping at local boutiques, Cafes and restaurants |
| Les Cottages | A charming residential area known for its relaxed atmosphere and family-friendly environment. Attracts guests looking for a quieter stay with a touch of suburban comfort. | Parc des Sports, Local markets, Nearby schools and parks, Quiet streets, Community events |
| Gargan | A vibrant area that encapsulates the local culture, with plenty of parks and green spaces. Ideal for visitors who appreciate nature and a laid-back atmosphere while still being close to city amenities. | Parc Georges Valbon, La Réserve Naturelle, Cafes with local cuisine, Walking and biking paths, Artisan shops |
| Les Senteurs | A picturesque neighborhood known for its beautiful homes and gardens. Great for guests wanting a scenic and peaceful stay while being a short commute to central attractions. | Beautiful parks, Community gardens, Traditional architecture, Local art installations, Historic walking paths |
| La Cerisaie | A residential district that offers a mix of urban and suburban vibes, perfect for families or groups. Close to supermarkets and local amenities, making it convenient for longer stays. | Local shopping centers, Parks and recreational areas, Family-friendly restaurants, Cultural events, Playgrounds |
| Chemin de Montfermeil | An area known for its public parks and recreational facilities, drawing visitors interested in outdoor activities and local gatherings. A good spot for active guests looking for sports and nature. | Football fields, Outdoor workout spaces, Run and bike trails, Community sports events, Playgrounds |
| Quartier des Fleurs | A lovely neighborhood named after its floral streets, promoting a relaxing and colorful living experience. A good fit for tourists interested in a serene atmosphere close to urban life. | Botanical gardens, Flower markets, Scenic walking routes, Relaxed cafes, Community festivals |
| La Noue | A developing area that is becoming more popular for short-term stays, offering modern amenities and close proximity to key transport links to Paris. Attractive to young professionals and tourists alike. | Modern shopping facilities, Transport connectivity, Local entertainment options, Cultural attractions, Proximity to Paris |
Understanding Airbnb License Requirements & STR Laws in Livry-Gargan (2025)
While Livry-Gargan, Ile-de-France, France currently shows low STR regulations, specific Airbnb license requirements might still exist or change. Always verify the latest short term rental regulations and Airbnb license requirements directly with local government authorities for Livry-Gargan to ensure full compliance before hosting.
(Source: AirROI data, 2025, based on 1% licensed listings)
Top Performing Airbnb Properties in Livry-Gargan (2025)
Benchmark your potential! Explore examples of top-performing Airbnb properties in Livry-Garganbased on Trailing Twelve Month (TTM) revenue. Analyze their characteristics, revenue, occupancy rate, and ADR to understand what drives success in this market.
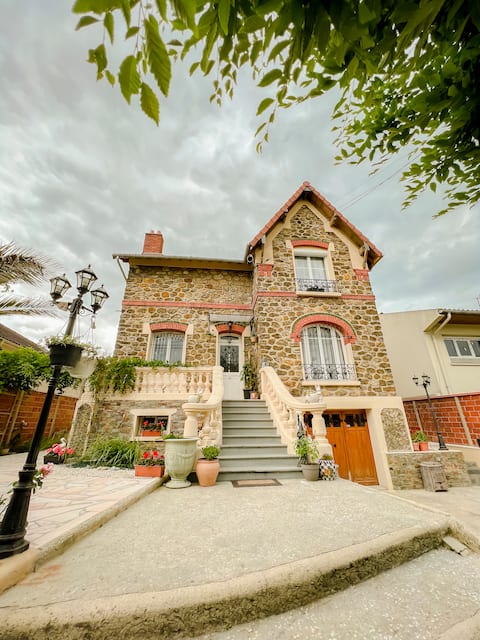
Grinding house with very large beautiful garden
Entire Place • 4 bedrooms
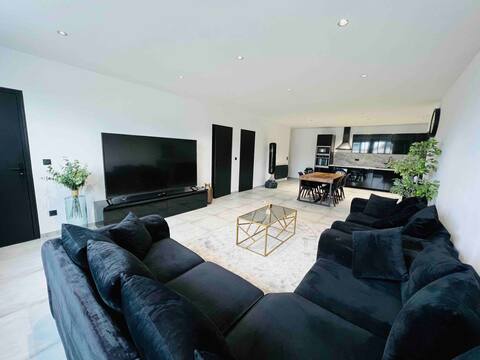
Large Apartment / SAUNA / Charles de Gaulle
Entire Place • 3 bedrooms
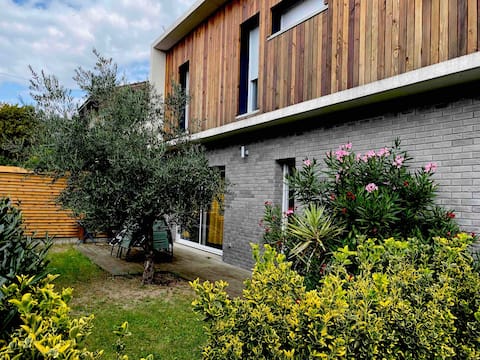
Maison 90m²/JO24/Viparis/ Paris/Disney
Entire Place • 3 bedrooms
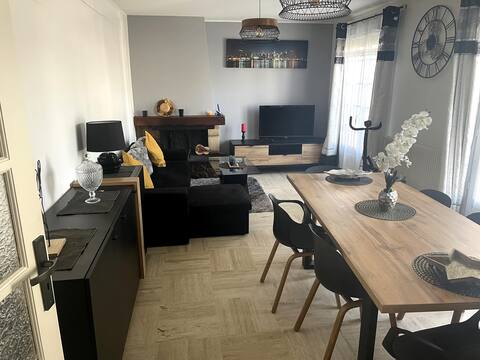
F3 in a pavilion close to paris/CDG/exp park
Entire Place • 2 bedrooms
Jolie F3 paris/CDG/parc expo
Entire Place • 2 bedrooms

Cosy and design, w/parking, king-size bed, WiFi
Entire Place • 1 bedroom
Note: Performance varies based on location, size, amenities, seasonality, and management quality. Data reflects the past 12 months.
Top Performing Airbnb Hosts in Livry-Gargan (2025)
Learn from the best! This table showcases top-performing Airbnb hosts in Livry-Gargan based on the number of properties managed and estimated total revenue over the past year. Analyze their scale and performance metrics.
| Host Name | Properties | Grossing Revenue | Stay Reviews | Avg Rating |
|---|---|---|---|---|
| Ngoc Quy | 1 | $75,559 | 36 | 4.67/5.0 |
| Kathia | 3 | $70,362 | 76 | 3.13/5.0 |
| Jébrine | 1 | $52,512 | 123 | 4.97/5.0 |
| Host #66732284 | 1 | $49,369 | 36 | 4.94/5.0 |
| Host #28876569 | 4 | $40,668 | 41 | 4.49/5.0 |
| Miguel | 1 | $23,081 | 42 | 4.81/5.0 |
| Jd | 1 | $22,669 | 4 | 4.75/5.0 |
| Laura | 1 | $22,039 | 28 | 4.96/5.0 |
| Olivia Marie-Agnès | 1 | $21,413 | 94 | 4.97/5.0 |
| Yves Et Annick | 2 | $21,183 | 140 | 4.92/5.0 |
Analyzing the strategies of top hosts, such as their property selection, pricing, and guest communication, can offer valuable lessons for optimizing your own Airbnb operations in Livry-Gargan.
Dive Deeper: Advanced Livry-Gargan STR Market Data (2025)
Ready to unlock more insights? AirROI provides access to advanced metrics and comprehensive Airbnb data for Livry-Gargan. Explore detailed analytics beyond this report to refine your investment strategy, optimize pricing, and maximize your vacation rental profits.
Explore Advanced MetricsLivry-Gargan Short-Term Rental Market Composition (2025): Property & Room Types
Room Type Distribution
Property Type Distribution
Market Composition Insights for Livry-Gargan
- The Livry-Gargan Airbnb market composition is heavily skewed towards Entire Home/Apt listings, which make up 89.5% of the 105 active rentals. This indicates strong guest preference for privacy and space.
- Looking at the property type distribution in Livry-Gargan, Apartment/Condo properties are the most common (63.8%), reflecting the local real estate landscape.
- Houses represent a significant 31.4% portion, catering likely to families or larger groups.
- Smaller segments like hotel/boutique, others (combined 4.8%) offer potential for unique stay experiences.
Livry-Gargan Airbnb Room Capacity Analysis (2025): Bedroom Distribution
Distribution of Listings by Number of Bedrooms
Room Capacity Insights for Livry-Gargan
- The dominant room capacity in Livry-Gargan is 1 bedroom listings, making up 60% of the market. This suggests a strong demand for properties suitable for couples or solo travelers.
- Together, 1 bedroom and 2 bedrooms properties represent 80.0% of the active Airbnb listings in Livry-Gargan, indicating a high concentration in these sizes.
- With over half the market (60%) consisting of studios or 1-bedroom units, Livry-Gargan is particularly well-suited for individuals or couples.
- Listings with 3+ bedrooms (9.5%) represent a smaller niche, potentially indicating an underserved market for larger group accommodations in Livry-Gargan.
Livry-Gargan Vacation Rental Guest Capacity Trends (2025)
Distribution of Listings by Guest Capacity
Guest Capacity Insights for Livry-Gargan
- The most common guest capacity trend in Livry-Gargan vacation rentals is listings accommodating 4 guests (35.2%). This suggests the primary traveler segment is likely small families or groups.
- Properties designed for 4 guests and 2 guests dominate the Livry-Gargan STR market, accounting for 66.6% of listings.
- 13.4% of properties accommodate 6+ guests, serving the market segment for larger families or group travel in Livry-Gargan.
- On average, properties in Livry-Gargan are equipped to host 3.4 guests.
Livry-Gargan Airbnb Booking Patterns (2025): Available vs. Booked Days
Available Days Distribution
Booked Days Distribution
Booking Pattern Insights for Livry-Gargan
- The most common availability pattern in Livry-Gargan falls within the 271-366 days range, representing 62.9% of listings. This suggests many properties have significant open periods on their calendars.
- Approximately 85.8% of listings show high availability (181+ days open annually), indicating potential for increased bookings or specific owner usage patterns.
- For booked days, the 1-30 days range is most frequent in Livry-Gargan (38.1%), reflecting common guest stay durations or potential owner blocking patterns.
- A notable 14.3% of properties secure long booking periods (181+ days booked per year), highlighting successful long-term rental strategies or significant owner usage.
Livry-Gargan Airbnb Minimum Stay Requirements Analysis
Distribution of Listings by Minimum Night Requirement
1 Night
39 listings
44.8% of total
2 Nights
22 listings
25.3% of total
3 Nights
6 listings
6.9% of total
4-6 Nights
10 listings
11.5% of total
7-29 Nights
2 listings
2.3% of total
30+ Nights
8 listings
9.2% of total
Key Insights
- The most prevalent minimum stay requirement in Livry-Gargan is 1 Night, adopted by 44.8% of listings. This highlights the market's preference for shorter, flexible bookings.
- A strong majority (70.1%) of the Livry-Gargan Airbnb data shows acceptance of very short stays (1-2 nights), indicating a dynamic, high-turnover market.
Recommendations
- Align with the market by considering a 1 Night minimum stay, as 44.8% of Livry-Gargan hosts use this setting.
- Explore offering discounts for stays of 30+ nights to attract the 9.2% of the market seeking extended stays.
- Adjust minimum nights based on seasonality – potentially shorter during low season and longer during peak demand periods in Livry-Gargan.
Livry-Gargan Airbnb Cancellation Policy Trends Analysis (2025)
Flexible
18 listings
28.1% of total
Moderate
24 listings
37.5% of total
Firm
14 listings
21.9% of total
Strict
8 listings
12.5% of total
Cancellation Policy Insights for Livry-Gargan
- The prevailing Airbnb cancellation policy trend in Livry-Gargan is Moderate, used by 37.5% of listings.
- There's a relatively balanced mix between guest-friendly (65.6%) and stricter (34.4%) policies, offering choices for different guest needs.
Recommendations for Hosts
- Consider adopting a Moderate policy to align with the 37.5% market standard in Livry-Gargan.
- Using a Strict policy might deter some guests, as only 12.5% of listings use it. Evaluate if potential revenue protection outweighs possible lower booking rates.
- Regularly review your cancellation policy against competitors and market demand shifts in Livry-Gargan.
Livry-Gargan STR Booking Lead Time Analysis (2025)
Average Booking Lead Time by Month
Booking Lead Time Insights for Livry-Gargan
- The overall average booking lead time for vacation rentals in Livry-Gargan is 40 days.
- Guests book furthest in advance for stays during July (average 93 days), likely coinciding with peak travel demand or local events.
- The shortest booking windows occur for stays in February (average 15 days), indicating more last-minute travel plans during this time.
- Seasonally, Summer (64 days avg.) sees the longest lead times, while Winter (20 days avg.) has the shortest, reflecting typical travel planning cycles.
Recommendations for Hosts
- Use the overall average lead time (40 days) as a baseline for your pricing and availability strategy in Livry-Gargan.
- For July stays, consider implementing length-of-stay discounts or slightly higher rates for bookings made less than 93 days out to capitalize on advance planning.
- Target marketing efforts for the Summer season well in advance (at least 64 days) to capture early planners.
- Monitor your own booking lead times against these Livry-Gargan averages to identify opportunities for dynamic pricing adjustments.
Popular & Essential Airbnb Amenities in Livry-Gargan (2025)
Amenity Prevalence
Amenity Insights for Livry-Gargan
- Essential amenities in Livry-Gargan that guests expect include: Heating, Kitchen, Hot water, TV. Lacking these (any) could significantly impact bookings.
- Popular amenities like Wifi, Essentials, Smoke alarm are common but not universal. Offering these can provide a competitive edge.
- Warning: Wifi is not universally provided but is considered essential globally. Ensure reliable Wifi is offered.
Recommendations for Hosts
- Ensure your listing includes all essential amenities for Livry-Gargan: Heating, Kitchen, Hot water, TV.
- Prioritize adding missing essentials: Heating, Kitchen, Hot water, TV.
- Consider adding popular differentiators like Wifi or Essentials to increase appeal.
- Highlight unique or less common amenities you offer (e.g., hot tub, dedicated workspace, EV charger) in your listing description and photos.
- Regularly check competitor amenities in Livry-Gargan to stay competitive.
Livry-Gargan Airbnb Guest Demographics & Profile Analysis (2025)
Guest Profile Summary for Livry-Gargan
- The typical guest profile for Airbnb in Livry-Gargan consists of a mix of domestic (60%) and international guests, often arriving from nearby Paris, typically belonging to the Post-2000s (Gen Z/Alpha) group (50%), primarily speaking French or English.
- Domestic travelers account for 60.1% of guests.
- Key international markets include France (60.1%) and United Kingdom (6.8%).
- Top languages spoken are French (34.8%) followed by English (33.1%).
- A significant demographic segment is the Post-2000s (Gen Z/Alpha) group, representing 50% of guests.
Recommendations for Hosts
- Target domestic marketing efforts towards travelers from Paris and Lyon.
- Tailor amenities and listing descriptions to appeal to the dominant Post-2000s (Gen Z/Alpha) demographic (e.g., highlight fast WiFi, smart home features, local guides).
- Highlight unique local experiences or amenities relevant to the primary guest profile.
- Consider seasonal promotions aligned with peak travel times for key origin markets.
Nearby Short-Term Rental Market Comparison
How does the Livry-Gargan Airbnb market stack up against its neighbors? Compare key performance metrics like average monthly revenue, ADR, and occupancy rates in surrounding areas to understand the broader regional STR landscape.
| Market | Active Properties | Monthly Revenue | Daily Rate | Avg. Occupancy |
|---|---|---|---|---|
| Morienval | 10 | $5,794 | $400.84 | 32% |
| Verdelot | 13 | $3,885 | $300.79 | 46% |
| Trigny | 10 | $3,775 | $248.19 | 46% |
| La Couture-Boussey | 12 | $3,620 | $378.08 | 28% |
| Dourdan | 15 | $3,576 | $223.06 | 52% |
| Rosoy-en-Multien | 15 | $3,558 | $367.61 | 51% |
| Millançay | 11 | $3,476 | $370.42 | 39% |
| Chaintreaux | 11 | $3,136 | $278.28 | 34% |
| Langon-sur-Cher | 12 | $3,127 | $400.27 | 35% |
| Mesnils-sur-Iton | 22 | $3,028 | $309.05 | 40% |