Le Vésinet Airbnb Market Analysis 2025: Short Term Rental Data & Vacation Rental Statistics in Ile-de-France, France
Is Airbnb profitable in Le Vésinet in 2025? Explore comprehensive Airbnb analytics for Le Vésinet, Ile-de-France, France to uncover income potential. This 2025 STR market report for Le Vésinet, based on AirROI data from April 2024 to March 2025, reveals key trends in the niche market of 77 active listings.
Whether you're considering an Airbnb investment in Le Vésinet, optimizing your existing vacation rental, or exploring rental arbitrage opportunities, understanding the Le Vésinet Airbnb data is crucial. Leveraging the low regulation environment is key to maximizing your short term rental income potential. Let's dive into the specifics.
Key Le Vésinet Airbnb Performance Metrics Overview
Monthly Airbnb Revenue Variations & Income Potential in Le Vésinet (2025)
Understanding the monthly revenue variations for Airbnb listings in Le Vésinet is key to maximizing your short term rental income potential. Seasonality significantly impacts earnings. Our analysis, based on data from the past 12 months, shows that the peak revenue month for STRs in Le Vésinet is typically July, while March often presents the lowest earnings, highlighting opportunities for strategic pricing adjustments during shoulder and low seasons. Explore the typical Airbnb income in Le Vésinet across different performance tiers:
- Best-in-class properties (Top 10%) achieve $5,368+ monthly, often utilizing dynamic pricing and superior guest experiences.
- Strong performing properties (Top 25%) earn $3,055 or more, indicating effective management and desirable locations/amenities.
- Typical properties (Median) generate around $1,676 per month, representing the average market performance.
- Entry-level properties (Bottom 25%) see earnings around $817, often with potential for optimization.
Average Monthly Airbnb Earnings Trend in Le Vésinet
Le Vésinet Airbnb Occupancy Rate Trends (2025)
Maximize your bookings by understanding the Le Vésinet STR occupancy trends. Seasonal demand shifts significantly influence how often properties are booked. Typically, Octobersees the highest demand (peak season occupancy), while March experiences the lowest (low season). Effective strategies, like adjusting minimum stays or offering promotions, can boost occupancy during slower periods. Here's how different property tiers perform in Le Vésinet:
- Best-in-class properties (Top 10%) achieve 77%+ occupancy, indicating high desirability and potentially optimized availability.
- Strong performing properties (Top 25%) maintain 59% or higher occupancy, suggesting good market fit and guest satisfaction.
- Typical properties (Median) have an occupancy rate around 34%.
- Entry-level properties (Bottom 25%) average 18% occupancy, potentially facing higher vacancy.
Average Monthly Occupancy Rate Trend in Le Vésinet
Average Daily Rate (ADR) Airbnb Trends in Le Vésinet (2025)
Effective short term rental pricing strategy in Le Vésinet involves understanding monthly ADR fluctuations. The Average Daily Rate (ADR) for Airbnb in Le Vésinet typically peaks in August and dips lowest during March. Leveraging Airbnb dynamic pricing tools or strategies based on this seasonality can significantly boost revenue. Here's a look at the typical nightly rates achieved:
- Best-in-class properties (Top 10%) command rates of $670+ per night, often due to premium features or locations.
- Strong performing properties (Top 25%) achieve nightly rates of $370 or more.
- Typical properties (Median) charge around $132 per night.
- Entry-level properties (Bottom 25%) earn around $87 per night.
Average Daily Rate (ADR) Trend by Month in Le Vésinet
Get Live Le Vésinet Market Intelligence 👇

Explore Real-time Analytics
Airbnb Seasonality Analysis & Trends in Le Vésinet (2025)
Peak Season (July, August, June)
- Revenue averages $4,045 per month
- Occupancy rates average 40.3%
- Daily rates average $285
Shoulder Season
- Revenue averages $2,127 per month
- Occupancy maintains around 40.6%
- Daily rates hold near $265
Low Season (March, November, December)
- Revenue drops to average $1,556 per month
- Occupancy decreases to average 36.5%
- Daily rates adjust to average $264
Seasonality Insights for Le Vésinet
- The Airbnb seasonality in Le Vésinet shows highly seasonal trends requiring careful strategy. While the sections above show seasonal averages, it's also insightful to look at the extremes:
- During the high season, the absolute peak month showcases Le Vésinet's highest earning potential, with monthly revenues capable of climbing to $5,063, occupancy reaching a high of 48.6%, and ADRs peaking at $291.
- Conversely, the slowest single month of the year, typically falling within the low season, marks the market's lowest point. In this month, revenue might dip to $1,463, occupancy could drop to 33.1%, and ADRs may adjust down to $255.
- Understanding both the seasonal averages and these monthly peaks and troughs in revenue, occupancy, and ADR is crucial for maximizing your Airbnb profit potential in Le Vésinet.
Seasonal Strategies for Maximizing Profit
- Peak Season: Maximize revenue through premium pricing and potentially longer minimum stays. Ensure high availability.
- Low Season: Offer competitive pricing, special promotions (e.g., extended stay discounts), and flexible cancellation policies. Target off-season travelers like remote workers or budget-conscious guests.
- Shoulder Seasons: Implement dynamic pricing that balances peak and low rates. Target weekend travelers or specific events. Offer slightly more flexible terms than peak season.
- Regularly analyze your own performance against these Le Vésinet seasonality benchmarks and adjust your pricing and availability strategy accordingly.
Best Areas for Airbnb Investment in Le Vésinet (2025)
Exploring the top neighborhoods for short-term rentals in Le Vésinet? This section highlights key areas, outlining why they are attractive for hosts and guests, along with notable local attractions. Consider these locations based on your target guest profile and investment strategy.
| Neighborhood / Area | Why Host Here? (Target Guests & Appeal) | Key Attractions & Landmarks |
|---|---|---|
| Le Vésinet Centre | Charming area with a picturesque town center, known for its parks and proximity to Paris. Ideal for families and couples looking for a relaxing stay close to city amenities. | Parc des Iles, Château de Le Vésinet, Église Saint-Germain, Le Vésinet Lake, Local shops and cafes |
| Parc de la Butte Verte | A serene neighborhood surrounded by nature and parks, perfect for those wanting a quiet retreat while being close to urban conveniences. | Parc de la Butte Verte, Nature walks, Playgrounds, Local markets, Picnic areas |
| Le Montfort | Residential area known for its beautiful houses and green spaces, attracting families and professionals. Offers a peaceful environment with easy access to Paris. | Local parks, Community events, Cafes and restaurants, Residential charm |
| Les Ibis | A tranquil area with easy access to public transport and local amenities. Ideal for guests seeking comfort and accessibility to Paris. | Proximity to RER A, Gardens, Local shops, Cafes, Family-friendly environment |
| École Saint-Exupéry | A vibrant neighborhood with educational institutions and parks, attracting families and students looking for an enriching environment. | Schools, Parks, Playgrounds, Local community activities |
| La Jonchère | Known for its beautiful natural surroundings and outdoor activities, this area is perfect for nature lovers and those wanting to explore the outdoors. | Hiking trails, Natural reserves, Picnic spots, Outdoor sports areas |
| Rue de l'Indépendance | Centrally located with a mix of historical charm and modern convenience, suitable for guests wanting to explore local culture and history. | Local history, Cultural sites, Restaurants, Shopping areas |
| Place du Marché | A bustling area with a local market atmosphere, great for those wanting to experience local life and cuisine. | Weekly markets, Local produce, Restaurants, Community gatherings |
Understanding Airbnb License Requirements & STR Laws in Le Vésinet (2025)
While Le Vésinet, Ile-de-France, France currently shows low STR regulations, specific Airbnb license requirements might still exist or change. Always verify the latest short term rental regulations and Airbnb license requirements directly with local government authorities for Le Vésinet to ensure full compliance before hosting.
(Source: AirROI data, 2025, based on 1% licensed listings)
Top Performing Airbnb Properties in Le Vésinet (2025)
Benchmark your potential! Explore examples of top-performing Airbnb properties in Le Vésinetbased on Trailing Twelve Month (TTM) revenue. Analyze their characteristics, revenue, occupancy rate, and ADR to understand what drives success in this market.
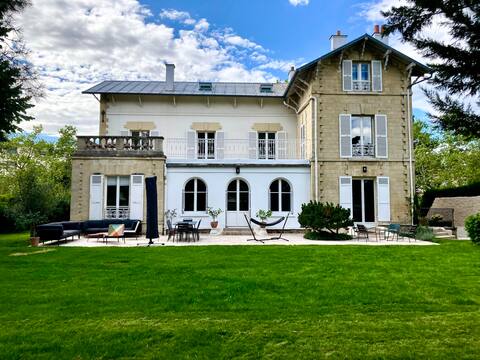
Belle maison dans la verdure proche de Paris
Entire Place • 5 bedrooms

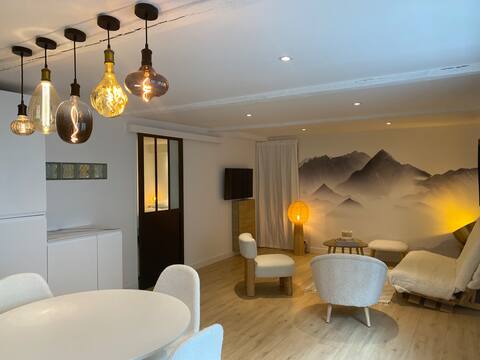
Comfortable and elegant house - 20 minutes from Paris
Entire Place • 6 bedrooms
Paris à 20mn rer T1bis independent luxury in villa
Entire Place • 1 bedroom

Le Vésinet, quiet house so close to Paris
Entire Place • 2 bedrooms

12p architect house, #nature #jaccuzzi, Paris@15'
Entire Place • 5 bedrooms

Charming house - Le Vésinet
Entire Place • 3 bedrooms
Note: Performance varies based on location, size, amenities, seasonality, and management quality. Data reflects the past 12 months.
Top Performing Airbnb Hosts in Le Vésinet (2025)
Learn from the best! This table showcases top-performing Airbnb hosts in Le Vésinet based on the number of properties managed and estimated total revenue over the past year. Analyze their scale and performance metrics.
| Host Name | Properties | Grossing Revenue | Stay Reviews | Avg Rating |
|---|---|---|---|---|
| Host #12138039 | 1 | $97,581 | 2 | 0.00/5.0 |
| Amaury | 1 | $84,842 | 38 | 4.82/5.0 |
| France Et Bruno | 1 | $59,665 | 45 | 5.00/5.0 |
| Chantal | 1 | $44,273 | 103 | 5.00/5.0 |
| Charlotte | 1 | $42,367 | 14 | 4.79/5.0 |
| Ma Cle Expertise | 3 | $38,369 | 17 | 1.59/5.0 |
| Cecile | 1 | $37,781 | 18 | 4.94/5.0 |
| Jessica | 1 | $35,043 | 77 | 4.97/5.0 |
| Host #5677880 | 1 | $33,172 | 0 | 0.00/5.0 |
| Christine | 1 | $31,605 | 43 | 4.88/5.0 |
Analyzing the strategies of top hosts, such as their property selection, pricing, and guest communication, can offer valuable lessons for optimizing your own Airbnb operations in Le Vésinet.
Dive Deeper: Advanced Le Vésinet STR Market Data (2025)
Ready to unlock more insights? AirROI provides access to advanced metrics and comprehensive Airbnb data for Le Vésinet. Explore detailed analytics beyond this report to refine your investment strategy, optimize pricing, and maximize your vacation rental profits.
Explore Advanced MetricsLe Vésinet Short-Term Rental Market Composition (2025): Property & Room Types
Room Type Distribution
Property Type Distribution
Market Composition Insights for Le Vésinet
- The Le Vésinet Airbnb market composition is heavily skewed towards Entire Home/Apt listings, which make up 93.5% of the 77 active rentals. This indicates strong guest preference for privacy and space.
- Looking at the property type distribution in Le Vésinet, House properties are the most common (51.9%), reflecting the local real estate landscape.
- Houses represent a significant 51.9% portion, catering likely to families or larger groups.
Le Vésinet Airbnb Room Capacity Analysis (2025): Bedroom Distribution
Distribution of Listings by Number of Bedrooms
Room Capacity Insights for Le Vésinet
- The dominant room capacity in Le Vésinet is 1 bedroom listings, making up 33.8% of the market. This suggests a strong demand for properties suitable for couples or solo travelers.
- Together, 1 bedroom and 2 bedrooms properties represent 57.2% of the active Airbnb listings in Le Vésinet, indicating a high concentration in these sizes.
- A significant 35.1% of listings offer 3+ bedrooms, catering to larger groups and families seeking more space in Le Vésinet.
Le Vésinet Vacation Rental Guest Capacity Trends (2025)
Distribution of Listings by Guest Capacity
Guest Capacity Insights for Le Vésinet
- The most common guest capacity trend in Le Vésinet vacation rentals is listings accommodating 4 guests (35.1%). This suggests the primary traveler segment is likely small families or groups.
- Properties designed for 4 guests and 8+ guests dominate the Le Vésinet STR market, accounting for 59.8% of listings.
- 35.1% of properties accommodate 6+ guests, serving the market segment for larger families or group travel in Le Vésinet.
- On average, properties in Le Vésinet are equipped to host 4.7 guests.
Le Vésinet Airbnb Booking Patterns (2025): Available vs. Booked Days
Available Days Distribution
Booked Days Distribution
Booking Pattern Insights for Le Vésinet
- The most common availability pattern in Le Vésinet falls within the 271-366 days range, representing 63.6% of listings. This suggests many properties have significant open periods on their calendars.
- Approximately 87.0% of listings show high availability (181+ days open annually), indicating potential for increased bookings or specific owner usage patterns.
- For booked days, the 1-30 days range is most frequent in Le Vésinet (32.5%), reflecting common guest stay durations or potential owner blocking patterns.
- A notable 13.0% of properties secure long booking periods (181+ days booked per year), highlighting successful long-term rental strategies or significant owner usage.
Le Vésinet Airbnb Minimum Stay Requirements Analysis
Distribution of Listings by Minimum Night Requirement
1 Night
9 listings
13.8% of total
2 Nights
13 listings
20% of total
3 Nights
18 listings
27.7% of total
4-6 Nights
12 listings
18.5% of total
7-29 Nights
8 listings
12.3% of total
30+ Nights
5 listings
7.7% of total
Key Insights
- The most prevalent minimum stay requirement in Le Vésinet is 3 Nights, adopted by 27.7% of listings. This highlights the market's preference for longer commitments.
Recommendations
- Align with the market by considering a 3 Nights minimum stay, as 27.7% of Le Vésinet hosts use this setting.
- If feasible, allowing 1-night stays, especially midweek or during low season, could capture last-minute bookings, as only 13.8% currently do.
- Explore offering discounts for stays of 30+ nights to attract the 7.7% of the market seeking extended stays.
- Adjust minimum nights based on seasonality – potentially shorter during low season and longer during peak demand periods in Le Vésinet.
Le Vésinet Airbnb Cancellation Policy Trends Analysis (2025)
Flexible
5 listings
11.4% of total
Moderate
24 listings
54.5% of total
Firm
7 listings
15.9% of total
Strict
8 listings
18.2% of total
Cancellation Policy Insights for Le Vésinet
- The prevailing Airbnb cancellation policy trend in Le Vésinet is Moderate, used by 54.5% of listings.
- There's a relatively balanced mix between guest-friendly (65.9%) and stricter (34.1%) policies, offering choices for different guest needs.
Recommendations for Hosts
- Consider adopting a Moderate policy to align with the 54.5% market standard in Le Vésinet.
- Regularly review your cancellation policy against competitors and market demand shifts in Le Vésinet.
Le Vésinet STR Booking Lead Time Analysis (2025)
Average Booking Lead Time by Month
Booking Lead Time Insights for Le Vésinet
- The overall average booking lead time for vacation rentals in Le Vésinet is 64 days.
- Guests book furthest in advance for stays during July (average 134 days), likely coinciding with peak travel demand or local events.
- The shortest booking windows occur for stays in February (average 29 days), indicating more last-minute travel plans during this time.
- Seasonally, Summer (121 days avg.) sees the longest lead times, while Winter (44 days avg.) has the shortest, reflecting typical travel planning cycles.
Recommendations for Hosts
- Use the overall average lead time (64 days) as a baseline for your pricing and availability strategy in Le Vésinet.
- For July stays, consider implementing length-of-stay discounts or slightly higher rates for bookings made less than 134 days out to capitalize on advance planning.
- Target marketing efforts for the Summer season well in advance (at least 121 days) to capture early planners.
- Monitor your own booking lead times against these Le Vésinet averages to identify opportunities for dynamic pricing adjustments.
Popular & Essential Airbnb Amenities in Le Vésinet (2025)
Amenity Prevalence
Amenity Insights for Le Vésinet
- Essential amenities in Le Vésinet that guests expect include: Heating, Kitchen, Wifi, Essentials. Lacking these (any) could significantly impact bookings.
- Popular amenities like Hot water, Smoke alarm, Washer are common but not universal. Offering these can provide a competitive edge.
Recommendations for Hosts
- Ensure your listing includes all essential amenities for Le Vésinet: Heating, Kitchen, Wifi, Essentials.
- Prioritize adding missing essentials: Heating, Kitchen, Wifi, Essentials.
- Consider adding popular differentiators like Hot water or Smoke alarm to increase appeal.
- Highlight unique or less common amenities you offer (e.g., hot tub, dedicated workspace, EV charger) in your listing description and photos.
- Regularly check competitor amenities in Le Vésinet to stay competitive.
Le Vésinet Airbnb Guest Demographics & Profile Analysis (2025)
Guest Profile Summary for Le Vésinet
- The typical guest profile for Airbnb in Le Vésinet consists of a mix of domestic (60%) and international guests, often arriving from nearby Paris, typically belonging to the Post-2000s (Gen Z/Alpha) group (50%), primarily speaking English or French.
- Domestic travelers account for 60.3% of guests.
- Key international markets include France (60.3%) and United States (9%).
- Top languages spoken are English (35.4%) followed by French (34.6%).
- A significant demographic segment is the Post-2000s (Gen Z/Alpha) group, representing 50% of guests.
Recommendations for Hosts
- Target domestic marketing efforts towards travelers from Paris and England.
- Tailor amenities and listing descriptions to appeal to the dominant Post-2000s (Gen Z/Alpha) demographic (e.g., highlight fast WiFi, smart home features, local guides).
- Highlight unique local experiences or amenities relevant to the primary guest profile.
- Consider seasonal promotions aligned with peak travel times for key origin markets.
Nearby Short-Term Rental Market Comparison
How does the Le Vésinet Airbnb market stack up against its neighbors? Compare key performance metrics like average monthly revenue, ADR, and occupancy rates in surrounding areas to understand the broader regional STR landscape.
| Market | Active Properties | Monthly Revenue | Daily Rate | Avg. Occupancy |
|---|---|---|---|---|
| Morienval | 10 | $5,794 | $400.84 | 32% |
| Verdelot | 13 | $3,885 | $300.79 | 46% |
| Trigny | 10 | $3,775 | $248.19 | 46% |
| La Couture-Boussey | 12 | $3,620 | $378.08 | 28% |
| Dourdan | 15 | $3,576 | $223.06 | 52% |
| Rosoy-en-Multien | 15 | $3,558 | $367.61 | 51% |
| Millançay | 11 | $3,476 | $370.42 | 39% |
| Chaintreaux | 11 | $3,136 | $278.28 | 34% |
| Langon-sur-Cher | 12 | $3,127 | $400.27 | 35% |
| Mesnils-sur-Iton | 22 | $3,028 | $309.05 | 40% |