La Ville-du-Bois Airbnb Market Analysis 2025: Short Term Rental Data & Vacation Rental Statistics in Ile-de-France, France
Is Airbnb profitable in La Ville-du-Bois in 2025? Explore comprehensive Airbnb analytics for La Ville-du-Bois, Ile-de-France, France to uncover income potential. This 2025 STR market report for La Ville-du-Bois, based on AirROI data from April 2024 to March 2025, reveals key trends in the niche market of 21 active listings.
Whether you're considering an Airbnb investment in La Ville-du-Bois, optimizing your existing vacation rental, or exploring rental arbitrage opportunities, understanding the La Ville-du-Bois Airbnb data is crucial. Leveraging the low regulation environment is key to maximizing your short term rental income potential. Let's dive into the specifics.
Key La Ville-du-Bois Airbnb Performance Metrics Overview
Monthly Airbnb Revenue Variations & Income Potential in La Ville-du-Bois (2025)
Understanding the monthly revenue variations for Airbnb listings in La Ville-du-Bois is key to maximizing your short term rental income potential. Seasonality significantly impacts earnings. Our analysis, based on data from the past 12 months, shows that the peak revenue month for STRs in La Ville-du-Bois is typically May, while March often presents the lowest earnings, highlighting opportunities for strategic pricing adjustments during shoulder and low seasons. Explore the typical Airbnb income in La Ville-du-Bois across different performance tiers:
- Best-in-class properties (Top 10%) achieve $3,447+ monthly, often utilizing dynamic pricing and superior guest experiences.
- Strong performing properties (Top 25%) earn $2,323 or more, indicating effective management and desirable locations/amenities.
- Typical properties (Median) generate around $1,304 per month, representing the average market performance.
- Entry-level properties (Bottom 25%) see earnings around $579, often with potential for optimization.
Average Monthly Airbnb Earnings Trend in La Ville-du-Bois
La Ville-du-Bois Airbnb Occupancy Rate Trends (2025)
Maximize your bookings by understanding the La Ville-du-Bois STR occupancy trends. Seasonal demand shifts significantly influence how often properties are booked. Typically, Februarysees the highest demand (peak season occupancy), while June experiences the lowest (low season). Effective strategies, like adjusting minimum stays or offering promotions, can boost occupancy during slower periods. Here's how different property tiers perform in La Ville-du-Bois:
- Best-in-class properties (Top 10%) achieve 79%+ occupancy, indicating high desirability and potentially optimized availability.
- Strong performing properties (Top 25%) maintain 52% or higher occupancy, suggesting good market fit and guest satisfaction.
- Typical properties (Median) have an occupancy rate around 29%.
- Entry-level properties (Bottom 25%) average 17% occupancy, potentially facing higher vacancy.
Average Monthly Occupancy Rate Trend in La Ville-du-Bois
Average Daily Rate (ADR) Airbnb Trends in La Ville-du-Bois (2025)
Effective short term rental pricing strategy in La Ville-du-Bois involves understanding monthly ADR fluctuations. The Average Daily Rate (ADR) for Airbnb in La Ville-du-Bois typically peaks in August and dips lowest during March. Leveraging Airbnb dynamic pricing tools or strategies based on this seasonality can significantly boost revenue. Here's a look at the typical nightly rates achieved:
- Best-in-class properties (Top 10%) command rates of $274+ per night, often due to premium features or locations.
- Strong performing properties (Top 25%) achieve nightly rates of $140 or more.
- Typical properties (Median) charge around $88 per night.
- Entry-level properties (Bottom 25%) earn around $62 per night.
Average Daily Rate (ADR) Trend by Month in La Ville-du-Bois
Get Live La Ville-du-Bois Market Intelligence 👇

Explore Real-time Analytics
Airbnb Seasonality Analysis & Trends in La Ville-du-Bois (2025)
Peak Season (May, April, June)
- Revenue averages $2,266 per month
- Occupancy rates average 35.2%
- Daily rates average $122
Shoulder Season
- Revenue averages $1,626 per month
- Occupancy maintains around 40.4%
- Daily rates hold near $123
Low Season (January, March, November)
- Revenue drops to average $1,284 per month
- Occupancy decreases to average 36.6%
- Daily rates adjust to average $114
Seasonality Insights for La Ville-du-Bois
- The Airbnb seasonality in La Ville-du-Bois shows highly seasonal trends requiring careful strategy. While the sections above show seasonal averages, it's also insightful to look at the extremes:
- During the high season, the absolute peak month showcases La Ville-du-Bois's highest earning potential, with monthly revenues capable of climbing to $2,381, occupancy reaching a high of 47.5%, and ADRs peaking at $137.
- Conversely, the slowest single month of the year, typically falling within the low season, marks the market's lowest point. In this month, revenue might dip to $1,094, occupancy could drop to 25.8%, and ADRs may adjust down to $111.
- Understanding both the seasonal averages and these monthly peaks and troughs in revenue, occupancy, and ADR is crucial for maximizing your Airbnb profit potential in La Ville-du-Bois.
Seasonal Strategies for Maximizing Profit
- Peak Season: Maximize revenue through premium pricing and potentially longer minimum stays. Ensure high availability.
- Low Season: Offer competitive pricing, special promotions (e.g., extended stay discounts), and flexible cancellation policies. Target off-season travelers like remote workers or budget-conscious guests.
- Shoulder Seasons: Implement dynamic pricing that balances peak and low rates. Target weekend travelers or specific events. Offer slightly more flexible terms than peak season.
- Regularly analyze your own performance against these La Ville-du-Bois seasonality benchmarks and adjust your pricing and availability strategy accordingly.
Best Areas for Airbnb Investment in La Ville-du-Bois (2025)
Exploring the top neighborhoods for short-term rentals in La Ville-du-Bois? This section highlights key areas, outlining why they are attractive for hosts and guests, along with notable local attractions. Consider these locations based on your target guest profile and investment strategy.
| Neighborhood / Area | Why Host Here? (Target Guests & Appeal) | Key Attractions & Landmarks |
|---|---|---|
| Le Centre de La Ville-du-Bois | The town center offers a charming village atmosphere, with quaint shops, cafes, and local markets. It's ideal for visitors looking for a peaceful stay away from the hustle and bustle of Paris while still enjoying local attractions. | Église Saint-Rémy, Parc de la Mairie, Marché local, Restaurant Le Petit Gascon, Promenade de la Ville-du-Bois |
| Parc Naturel Régional de la Haute Vallée de Chevreuse | Located on the outskirts of La Ville-du-Bois, this natural park offers beautiful landscapes and outdoor activities. It's perfect for guests who love nature and hiking, making it a unique spot for Airbnb hosting. | Hiking trails, Château de la Madeleine, Nature walks, Picnic areas, Vistas of the Chevreuse Valley |
| Brétigny-sur-Orge | A nearby town with excellent transport links to Paris, Brétigny offers a suburban vibe with amenities that attract families and professionals alike, making it an appealing choice for short-term rentals. | Église Saint-Martin, Brétigny-sur-Orge Lake, Local markets, Shopping centers, Parks and recreational areas |
| Évry-Courcouronnes | This nearby urban area boasts modern amenities and is close to the main transport links to Paris. It's attractive to business travelers and those needing easy access to the city while enjoying a suburban feel. | Évry Cathedral, Shopping mall Évry 2, Cultural center, Stadiums, Parks and gardens |
| Cesson | Cesson is a charming suburban area with access to the nearby nature parks. It's a great option for those looking to escape the city noise for a more tranquil stay, while still being close to urban amenities. | Cesson Park, Local eateries, Historic landmarks, Walking paths, Community events |
| Villejust | A peaceful neighborhood that provides a quiet retreat while being within traveling distance to Paris, Villejust is ideal for families and those looking for longer-term rentals in a suburban environment. | La Petite Venise, Local parks, Community pools, Shopping facilities, Cultural activities |
| Sainte-Geneviève-des-Bois | Known for its beautiful parks and vibrant community, this nearby town attracts visitors looking for a mix of suburban calm and easy access to Paris. Perfect for hosting families and tourists. | Cimetière Russe, Parc de la Ruette, Shopping centers, Cultural festivals, Family-friendly parks |
| Les Ulis | A modern suburb known for its business centers and accessibility, Les Ulis appeals to business travelers and those attending conferences in the greater Paris area, making it a lucrative choice for Airbnb investments. | Les Ulis shopping center, Parc des Aunettes, Cultural venues, Transportation hubs, Business parks |
Understanding Airbnb License Requirements & STR Laws in La Ville-du-Bois (2025)
While La Ville-du-Bois, Ile-de-France, France currently shows low STR regulations, specific Airbnb license requirements might still exist or change. Always verify the latest short term rental regulations and Airbnb license requirements directly with local government authorities for La Ville-du-Bois to ensure full compliance before hosting.
(Source: AirROI data, 2025, based on 10% licensed listings)
Top Performing Airbnb Properties in La Ville-du-Bois (2025)
Benchmark your potential! Explore examples of top-performing Airbnb properties in La Ville-du-Boisbased on Trailing Twelve Month (TTM) revenue. Analyze their characteristics, revenue, occupancy rate, and ADR to understand what drives success in this market.
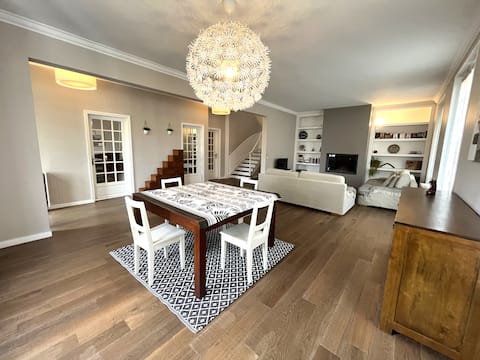
*Maison Du Bois*Close to Paris*Direct access N20*
Entire Place • 4 bedrooms
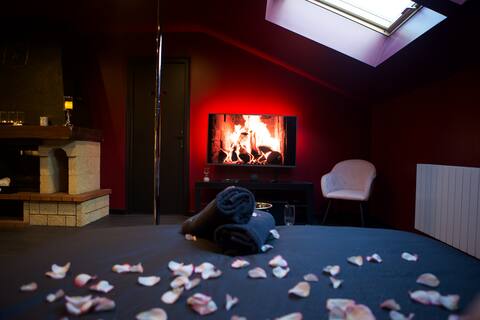
"Sensual Appointment: Love & Temptation Church"
Entire Place • 1 bedroom
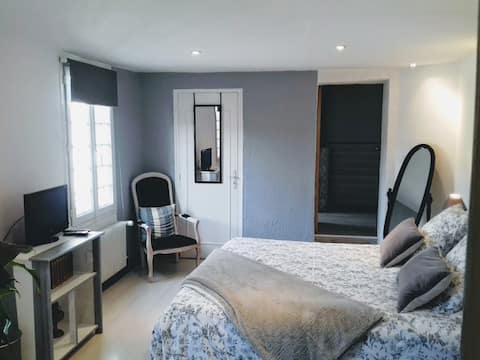
Double Chambre (4 pers) in VDB
Private Room • 2 bedrooms

T2 Cozy with terrace near PARIS/ORLY
Entire Place • 1 bedroom

2 room Apartment
Entire Place • 1 bedroom
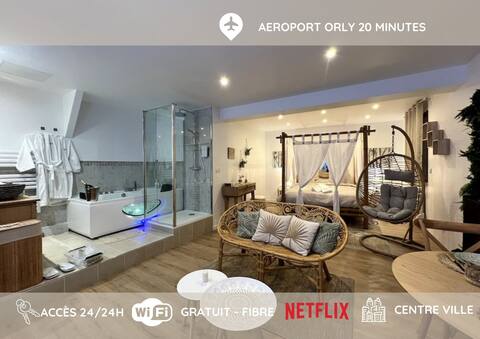
Bali Mon Amour: Enchanted Suite, Balnéo & SPA
Entire Place • 1 bedroom
Note: Performance varies based on location, size, amenities, seasonality, and management quality. Data reflects the past 12 months.
Top Performing Airbnb Hosts in La Ville-du-Bois (2025)
Learn from the best! This table showcases top-performing Airbnb hosts in La Ville-du-Bois based on the number of properties managed and estimated total revenue over the past year. Analyze their scale and performance metrics.
| Host Name | Properties | Grossing Revenue | Stay Reviews | Avg Rating |
|---|---|---|---|---|
| Rose & Thomas Raphael | 1 | $69,774 | 13 | 5.00/5.0 |
| Ludivine | 3 | $57,202 | 223 | 4.95/5.0 |
| Bertrand | 3 | $37,270 | 325 | 4.90/5.0 |
| Jonathan | 1 | $28,810 | 14 | 4.93/5.0 |
| Florent | 1 | $22,511 | 65 | 4.91/5.0 |
| Lj Conciergerie | 1 | $14,199 | 30 | 4.77/5.0 |
| Roselyne | 2 | $13,957 | 90 | 4.95/5.0 |
| Sofia | 1 | $11,745 | 3 | 5.00/5.0 |
| Marie | 1 | $10,956 | 9 | 4.89/5.0 |
| Host #448355572 | 1 | $6,347 | 0 | 0.00/5.0 |
Analyzing the strategies of top hosts, such as their property selection, pricing, and guest communication, can offer valuable lessons for optimizing your own Airbnb operations in La Ville-du-Bois.
Dive Deeper: Advanced La Ville-du-Bois STR Market Data (2025)
Ready to unlock more insights? AirROI provides access to advanced metrics and comprehensive Airbnb data for La Ville-du-Bois. Explore detailed analytics beyond this report to refine your investment strategy, optimize pricing, and maximize your vacation rental profits.
Explore Advanced MetricsLa Ville-du-Bois Short-Term Rental Market Composition (2025): Property & Room Types
Room Type Distribution
Property Type Distribution
Market Composition Insights for La Ville-du-Bois
- The La Ville-du-Bois Airbnb market composition is heavily skewed towards Entire Home/Apt listings, which make up 71.4% of the 21 active rentals. This indicates strong guest preference for privacy and space.
- Looking at the property type distribution in La Ville-du-Bois, House properties are the most common (52.4%), reflecting the local real estate landscape.
- Houses represent a significant 52.4% portion, catering likely to families or larger groups.
- Smaller segments like hotel/boutique (combined 4.8%) offer potential for unique stay experiences.
La Ville-du-Bois Airbnb Room Capacity Analysis (2025): Bedroom Distribution
Distribution of Listings by Number of Bedrooms
Room Capacity Insights for La Ville-du-Bois
- The dominant room capacity in La Ville-du-Bois is 1 bedroom listings, making up 47.6% of the market. This suggests a strong demand for properties suitable for couples or solo travelers.
- Together, 1 bedroom and 3 bedrooms properties represent 61.9% of the active Airbnb listings in La Ville-du-Bois, indicating a high concentration in these sizes.
- A significant 23.8% of listings offer 3+ bedrooms, catering to larger groups and families seeking more space in La Ville-du-Bois.
La Ville-du-Bois Vacation Rental Guest Capacity Trends (2025)
Distribution of Listings by Guest Capacity
Guest Capacity Insights for La Ville-du-Bois
- The most common guest capacity trend in La Ville-du-Bois vacation rentals is listings accommodating 2 guests (38.1%). This suggests the primary traveler segment is likely couples or solo travelers.
- Properties designed for 2 guests and 4 guests dominate the La Ville-du-Bois STR market, accounting for 52.4% of listings.
- 19.0% of properties accommodate 6+ guests, serving the market segment for larger families or group travel in La Ville-du-Bois.
- On average, properties in La Ville-du-Bois are equipped to host 2.7 guests.
La Ville-du-Bois Airbnb Booking Patterns (2025): Available vs. Booked Days
Available Days Distribution
Booked Days Distribution
Booking Pattern Insights for La Ville-du-Bois
- The most common availability pattern in La Ville-du-Bois falls within the 271-366 days range, representing 57.1% of listings. This suggests many properties have significant open periods on their calendars.
- Approximately 76.1% of listings show high availability (181+ days open annually), indicating potential for increased bookings or specific owner usage patterns.
- For booked days, the 31-90 days range is most frequent in La Ville-du-Bois (33.3%), reflecting common guest stay durations or potential owner blocking patterns.
- A notable 23.8% of properties secure long booking periods (181+ days booked per year), highlighting successful long-term rental strategies or significant owner usage.
La Ville-du-Bois Airbnb Minimum Stay Requirements Analysis
Distribution of Listings by Minimum Night Requirement
1 Night
9 listings
45% of total
2 Nights
5 listings
25% of total
3 Nights
2 listings
10% of total
4-6 Nights
2 listings
10% of total
7-29 Nights
1 listings
5% of total
30+ Nights
1 listings
5% of total
Key Insights
- The most prevalent minimum stay requirement in La Ville-du-Bois is 1 Night, adopted by 45% of listings. This highlights the market's preference for shorter, flexible bookings.
- A strong majority (70.0%) of the La Ville-du-Bois Airbnb data shows acceptance of very short stays (1-2 nights), indicating a dynamic, high-turnover market.
Recommendations
- Align with the market by considering a 1 Night minimum stay, as 45% of La Ville-du-Bois hosts use this setting.
- Adjust minimum nights based on seasonality – potentially shorter during low season and longer during peak demand periods in La Ville-du-Bois.
La Ville-du-Bois Airbnb Cancellation Policy Trends Analysis (2025)
Flexible
7 listings
38.9% of total
Moderate
6 listings
33.3% of total
Firm
1 listings
5.6% of total
Strict
4 listings
22.2% of total
Cancellation Policy Insights for La Ville-du-Bois
- The prevailing Airbnb cancellation policy trend in La Ville-du-Bois is Flexible, used by 38.9% of listings.
- The market strongly favors guest-friendly terms, with 72.2% of listings offering Flexible or Moderate policies. This suggests guests in La Ville-du-Bois may expect booking flexibility.
Recommendations for Hosts
- Consider adopting a Flexible policy to align with the 38.9% market standard in La Ville-du-Bois.
- Regularly review your cancellation policy against competitors and market demand shifts in La Ville-du-Bois.
La Ville-du-Bois STR Booking Lead Time Analysis (2025)
Average Booking Lead Time by Month
Booking Lead Time Insights for La Ville-du-Bois
- The overall average booking lead time for vacation rentals in La Ville-du-Bois is 45 days.
- Guests book furthest in advance for stays during July (average 65 days), likely coinciding with peak travel demand or local events.
- The shortest booking windows occur for stays in October (average 17 days), indicating more last-minute travel plans during this time.
- Seasonally, Summer (49 days avg.) sees the longest lead times, while Winter (22 days avg.) has the shortest, reflecting typical travel planning cycles.
Recommendations for Hosts
- Use the overall average lead time (45 days) as a baseline for your pricing and availability strategy in La Ville-du-Bois.
- For July stays, consider implementing length-of-stay discounts or slightly higher rates for bookings made less than 65 days out to capitalize on advance planning.
- Target marketing efforts for the Summer season well in advance (at least 49 days) to capture early planners.
- Monitor your own booking lead times against these La Ville-du-Bois averages to identify opportunities for dynamic pricing adjustments.
Popular & Essential Airbnb Amenities in La Ville-du-Bois (2025)
Amenity Prevalence
Amenity Insights for La Ville-du-Bois
- Essential amenities in La Ville-du-Bois that guests expect include: Kitchen, Smoke alarm, Hot water, Heating, Wifi. Lacking these (any) could significantly impact bookings.
- Popular amenities like Free parking on premises, Coffee maker, TV are common but not universal. Offering these can provide a competitive edge.
Recommendations for Hosts
- Ensure your listing includes all essential amenities for La Ville-du-Bois: Kitchen, Smoke alarm, Hot water, Heating, Wifi.
- Prioritize adding missing essentials: Wifi.
- Consider adding popular differentiators like Free parking on premises or Coffee maker to increase appeal.
- Highlight unique or less common amenities you offer (e.g., hot tub, dedicated workspace, EV charger) in your listing description and photos.
- Regularly check competitor amenities in La Ville-du-Bois to stay competitive.
La Ville-du-Bois Airbnb Guest Demographics & Profile Analysis (2025)
Guest Profile Summary for La Ville-du-Bois
- The typical guest profile for Airbnb in La Ville-du-Bois consists of primarily domestic travelers (77%), often arriving from nearby Paris, typically belonging to the Post-2000s (Gen Z/Alpha) group (50%), primarily speaking French or English.
- Domestic travelers account for 77.2% of guests.
- Key international markets include France (77.2%) and United Kingdom (5.4%).
- Top languages spoken are French (43%) followed by English (32.3%).
- A significant demographic segment is the Post-2000s (Gen Z/Alpha) group, representing 50% of guests.
Recommendations for Hosts
- Target domestic marketing efforts towards travelers from Paris and London.
- Tailor amenities and listing descriptions to appeal to the dominant Post-2000s (Gen Z/Alpha) demographic (e.g., highlight fast WiFi, smart home features, local guides).
- Highlight unique local experiences or amenities relevant to the primary guest profile.
- Consider seasonal promotions aligned with peak travel times for key origin markets.
Nearby Short-Term Rental Market Comparison
How does the La Ville-du-Bois Airbnb market stack up against its neighbors? Compare key performance metrics like average monthly revenue, ADR, and occupancy rates in surrounding areas to understand the broader regional STR landscape.
| Market | Active Properties | Monthly Revenue | Daily Rate | Avg. Occupancy |
|---|---|---|---|---|
| Morienval | 10 | $5,794 | $400.84 | 32% |
| Verdelot | 13 | $3,885 | $300.79 | 46% |
| Trigny | 10 | $3,775 | $248.19 | 46% |
| La Couture-Boussey | 12 | $3,620 | $378.08 | 28% |
| Dourdan | 15 | $3,576 | $223.06 | 52% |
| Rosoy-en-Multien | 15 | $3,558 | $367.61 | 51% |
| Millançay | 11 | $3,476 | $370.42 | 39% |
| Chaintreaux | 11 | $3,136 | $278.28 | 34% |
| Langon-sur-Cher | 12 | $3,127 | $400.27 | 35% |
| Mesnils-sur-Iton | 22 | $3,028 | $309.05 | 40% |