Franconville Airbnb Market Analysis 2025: Short Term Rental Data & Vacation Rental Statistics in Ile-de-France, France
Is Airbnb profitable in Franconville in 2025? Explore comprehensive Airbnb analytics for Franconville, Ile-de-France, France to uncover income potential. This 2025 STR market report for Franconville, based on AirROI data from April 2024 to March 2025, reveals key trends in the niche market of 79 active listings.
Whether you're considering an Airbnb investment in Franconville, optimizing your existing vacation rental, or exploring rental arbitrage opportunities, understanding the Franconville Airbnb data is crucial. Navigating the high regulation landscape is key to maximizing your short term rental income potential. Let's dive into the specifics.
Key Franconville Airbnb Performance Metrics Overview
Monthly Airbnb Revenue Variations & Income Potential in Franconville (2025)
Understanding the monthly revenue variations for Airbnb listings in Franconville is key to maximizing your short term rental income potential. Seasonality significantly impacts earnings. Our analysis, based on data from the past 12 months, shows that the peak revenue month for STRs in Franconville is typically June, while February often presents the lowest earnings, highlighting opportunities for strategic pricing adjustments during shoulder and low seasons. Explore the typical Airbnb income in Franconville across different performance tiers:
- Best-in-class properties (Top 10%) achieve $3,204+ monthly, often utilizing dynamic pricing and superior guest experiences.
- Strong performing properties (Top 25%) earn $2,327 or more, indicating effective management and desirable locations/amenities.
- Typical properties (Median) generate around $1,378 per month, representing the average market performance.
- Entry-level properties (Bottom 25%) see earnings around $676, often with potential for optimization.
Average Monthly Airbnb Earnings Trend in Franconville
Franconville Airbnb Occupancy Rate Trends (2025)
Maximize your bookings by understanding the Franconville STR occupancy trends. Seasonal demand shifts significantly influence how often properties are booked. Typically, Aprilsees the highest demand (peak season occupancy), while August experiences the lowest (low season). Effective strategies, like adjusting minimum stays or offering promotions, can boost occupancy during slower periods. Here's how different property tiers perform in Franconville:
- Best-in-class properties (Top 10%) achieve 84%+ occupancy, indicating high desirability and potentially optimized availability.
- Strong performing properties (Top 25%) maintain 65% or higher occupancy, suggesting good market fit and guest satisfaction.
- Typical properties (Median) have an occupancy rate around 40%.
- Entry-level properties (Bottom 25%) average 22% occupancy, potentially facing higher vacancy.
Average Monthly Occupancy Rate Trend in Franconville
Average Daily Rate (ADR) Airbnb Trends in Franconville (2025)
Effective short term rental pricing strategy in Franconville involves understanding monthly ADR fluctuations. The Average Daily Rate (ADR) for Airbnb in Franconville typically peaks in August and dips lowest during October. Leveraging Airbnb dynamic pricing tools or strategies based on this seasonality can significantly boost revenue. Here's a look at the typical nightly rates achieved:
- Best-in-class properties (Top 10%) command rates of $177+ per night, often due to premium features or locations.
- Strong performing properties (Top 25%) achieve nightly rates of $128 or more.
- Typical properties (Median) charge around $86 per night.
- Entry-level properties (Bottom 25%) earn around $60 per night.
Average Daily Rate (ADR) Trend by Month in Franconville
Get Live Franconville Market Intelligence 👇

Explore Real-time Analytics
Airbnb Seasonality Analysis & Trends in Franconville (2025)
Peak Season (June, April, May)
- Revenue averages $2,644 per month
- Occupancy rates average 45.0%
- Daily rates average $109
Shoulder Season
- Revenue averages $1,459 per month
- Occupancy maintains around 43.6%
- Daily rates hold near $109
Low Season (January, February, March)
- Revenue drops to average $1,162 per month
- Occupancy decreases to average 43.5%
- Daily rates adjust to average $105
Seasonality Insights for Franconville
- The Airbnb seasonality in Franconville shows highly seasonal trends requiring careful strategy. While the sections above show seasonal averages, it's also insightful to look at the extremes:
- During the high season, the absolute peak month showcases Franconville's highest earning potential, with monthly revenues capable of climbing to $2,673, occupancy reaching a high of 48.0%, and ADRs peaking at $116.
- Conversely, the slowest single month of the year, typically falling within the low season, marks the market's lowest point. In this month, revenue might dip to $1,016, occupancy could drop to 35.8%, and ADRs may adjust down to $102.
- Understanding both the seasonal averages and these monthly peaks and troughs in revenue, occupancy, and ADR is crucial for maximizing your Airbnb profit potential in Franconville.
Seasonal Strategies for Maximizing Profit
- Peak Season: Maximize revenue through premium pricing and potentially longer minimum stays. Ensure high availability.
- Low Season: Offer competitive pricing, special promotions (e.g., extended stay discounts), and flexible cancellation policies. Target off-season travelers like remote workers or budget-conscious guests.
- Shoulder Seasons: Implement dynamic pricing that balances peak and low rates. Target weekend travelers or specific events. Offer slightly more flexible terms than peak season.
- Regularly analyze your own performance against these Franconville seasonality benchmarks and adjust your pricing and availability strategy accordingly.
Best Areas for Airbnb Investment in Franconville (2025)
Exploring the top neighborhoods for short-term rentals in Franconville? This section highlights key areas, outlining why they are attractive for hosts and guests, along with notable local attractions. Consider these locations based on your target guest profile and investment strategy.
| Neighborhood / Area | Why Host Here? (Target Guests & Appeal) | Key Attractions & Landmarks |
|---|---|---|
| Centre-ville de Franconville | The bustling heart of Franconville features shops, cafes, and local restaurants. It's a prime location for guests who want to explore the local culture and amenities, making it a desirable spot for short-term rentals. | Église Saint-Pierre, Parc des Sports, Les marchés de Franconville, Les restaurants de cuisine locale |
| La machine à écrire | A charming residential area known for its quaint streets and peaceful environment, attracting families and couples looking for a quiet getaway close to Paris. | Parc de l'Île de la Jatte, Les jardins de la ville, Cafés pittoresques |
| Les Bouleaux | A suburban area offering a mix of nature and proximity to urban conveniences, appealing to nature lovers and those looking for a retreat from the city while still being close to Paris. | Forêt de Montmorency, Parc Naturel Régional, Sentiers de randonnée |
| Le Plateau | Known for its scenic views and outdoor spaces, this area is popular among outdoor enthusiasts, ideal for visitors seeking relaxing and adventurous stays with nature activities. | Parc de la mairie, Sentiers de randonnée, Vues panoramiques |
| Rue de la Gare | Close to public transport links, this area is perfect for travelers looking for easy access to Paris and the surrounding areas, making it a strategic choice for rentals. | Gare de Franconville - Le Plessis-Bouchard, Boulangeries and cafes nearby |
| Les Clairières | A newer development with modern amenities and family-friendly surroundings, suitable for hosting families and larger groups looking for comfort near urban areas. | Espaces verts, Parcs pour enfants, Commodités modernes |
| Hameau de la Basse | This tranquil hamlet-like area offers a unique escape with its quaint houses and serene atmosphere, appealing to travelers looking for a peaceful retreat. | Vieux châteaux, Sentiers de balade, Espaces verts |
| Côteaux de Cesson | Located on the outskirts, this area provides beautiful landscapes and a glimpse of rural life, drawing guests seeking a countryside experience while remaining close to the city. | Vignobles, Balades en nature, Grands espaces ouverts |
Understanding Airbnb License Requirements & STR Laws in Franconville (2025)
Yes, Franconville, Ile-de-France, France enforces high STR regulations. Obtaining a license and ensuring compliance is almost certainly required according to current 2025 STR laws. Always verify the latest short term rental regulations and Airbnb license requirements directly with local government authorities for Franconville to ensure full compliance before hosting.
(Source: AirROI data, 2025, based on 44% licensed listings)
Top Performing Airbnb Properties in Franconville (2025)
Benchmark your potential! Explore examples of top-performing Airbnb properties in Franconvillebased on Trailing Twelve Month (TTM) revenue. Analyze their characteristics, revenue, occupancy rate, and ADR to understand what drives success in this market.
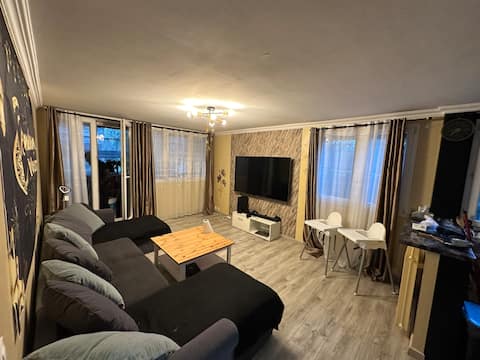
4 chambres à 25 mins de Paris
Entire Place • 4 bedrooms
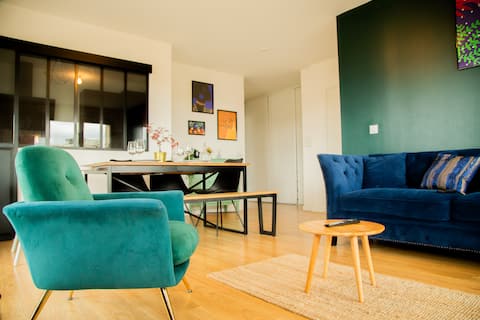
Apartment "La Havanaise"
Entire Place • 3 bedrooms

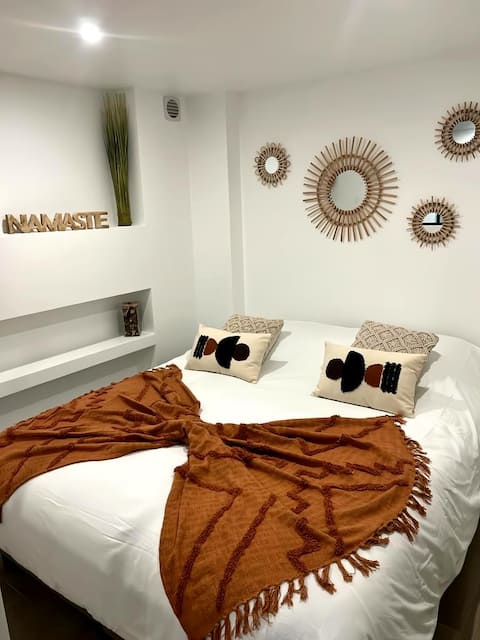
Cozy near train station Easy parking - Balcony #SirDest
Entire Place • 1 bedroom
Quiet in the heart of Séquoia.
Entire Place • 2 bedrooms
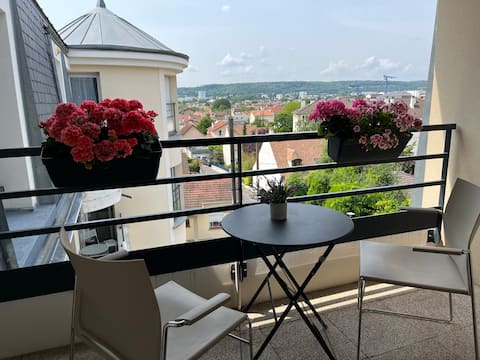
Cozy studio with terrace 2 minutes from the train station
Entire Place • 1 bedroom
Apartment with terrace and parking
Entire Place • 2 bedrooms
Note: Performance varies based on location, size, amenities, seasonality, and management quality. Data reflects the past 12 months.
Top Performing Airbnb Hosts in Franconville (2025)
Learn from the best! This table showcases top-performing Airbnb hosts in Franconville based on the number of properties managed and estimated total revenue over the past year. Analyze their scale and performance metrics.
| Host Name | Properties | Grossing Revenue | Stay Reviews | Avg Rating |
|---|---|---|---|---|
| Fadel | 2 | $47,592 | 16 | 5.00/5.0 |
| Host #27325364 | 1 | $43,585 | 0 | 0.00/5.0 |
| Djaka | 1 | $43,558 | 20 | 4.75/5.0 |
| Fadel | 2 | $40,293 | 20 | 4.80/5.0 |
| Mouloud | 1 | $28,165 | 29 | 5.00/5.0 |
| Lilia | 1 | $26,875 | 113 | 4.96/5.0 |
| Edouard | 1 | $26,109 | 29 | 4.97/5.0 |
| Vahab | 1 | $25,393 | 20 | 5.00/5.0 |
| Denise | 1 | $23,823 | 48 | 4.90/5.0 |
| Nicole | 1 | $23,676 | 7 | 5.00/5.0 |
Analyzing the strategies of top hosts, such as their property selection, pricing, and guest communication, can offer valuable lessons for optimizing your own Airbnb operations in Franconville.
Dive Deeper: Advanced Franconville STR Market Data (2025)
Ready to unlock more insights? AirROI provides access to advanced metrics and comprehensive Airbnb data for Franconville. Explore detailed analytics beyond this report to refine your investment strategy, optimize pricing, and maximize your vacation rental profits.
Explore Advanced MetricsFranconville Short-Term Rental Market Composition (2025): Property & Room Types
Room Type Distribution
Property Type Distribution
Market Composition Insights for Franconville
- The Franconville Airbnb market composition is heavily skewed towards Entire Home/Apt listings, which make up 81% of the 79 active rentals. This indicates strong guest preference for privacy and space.
- Looking at the property type distribution in Franconville, Apartment/Condo properties are the most common (75.9%), reflecting the local real estate landscape.
- Houses represent a significant 16.5% portion, catering likely to families or larger groups.
- The presence of 6.3% Hotel/Boutique listings indicates integration with traditional hospitality.
- Smaller segments like others (combined 1.3%) offer potential for unique stay experiences.
Franconville Airbnb Room Capacity Analysis (2025): Bedroom Distribution
Distribution of Listings by Number of Bedrooms
Room Capacity Insights for Franconville
- The dominant room capacity in Franconville is 1 bedroom listings, making up 53.2% of the market. This suggests a strong demand for properties suitable for couples or solo travelers.
- Together, 1 bedroom and 2 bedrooms properties represent 74.7% of the active Airbnb listings in Franconville, indicating a high concentration in these sizes.
- With over half the market (53.2%) consisting of studios or 1-bedroom units, Franconville is particularly well-suited for individuals or couples.
Franconville Vacation Rental Guest Capacity Trends (2025)
Distribution of Listings by Guest Capacity
Guest Capacity Insights for Franconville
- The most common guest capacity trend in Franconville vacation rentals is listings accommodating 4 guests (35.4%). This suggests the primary traveler segment is likely small families or groups.
- Properties designed for 4 guests and 2 guests dominate the Franconville STR market, accounting for 64.5% of listings.
- 12.7% of properties accommodate 6+ guests, serving the market segment for larger families or group travel in Franconville.
- On average, properties in Franconville are equipped to host 3.3 guests.
Franconville Airbnb Booking Patterns (2025): Available vs. Booked Days
Available Days Distribution
Booked Days Distribution
Booking Pattern Insights for Franconville
- The most common availability pattern in Franconville falls within the 271-366 days range, representing 49.4% of listings. This suggests many properties have significant open periods on their calendars.
- Approximately 86.1% of listings show high availability (181+ days open annually), indicating potential for increased bookings or specific owner usage patterns.
- For booked days, the 91-180 days range is most frequent in Franconville (36.7%), reflecting common guest stay durations or potential owner blocking patterns.
- A notable 14.0% of properties secure long booking periods (181+ days booked per year), highlighting successful long-term rental strategies or significant owner usage.
Franconville Airbnb Minimum Stay Requirements Analysis
Distribution of Listings by Minimum Night Requirement
1 Night
22 listings
35.5% of total
2 Nights
22 listings
35.5% of total
3 Nights
8 listings
12.9% of total
4-6 Nights
6 listings
9.7% of total
7-29 Nights
1 listings
1.6% of total
30+ Nights
3 listings
4.8% of total
Key Insights
- The most prevalent minimum stay requirement in Franconville is 1 Night, adopted by 35.5% of listings. This highlights the market's preference for shorter, flexible bookings.
- A strong majority (71.0%) of the Franconville Airbnb data shows acceptance of very short stays (1-2 nights), indicating a dynamic, high-turnover market.
Recommendations
- Align with the market by considering a 1 Night minimum stay, as 35.5% of Franconville hosts use this setting.
- Adjust minimum nights based on seasonality – potentially shorter during low season and longer during peak demand periods in Franconville.
Franconville Airbnb Cancellation Policy Trends Analysis (2025)
Flexible
19 listings
43.2% of total
Moderate
16 listings
36.4% of total
Firm
7 listings
15.9% of total
Strict
2 listings
4.5% of total
Cancellation Policy Insights for Franconville
- The prevailing Airbnb cancellation policy trend in Franconville is Flexible, used by 43.2% of listings.
- The market strongly favors guest-friendly terms, with 79.6% of listings offering Flexible or Moderate policies. This suggests guests in Franconville may expect booking flexibility.
- Strict cancellation policies are quite rare (4.5%), potentially making listings with this policy less competitive unless justified by high demand or property type.
Recommendations for Hosts
- Consider adopting a Flexible policy to align with the 43.2% market standard in Franconville.
- Using a Strict policy might deter some guests, as only 4.5% of listings use it. Evaluate if potential revenue protection outweighs possible lower booking rates.
- Regularly review your cancellation policy against competitors and market demand shifts in Franconville.
Franconville STR Booking Lead Time Analysis (2025)
Average Booking Lead Time by Month
Booking Lead Time Insights for Franconville
- The overall average booking lead time for vacation rentals in Franconville is 25 days.
- Guests book furthest in advance for stays during July (average 74 days), likely coinciding with peak travel demand or local events.
- The shortest booking windows occur for stays in November (average 20 days), indicating more last-minute travel plans during this time.
- Seasonally, Summer (52 days avg.) sees the longest lead times, while Fall (24 days avg.) has the shortest, reflecting typical travel planning cycles.
Recommendations for Hosts
- Use the overall average lead time (25 days) as a baseline for your pricing and availability strategy in Franconville.
- For July stays, consider implementing length-of-stay discounts or slightly higher rates for bookings made less than 74 days out to capitalize on advance planning.
- Target marketing efforts for the Summer season well in advance (at least 52 days) to capture early planners.
- Monitor your own booking lead times against these Franconville averages to identify opportunities for dynamic pricing adjustments.
Popular & Essential Airbnb Amenities in Franconville (2025)
Amenity Prevalence
Amenity Insights for Franconville
- Essential amenities in Franconville that guests expect include: TV, Wifi, Kitchen. Lacking these (any) could significantly impact bookings.
- Popular amenities like Heating, Hot water, Washer are common but not universal. Offering these can provide a competitive edge.
Recommendations for Hosts
- Ensure your listing includes all essential amenities for Franconville: TV, Wifi, Kitchen.
- Prioritize adding missing essentials: TV, Wifi, Kitchen.
- Consider adding popular differentiators like Heating or Hot water to increase appeal.
- Highlight unique or less common amenities you offer (e.g., hot tub, dedicated workspace, EV charger) in your listing description and photos.
- Regularly check competitor amenities in Franconville to stay competitive.
Franconville Airbnb Guest Demographics & Profile Analysis (2025)
Guest Profile Summary for Franconville
- The typical guest profile for Airbnb in Franconville consists of primarily domestic travelers (76%), often arriving from nearby Paris, typically belonging to the Post-2000s (Gen Z/Alpha) group (50%), primarily speaking French or English.
- Domestic travelers account for 76.4% of guests.
- Key international markets include France (76.4%) and United Kingdom (5.6%).
- Top languages spoken are French (42.3%) followed by English (29.7%).
- A significant demographic segment is the Post-2000s (Gen Z/Alpha) group, representing 50% of guests.
Recommendations for Hosts
- Target domestic marketing efforts towards travelers from Paris and Lille.
- Tailor amenities and listing descriptions to appeal to the dominant Post-2000s (Gen Z/Alpha) demographic (e.g., highlight fast WiFi, smart home features, local guides).
- Highlight unique local experiences or amenities relevant to the primary guest profile.
- Consider seasonal promotions aligned with peak travel times for key origin markets.
Nearby Short-Term Rental Market Comparison
How does the Franconville Airbnb market stack up against its neighbors? Compare key performance metrics like average monthly revenue, ADR, and occupancy rates in surrounding areas to understand the broader regional STR landscape.
| Market | Active Properties | Monthly Revenue | Daily Rate | Avg. Occupancy |
|---|---|---|---|---|
| Morienval | 10 | $5,794 | $400.84 | 32% |
| Verdelot | 13 | $3,885 | $300.79 | 46% |
| Trigny | 10 | $3,775 | $248.19 | 46% |
| La Couture-Boussey | 12 | $3,620 | $378.08 | 28% |
| Dourdan | 15 | $3,576 | $223.06 | 52% |
| Rosoy-en-Multien | 15 | $3,558 | $367.61 | 51% |
| Millançay | 11 | $3,476 | $370.42 | 39% |
| Chaintreaux | 11 | $3,136 | $278.28 | 34% |
| Langon-sur-Cher | 12 | $3,127 | $400.27 | 35% |
| Mesnils-sur-Iton | 22 | $3,028 | $309.05 | 40% |