Colombes Airbnb Market Analysis 2025: Short Term Rental Data & Vacation Rental Statistics in Ile-de-France, France
Is Airbnb profitable in Colombes in 2025? Explore comprehensive Airbnb analytics for Colombes, Ile-de-France, France to uncover income potential. This 2025 STR market report for Colombes, based on AirROI data from April 2024 to March 2025, reveals key trends in the market of 630 active listings.
Whether you're considering an Airbnb investment in Colombes, optimizing your existing vacation rental, or exploring rental arbitrage opportunities, understanding the Colombes Airbnb data is crucial. Navigating the high regulation landscape is key to maximizing your short term rental income potential. Let's dive into the specifics.
Key Colombes Airbnb Performance Metrics Overview
Monthly Airbnb Revenue Variations & Income Potential in Colombes (2025)
Understanding the monthly revenue variations for Airbnb listings in Colombes is key to maximizing your short term rental income potential. Seasonality significantly impacts earnings. Our analysis, based on data from the past 12 months, shows that the peak revenue month for STRs in Colombes is typically July, while February often presents the lowest earnings, highlighting opportunities for strategic pricing adjustments during shoulder and low seasons. Explore the typical Airbnb income in Colombes across different performance tiers:
- Best-in-class properties (Top 10%) achieve $4,217+ monthly, often utilizing dynamic pricing and superior guest experiences.
- Strong performing properties (Top 25%) earn $2,535 or more, indicating effective management and desirable locations/amenities.
- Typical properties (Median) generate around $1,402 per month, representing the average market performance.
- Entry-level properties (Bottom 25%) see earnings around $684, often with potential for optimization.
Average Monthly Airbnb Earnings Trend in Colombes
Colombes Airbnb Occupancy Rate Trends (2025)
Maximize your bookings by understanding the Colombes STR occupancy trends. Seasonal demand shifts significantly influence how often properties are booked. Typically, Octobersees the highest demand (peak season occupancy), while March experiences the lowest (low season). Effective strategies, like adjusting minimum stays or offering promotions, can boost occupancy during slower periods. Here's how different property tiers perform in Colombes:
- Best-in-class properties (Top 10%) achieve 84%+ occupancy, indicating high desirability and potentially optimized availability.
- Strong performing properties (Top 25%) maintain 67% or higher occupancy, suggesting good market fit and guest satisfaction.
- Typical properties (Median) have an occupancy rate around 39%.
- Entry-level properties (Bottom 25%) average 20% occupancy, potentially facing higher vacancy.
Average Monthly Occupancy Rate Trend in Colombes
Average Daily Rate (ADR) Airbnb Trends in Colombes (2025)
Effective short term rental pricing strategy in Colombes involves understanding monthly ADR fluctuations. The Average Daily Rate (ADR) for Airbnb in Colombes typically peaks in August and dips lowest during March. Leveraging Airbnb dynamic pricing tools or strategies based on this seasonality can significantly boost revenue. Here's a look at the typical nightly rates achieved:
- Best-in-class properties (Top 10%) command rates of $418+ per night, often due to premium features or locations.
- Strong performing properties (Top 25%) achieve nightly rates of $213 or more.
- Typical properties (Median) charge around $115 per night.
- Entry-level properties (Bottom 25%) earn around $73 per night.
Average Daily Rate (ADR) Trend by Month in Colombes
Get Live Colombes Market Intelligence 👇

Explore Real-time Analytics
Airbnb Seasonality Analysis & Trends in Colombes (2025)
Peak Season (July, May, June)
- Revenue averages $2,728 per month
- Occupancy rates average 44.3%
- Daily rates average $199
Shoulder Season
- Revenue averages $1,924 per month
- Occupancy maintains around 44.3%
- Daily rates hold near $193
Low Season (January, February, March)
- Revenue drops to average $1,346 per month
- Occupancy decreases to average 40.9%
- Daily rates adjust to average $183
Seasonality Insights for Colombes
- The Airbnb seasonality in Colombes shows highly seasonal trends requiring careful strategy. While the sections above show seasonal averages, it's also insightful to look at the extremes:
- During the high season, the absolute peak month showcases Colombes's highest earning potential, with monthly revenues capable of climbing to $3,072, occupancy reaching a high of 49.0%, and ADRs peaking at $209.
- Conversely, the slowest single month of the year, typically falling within the low season, marks the market's lowest point. In this month, revenue might dip to $1,256, occupancy could drop to 39.1%, and ADRs may adjust down to $181.
- Understanding both the seasonal averages and these monthly peaks and troughs in revenue, occupancy, and ADR is crucial for maximizing your Airbnb profit potential in Colombes.
Seasonal Strategies for Maximizing Profit
- Peak Season: Maximize revenue through premium pricing and potentially longer minimum stays. Ensure high availability.
- Low Season: Offer competitive pricing, special promotions (e.g., extended stay discounts), and flexible cancellation policies. Target off-season travelers like remote workers or budget-conscious guests.
- Shoulder Seasons: Implement dynamic pricing that balances peak and low rates. Target weekend travelers or specific events. Offer slightly more flexible terms than peak season.
- Regularly analyze your own performance against these Colombes seasonality benchmarks and adjust your pricing and availability strategy accordingly.
Best Areas for Airbnb Investment in Colombes (2025)
Exploring the top neighborhoods for short-term rentals in Colombes? This section highlights key areas, outlining why they are attractive for hosts and guests, along with notable local attractions. Consider these locations based on your target guest profile and investment strategy.
| Neighborhood / Area | Why Host Here? (Target Guests & Appeal) | Key Attractions & Landmarks |
|---|---|---|
| Colombes Center | The heart of Colombes, offering convenient access to shops, restaurants, and public transport. A desirable location for visitors due to its local charm and proximity to Paris. | Colombes Market, Stade Yves-du-Manoir, Parc Pierre-Lagravère, Église de Colombes, Les Quatre Temps |
| Les Champs-Philippe | A family-friendly neighborhood with parks and schools, attractive for longer-term stays. Ideal for guests who prefer a residential, suburban feel near the city. | Parc des Anges, College Jean Jaurès, Place de l'Europe, Cimetiere de Colombes |
| La Lavandières | Known for its greenery and tranquility, this area appeals to guests looking for a peaceful retreat. Close to nature and perfect for those wanting a break from urban life. | Parc des Hautes Plaines, Parc des Évêques, Les Jardins de l'île |
| Les Fossés Jean | A vibrant, local neighborhood with a mix of traditional and modern aspects. Attractive for visitors wanting to immerse themselves in the local culture of Colombes. | Stade de rugby, Espace Cirque, Café de l'Espace public |
| Gare de Colombes | Conveniently located near the train station, this area is perfect for tourists and business travelers seeking easy commuting options to central Paris. | Gare de Colombes, Parc de la Mairie, Café de la Gare |
| Les Vallées | A serene neighborhood known for its residential vibe, ideal for families and those looking to explore the outskirts of Paris. | Parc de la Ravinière, Les Sentiers de Colombes, Église Saint-Pierre |
| Quartier des Grèves | A historic district with quaint architecture and local shops, offering a unique glimpse into the past of Colombes. Great for travelers seeking charm. | Villa des Grèves, Chemin des Grèves, Vieux Colombes |
| Parc Pierre-Lagravère | A recreational area that draws both locals and tourists, making it a wonderful spot for those who enjoy outdoor activities and family outings. | Parc Pierre-Lagravère, Lac de Colombes, Les Pelles de Colombes |
Understanding Airbnb License Requirements & STR Laws in Colombes (2025)
Yes, Colombes, Ile-de-France, France enforces high STR regulations. Obtaining a license and ensuring compliance is almost certainly required according to current 2025 STR laws. Always verify the latest short term rental regulations and Airbnb license requirements directly with local government authorities for Colombes to ensure full compliance before hosting.
(Source: AirROI data, 2025, based on 35% licensed listings)
Top Performing Airbnb Properties in Colombes (2025)
Benchmark your potential! Explore examples of top-performing Airbnb properties in Colombesbased on Trailing Twelve Month (TTM) revenue. Analyze their characteristics, revenue, occupancy rate, and ADR to understand what drives success in this market.
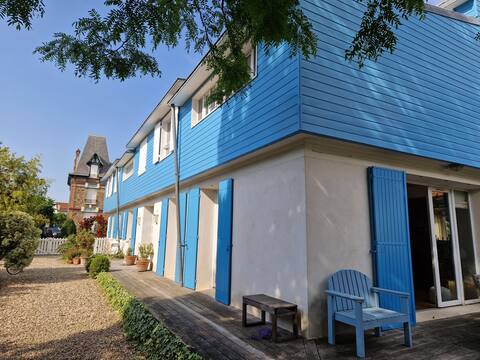
Maison spacieuse au calme
Entire Place • 5 bedrooms

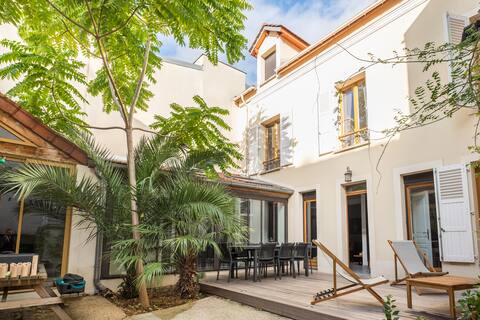
Family home garden, air conditioning, sauna, near Paris
Entire Place • 5 bedrooms
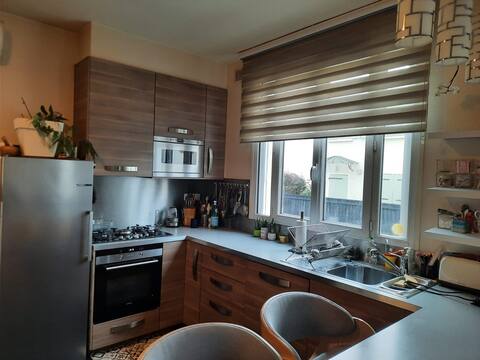
Très belle maison familiale
Entire Place • 4 bedrooms

Résidence Nimrod Abraham | ParisLaDefense
Entire Place • 2 bedrooms
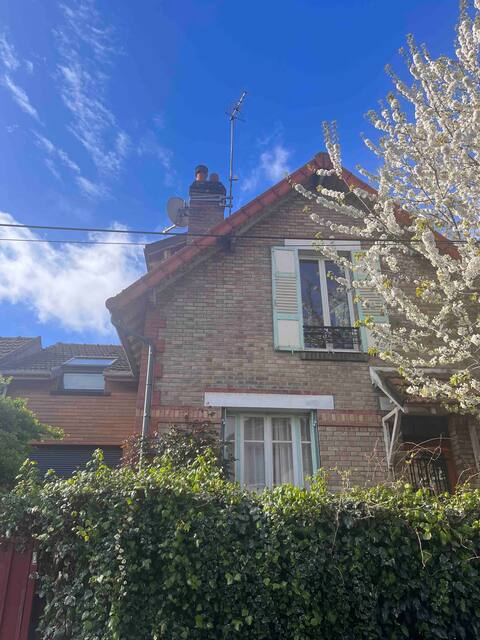
maison avec cour plein sud
Entire Place • 2 bedrooms
Charmante maison à Colombes 9 pièces 160 m2
Entire Place • 7 bedrooms
Note: Performance varies based on location, size, amenities, seasonality, and management quality. Data reflects the past 12 months.
Top Performing Airbnb Hosts in Colombes (2025)
Learn from the best! This table showcases top-performing Airbnb hosts in Colombes based on the number of properties managed and estimated total revenue over the past year. Analyze their scale and performance metrics.
| Host Name | Properties | Grossing Revenue | Stay Reviews | Avg Rating |
|---|---|---|---|---|
| Heritier Abraham | 3 | $130,639 | 331 | 4.85/5.0 |
| Jean Manuel | 2 | $106,353 | 33 | 2.44/5.0 |
| Host #30281371 | 1 | $93,658 | 0 | 0.00/5.0 |
| Léonard | 1 | $84,240 | 9 | 5.00/5.0 |
| Host #6290220 | 1 | $71,444 | 0 | 0.00/5.0 |
| Host #98933431 | 1 | $64,733 | 0 | 0.00/5.0 |
| Sebastian | 2 | $64,660 | 35 | 2.42/5.0 |
| Host #102614173 | 4 | $61,392 | 3 | 0.00/5.0 |
| Host #23847168 | 1 | $58,110 | 14 | 4.71/5.0 |
| Germain | 4 | $55,924 | 81 | 3.68/5.0 |
Analyzing the strategies of top hosts, such as their property selection, pricing, and guest communication, can offer valuable lessons for optimizing your own Airbnb operations in Colombes.
Dive Deeper: Advanced Colombes STR Market Data (2025)
Ready to unlock more insights? AirROI provides access to advanced metrics and comprehensive Airbnb data for Colombes. Explore detailed analytics beyond this report to refine your investment strategy, optimize pricing, and maximize your vacation rental profits.
Explore Advanced MetricsColombes Short-Term Rental Market Composition (2025): Property & Room Types
Room Type Distribution
Property Type Distribution
Market Composition Insights for Colombes
- The Colombes Airbnb market composition is heavily skewed towards Entire Home/Apt listings, which make up 75.2% of the 630 active rentals. This indicates strong guest preference for privacy and space.
- Looking at the property type distribution in Colombes, Apartment/Condo properties are the most common (66.8%), reflecting the local real estate landscape.
- Houses represent a significant 27.9% portion, catering likely to families or larger groups.
- Smaller segments like hotel/boutique, others (combined 5.2%) offer potential for unique stay experiences.
Colombes Airbnb Room Capacity Analysis (2025): Bedroom Distribution
Distribution of Listings by Number of Bedrooms
Room Capacity Insights for Colombes
- The dominant room capacity in Colombes is 1 bedroom listings, making up 45.1% of the market. This suggests a strong demand for properties suitable for couples or solo travelers.
- Together, 1 bedroom and 2 bedrooms properties represent 63.5% of the active Airbnb listings in Colombes, indicating a high concentration in these sizes.
Colombes Vacation Rental Guest Capacity Trends (2025)
Distribution of Listings by Guest Capacity
Guest Capacity Insights for Colombes
- The most common guest capacity trend in Colombes vacation rentals is listings accommodating 4 guests (25.2%). This suggests the primary traveler segment is likely small families or groups.
- Properties designed for 4 guests and 2 guests dominate the Colombes STR market, accounting for 50.0% of listings.
- 23.5% of properties accommodate 6+ guests, serving the market segment for larger families or group travel in Colombes.
- On average, properties in Colombes are equipped to host 3.6 guests.
Colombes Airbnb Booking Patterns (2025): Available vs. Booked Days
Available Days Distribution
Booked Days Distribution
Booking Pattern Insights for Colombes
- The most common availability pattern in Colombes falls within the 271-366 days range, representing 65.4% of listings. This suggests many properties have significant open periods on their calendars.
- Approximately 86.0% of listings show high availability (181+ days open annually), indicating potential for increased bookings or specific owner usage patterns.
- For booked days, the 1-30 days range is most frequent in Colombes (33.2%), reflecting common guest stay durations or potential owner blocking patterns.
- A notable 14.7% of properties secure long booking periods (181+ days booked per year), highlighting successful long-term rental strategies or significant owner usage.
Colombes Airbnb Minimum Stay Requirements Analysis
Distribution of Listings by Minimum Night Requirement
1 Night
145 listings
28.9% of total
2 Nights
156 listings
31.1% of total
3 Nights
63 listings
12.6% of total
4-6 Nights
54 listings
10.8% of total
7-29 Nights
29 listings
5.8% of total
30+ Nights
54 listings
10.8% of total
Key Insights
- The most prevalent minimum stay requirement in Colombes is 2 Nights, adopted by 31.1% of listings. This highlights the market's preference for shorter, flexible bookings.
- A significant segment (10.8%) caters to monthly stays (30+ nights) in Colombes, pointing to opportunities in the extended-stay market.
Recommendations
- Align with the market by considering a 2 Nights minimum stay, as 31.1% of Colombes hosts use this setting.
- If feasible, allowing 1-night stays, especially midweek or during low season, could capture last-minute bookings, as only 28.9% currently do.
- Explore offering discounts for stays of 30+ nights to attract the 10.8% of the market seeking extended stays.
- Adjust minimum nights based on seasonality – potentially shorter during low season and longer during peak demand periods in Colombes.
Colombes Airbnb Cancellation Policy Trends Analysis (2025)
Super Strict 60 Days
1 listings
0.3% of total
Flexible
83 listings
26.9% of total
Moderate
96 listings
31.1% of total
Firm
68 listings
22% of total
Strict
61 listings
19.7% of total
Cancellation Policy Insights for Colombes
- The prevailing Airbnb cancellation policy trend in Colombes is Moderate, used by 31.1% of listings.
- There's a relatively balanced mix between guest-friendly (58.0%) and stricter (41.7%) policies, offering choices for different guest needs.
Recommendations for Hosts
- Consider adopting a Moderate policy to align with the 31.1% market standard in Colombes.
- Regularly review your cancellation policy against competitors and market demand shifts in Colombes.
Colombes STR Booking Lead Time Analysis (2025)
Average Booking Lead Time by Month
Booking Lead Time Insights for Colombes
- The overall average booking lead time for vacation rentals in Colombes is 40 days.
- Guests book furthest in advance for stays during July (average 111 days), likely coinciding with peak travel demand or local events.
- The shortest booking windows occur for stays in February (average 31 days), indicating more last-minute travel plans during this time.
- Seasonally, Summer (83 days avg.) sees the longest lead times, while Winter (33 days avg.) has the shortest, reflecting typical travel planning cycles.
Recommendations for Hosts
- Use the overall average lead time (40 days) as a baseline for your pricing and availability strategy in Colombes.
- For July stays, consider implementing length-of-stay discounts or slightly higher rates for bookings made less than 111 days out to capitalize on advance planning.
- Target marketing efforts for the Summer season well in advance (at least 83 days) to capture early planners.
- Monitor your own booking lead times against these Colombes averages to identify opportunities for dynamic pricing adjustments.
Popular & Essential Airbnb Amenities in Colombes (2025)
Amenity Prevalence
Amenity Insights for Colombes
- Essential amenities in Colombes that guests expect include: Wifi, Kitchen. Lacking these (any) could significantly impact bookings.
- Popular amenities like Heating, Hot water, Smoke alarm are common but not universal. Offering these can provide a competitive edge.
Recommendations for Hosts
- Ensure your listing includes all essential amenities for Colombes: Wifi, Kitchen.
- Prioritize adding missing essentials: Wifi, Kitchen.
- Consider adding popular differentiators like Heating or Hot water to increase appeal.
- Highlight unique or less common amenities you offer (e.g., hot tub, dedicated workspace, EV charger) in your listing description and photos.
- Regularly check competitor amenities in Colombes to stay competitive.
Colombes Airbnb Guest Demographics & Profile Analysis (2025)
Guest Profile Summary for Colombes
- The typical guest profile for Airbnb in Colombes consists of a mix of domestic (55%) and international guests, often arriving from nearby Paris, typically belonging to the Post-2000s (Gen Z/Alpha) group (50%), primarily speaking English or French.
- Domestic travelers account for 54.5% of guests.
- Key international markets include France (54.5%) and United Kingdom (7.2%).
- Top languages spoken are English (35.9%) followed by French (29.7%).
- A significant demographic segment is the Post-2000s (Gen Z/Alpha) group, representing 50% of guests.
Recommendations for Hosts
- Balance marketing efforts between domestic and international channels based on the guest mix.
- Tailor amenities and listing descriptions to appeal to the dominant Post-2000s (Gen Z/Alpha) demographic (e.g., highlight fast WiFi, smart home features, local guides).
- Highlight unique local experiences or amenities relevant to the primary guest profile.
- Consider seasonal promotions aligned with peak travel times for key origin markets.
Nearby Short-Term Rental Market Comparison
How does the Colombes Airbnb market stack up against its neighbors? Compare key performance metrics like average monthly revenue, ADR, and occupancy rates in surrounding areas to understand the broader regional STR landscape.
| Market | Active Properties | Monthly Revenue | Daily Rate | Avg. Occupancy |
|---|---|---|---|---|
| Morienval | 10 | $5,794 | $400.84 | 32% |
| Verdelot | 13 | $3,885 | $300.79 | 46% |
| Trigny | 10 | $3,775 | $248.19 | 46% |
| La Couture-Boussey | 12 | $3,620 | $378.08 | 28% |
| Dourdan | 15 | $3,576 | $223.06 | 52% |
| Rosoy-en-Multien | 15 | $3,558 | $367.61 | 51% |
| Millançay | 11 | $3,476 | $370.42 | 39% |
| Chaintreaux | 11 | $3,136 | $278.28 | 34% |
| Langon-sur-Cher | 12 | $3,127 | $400.27 | 35% |
| Mesnils-sur-Iton | 22 | $3,028 | $309.05 | 40% |