Châtenay-Malabry Airbnb Market Analysis 2025: Short Term Rental Data & Vacation Rental Statistics in Ile-de-France, France
Is Airbnb profitable in Châtenay-Malabry in 2025? Explore comprehensive Airbnb analytics for Châtenay-Malabry, Ile-de-France, France to uncover income potential. This 2025 STR market report for Châtenay-Malabry, based on AirROI data from April 2024 to March 2025, reveals key trends in the niche market of 85 active listings.
Whether you're considering an Airbnb investment in Châtenay-Malabry, optimizing your existing vacation rental, or exploring rental arbitrage opportunities, understanding the Châtenay-Malabry Airbnb data is crucial. Leveraging the low regulation environment is key to maximizing your short term rental income potential. Let's dive into the specifics.
Key Châtenay-Malabry Airbnb Performance Metrics Overview
Monthly Airbnb Revenue Variations & Income Potential in Châtenay-Malabry (2025)
Understanding the monthly revenue variations for Airbnb listings in Châtenay-Malabry is key to maximizing your short term rental income potential. Seasonality significantly impacts earnings. Our analysis, based on data from the past 12 months, shows that the peak revenue month for STRs in Châtenay-Malabry is typically June, while March often presents the lowest earnings, highlighting opportunities for strategic pricing adjustments during shoulder and low seasons. Explore the typical Airbnb income in Châtenay-Malabry across different performance tiers:
- Best-in-class properties (Top 10%) achieve $3,457+ monthly, often utilizing dynamic pricing and superior guest experiences.
- Strong performing properties (Top 25%) earn $2,347 or more, indicating effective management and desirable locations/amenities.
- Typical properties (Median) generate around $1,255 per month, representing the average market performance.
- Entry-level properties (Bottom 25%) see earnings around $554, often with potential for optimization.
Average Monthly Airbnb Earnings Trend in Châtenay-Malabry
Châtenay-Malabry Airbnb Occupancy Rate Trends (2025)
Maximize your bookings by understanding the Châtenay-Malabry STR occupancy trends. Seasonal demand shifts significantly influence how often properties are booked. Typically, Octobersees the highest demand (peak season occupancy), while August experiences the lowest (low season). Effective strategies, like adjusting minimum stays or offering promotions, can boost occupancy during slower periods. Here's how different property tiers perform in Châtenay-Malabry:
- Best-in-class properties (Top 10%) achieve 81%+ occupancy, indicating high desirability and potentially optimized availability.
- Strong performing properties (Top 25%) maintain 60% or higher occupancy, suggesting good market fit and guest satisfaction.
- Typical properties (Median) have an occupancy rate around 37%.
- Entry-level properties (Bottom 25%) average 20% occupancy, potentially facing higher vacancy.
Average Monthly Occupancy Rate Trend in Châtenay-Malabry
Average Daily Rate (ADR) Airbnb Trends in Châtenay-Malabry (2025)
Effective short term rental pricing strategy in Châtenay-Malabry involves understanding monthly ADR fluctuations. The Average Daily Rate (ADR) for Airbnb in Châtenay-Malabry typically peaks in August and dips lowest during October. Leveraging Airbnb dynamic pricing tools or strategies based on this seasonality can significantly boost revenue. Here's a look at the typical nightly rates achieved:
- Best-in-class properties (Top 10%) command rates of $219+ per night, often due to premium features or locations.
- Strong performing properties (Top 25%) achieve nightly rates of $136 or more.
- Typical properties (Median) charge around $94 per night.
- Entry-level properties (Bottom 25%) earn around $62 per night.
Average Daily Rate (ADR) Trend by Month in Châtenay-Malabry
Get Live Châtenay-Malabry Market Intelligence 👇

Explore Real-time Analytics
Airbnb Seasonality Analysis & Trends in Châtenay-Malabry (2025)
Peak Season (June, May, April)
- Revenue averages $2,185 per month
- Occupancy rates average 37.8%
- Daily rates average $117
Shoulder Season
- Revenue averages $1,564 per month
- Occupancy maintains around 43.3%
- Daily rates hold near $119
Low Season (January, March, November)
- Revenue drops to average $1,210 per month
- Occupancy decreases to average 40.2%
- Daily rates adjust to average $118
Seasonality Insights for Châtenay-Malabry
- The Airbnb seasonality in Châtenay-Malabry shows moderate seasonality with distinct peak and low periods. While the sections above show seasonal averages, it's also insightful to look at the extremes:
- During the high season, the absolute peak month showcases Châtenay-Malabry's highest earning potential, with monthly revenues capable of climbing to $2,263, occupancy reaching a high of 52.1%, and ADRs peaking at $126.
- Conversely, the slowest single month of the year, typically falling within the low season, marks the market's lowest point. In this month, revenue might dip to $1,196, occupancy could drop to 32.9%, and ADRs may adjust down to $111.
- Understanding both the seasonal averages and these monthly peaks and troughs in revenue, occupancy, and ADR is crucial for maximizing your Airbnb profit potential in Châtenay-Malabry.
Seasonal Strategies for Maximizing Profit
- Peak Season: Maximize revenue through premium pricing and potentially longer minimum stays. Ensure high availability.
- Low Season: Offer competitive pricing, special promotions (e.g., extended stay discounts), and flexible cancellation policies. Target off-season travelers like remote workers or budget-conscious guests.
- Shoulder Seasons: Implement dynamic pricing that balances peak and low rates. Target weekend travelers or specific events. Offer slightly more flexible terms than peak season.
- Regularly analyze your own performance against these Châtenay-Malabry seasonality benchmarks and adjust your pricing and availability strategy accordingly.
Best Areas for Airbnb Investment in Châtenay-Malabry (2025)
Exploring the top neighborhoods for short-term rentals in Châtenay-Malabry? This section highlights key areas, outlining why they are attractive for hosts and guests, along with notable local attractions. Consider these locations based on your target guest profile and investment strategy.
| Neighborhood / Area | Why Host Here? (Target Guests & Appeal) | Key Attractions & Landmarks |
|---|---|---|
| Parc de la Vallée aux Loups | A serene park known for its beautiful landscapes and the Châtenay-Malabry museum. Perfect for families and nature enthusiasts looking for a peaceful retreat close to the city. | Château de la Vallée aux Loups, Musée Caillebotte, Parc de Sceaux, Bois de la chasse, Walking trails |
| Centre Ville | The town center is vibrant with cafes, shops, and local markets. It attracts tourists looking for a local experience with easy access to amenities and public transport. | Local shops and boutiques, Cafés and bistros, Châtenay-Malabry Market, Cultural events, Public transport access |
| La Malmaison | A historical area with beautiful architecture and rich history, appealing to visitors interested in culture and history. Close to parks and cultural sites. | Parc de la Malmaison, Historical buildings, Cultural heritage sites, Museums, Art galleries |
| Les Coteaux | Residential area with scenic views and a quiet neighborhood feel, suitable for visitors seeking tranquility while being close to urban amenities. | Scenic viewpoints, Walking paths, Local parks, Family-friendly environment, Easy access to public transport |
| Aqueduc de la Dhuis | This area offers unique historical sites along the old aqueduct, attracting history buffs and those interested in exploration and nature walks. | Historical aqueduct, Nature walks, Parks along the aqueduct route, Picnic areas, Historical landmarks |
| Bois de Verrières | A large forested area ideal for outdoor activities, family picnics, and nature exploration, making it attractive for nature lovers and families. | Hiking trails, Nature exploration, Picnic spots, Wildlife watching, Outdoor sports |
| Rue de la République | A lively street filled with shops, restaurants, and entertainment options. Great for visitors wanting to experience local dining and culture. | Restaurants and cafes, Shops, Local events, Entertainment venues, Cultural experiences |
| Parc de Sceaux | A larger park that includes beautiful gardens and a magnificent château, great for tourists and locals alike. Perfect for leisurely strolls and events. | Château de Sceaux, Gardens, Picnic areas, Cultural events, Art exhibitions |
Understanding Airbnb License Requirements & STR Laws in Châtenay-Malabry (2025)
While Châtenay-Malabry, Ile-de-France, France currently shows low STR regulations, specific Airbnb license requirements might still exist or change. Always verify the latest short term rental regulations and Airbnb license requirements directly with local government authorities for Châtenay-Malabry to ensure full compliance before hosting.
(Source: AirROI data, 2025, based on 7% licensed listings)
Top Performing Airbnb Properties in Châtenay-Malabry (2025)
Benchmark your potential! Explore examples of top-performing Airbnb properties in Châtenay-Malabrybased on Trailing Twelve Month (TTM) revenue. Analyze their characteristics, revenue, occupancy rate, and ADR to understand what drives success in this market.
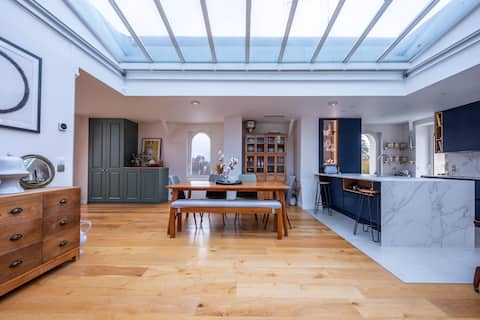
Duplex lumineux proche Sceaux
Entire Place • 3 bedrooms
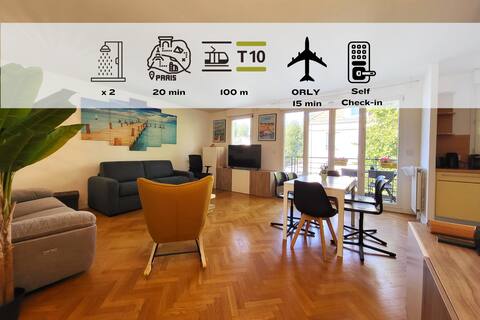
Le Cassis: Peaceful Apartment 100 m from the T10
Entire Place • 2 bedrooms
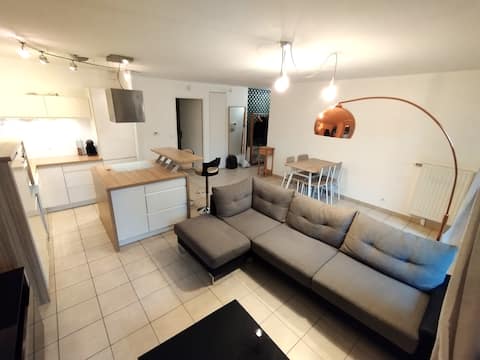
Apartment: Chatenay Malabry
Entire Place • 2 bedrooms
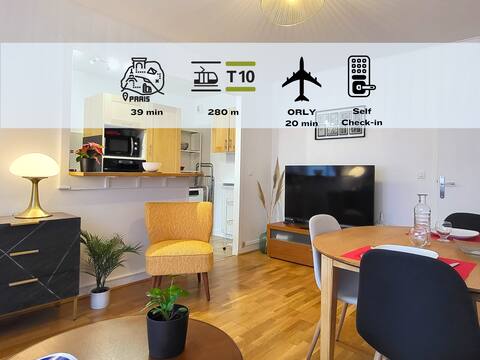
L'Olivier: Warm F2, near T10 (280m)
Entire Place • 1 bedroom
Havre de paix 15 min from Paris with RER B
Entire Place • 1 bedroom
Cozy T2 near Paris - RER 2 min away
Entire Place • 1 bedroom
Note: Performance varies based on location, size, amenities, seasonality, and management quality. Data reflects the past 12 months.
Top Performing Airbnb Hosts in Châtenay-Malabry (2025)
Learn from the best! This table showcases top-performing Airbnb hosts in Châtenay-Malabry based on the number of properties managed and estimated total revenue over the past year. Analyze their scale and performance metrics.
| Host Name | Properties | Grossing Revenue | Stay Reviews | Avg Rating |
|---|---|---|---|---|
| Gloria Et Rémy | 2 | $77,614 | 30 | 4.79/5.0 |
| Host #37734683 | 1 | $66,159 | 1 | 0.00/5.0 |
| Matthieu | 1 | $34,022 | 18 | 4.67/5.0 |
| Nathalie | 1 | $30,712 | 17 | 5.00/5.0 |
| Tanedice | 1 | $30,576 | 62 | 4.92/5.0 |
| Martine | 1 | $30,252 | 43 | 4.98/5.0 |
| Benjamin | 1 | $28,587 | 13 | 4.69/5.0 |
| Yvan | 1 | $25,566 | 48 | 4.58/5.0 |
| Martine | 1 | $24,295 | 9 | 5.00/5.0 |
| Marouen | 1 | $23,620 | 30 | 5.00/5.0 |
Analyzing the strategies of top hosts, such as their property selection, pricing, and guest communication, can offer valuable lessons for optimizing your own Airbnb operations in Châtenay-Malabry.
Dive Deeper: Advanced Châtenay-Malabry STR Market Data (2025)
Ready to unlock more insights? AirROI provides access to advanced metrics and comprehensive Airbnb data for Châtenay-Malabry. Explore detailed analytics beyond this report to refine your investment strategy, optimize pricing, and maximize your vacation rental profits.
Explore Advanced MetricsChâtenay-Malabry Short-Term Rental Market Composition (2025): Property & Room Types
Room Type Distribution
Property Type Distribution
Market Composition Insights for Châtenay-Malabry
- The Châtenay-Malabry Airbnb market composition is heavily skewed towards Entire Home/Apt listings, which make up 71.8% of the 85 active rentals. This indicates strong guest preference for privacy and space.
- Looking at the property type distribution in Châtenay-Malabry, Apartment/Condo properties are the most common (82.4%), reflecting the local real estate landscape.
- The presence of 9.4% Hotel/Boutique listings indicates integration with traditional hospitality.
Châtenay-Malabry Airbnb Room Capacity Analysis (2025): Bedroom Distribution
Distribution of Listings by Number of Bedrooms
Room Capacity Insights for Châtenay-Malabry
- The dominant room capacity in Châtenay-Malabry is 1 bedroom listings, making up 50.6% of the market. This suggests a strong demand for properties suitable for couples or solo travelers.
- Together, 1 bedroom and 2 bedrooms properties represent 75.3% of the active Airbnb listings in Châtenay-Malabry, indicating a high concentration in these sizes.
- With over half the market (50.6%) consisting of studios or 1-bedroom units, Châtenay-Malabry is particularly well-suited for individuals or couples.
- Listings with 3+ bedrooms (7.1%) represent a smaller niche, potentially indicating an underserved market for larger group accommodations in Châtenay-Malabry.
Châtenay-Malabry Vacation Rental Guest Capacity Trends (2025)
Distribution of Listings by Guest Capacity
Guest Capacity Insights for Châtenay-Malabry
- The most common guest capacity trend in Châtenay-Malabry vacation rentals is listings accommodating 2 guests (30.6%). This suggests the primary traveler segment is likely couples or solo travelers.
- Properties designed for 2 guests and 4 guests dominate the Châtenay-Malabry STR market, accounting for 54.1% of listings.
- 17.7% of properties accommodate 6+ guests, serving the market segment for larger families or group travel in Châtenay-Malabry.
- On average, properties in Châtenay-Malabry are equipped to host 3.1 guests.
Châtenay-Malabry Airbnb Booking Patterns (2025): Available vs. Booked Days
Available Days Distribution
Booked Days Distribution
Booking Pattern Insights for Châtenay-Malabry
- The most common availability pattern in Châtenay-Malabry falls within the 271-366 days range, representing 61.2% of listings. This suggests many properties have significant open periods on their calendars.
- Approximately 80.0% of listings show high availability (181+ days open annually), indicating potential for increased bookings or specific owner usage patterns.
- For booked days, the 1-30 days range is most frequent in Châtenay-Malabry (34.1%), reflecting common guest stay durations or potential owner blocking patterns.
- A notable 20.0% of properties secure long booking periods (181+ days booked per year), highlighting successful long-term rental strategies or significant owner usage.
Châtenay-Malabry Airbnb Minimum Stay Requirements Analysis
Distribution of Listings by Minimum Night Requirement
1 Night
20 listings
26.7% of total
2 Nights
23 listings
30.7% of total
3 Nights
13 listings
17.3% of total
4-6 Nights
10 listings
13.3% of total
7-29 Nights
5 listings
6.7% of total
30+ Nights
4 listings
5.3% of total
Key Insights
- The most prevalent minimum stay requirement in Châtenay-Malabry is 2 Nights, adopted by 30.7% of listings. This highlights the market's preference for shorter, flexible bookings.
Recommendations
- Align with the market by considering a 2 Nights minimum stay, as 30.7% of Châtenay-Malabry hosts use this setting.
- If feasible, allowing 1-night stays, especially midweek or during low season, could capture last-minute bookings, as only 26.7% currently do.
- Explore offering discounts for stays of 30+ nights to attract the 5.3% of the market seeking extended stays.
- Adjust minimum nights based on seasonality – potentially shorter during low season and longer during peak demand periods in Châtenay-Malabry.
Châtenay-Malabry Airbnb Cancellation Policy Trends Analysis (2025)
Flexible
18 listings
36.7% of total
Moderate
14 listings
28.6% of total
Firm
8 listings
16.3% of total
Strict
9 listings
18.4% of total
Cancellation Policy Insights for Châtenay-Malabry
- The prevailing Airbnb cancellation policy trend in Châtenay-Malabry is Flexible, used by 36.7% of listings.
- There's a relatively balanced mix between guest-friendly (65.3%) and stricter (34.7%) policies, offering choices for different guest needs.
Recommendations for Hosts
- Consider adopting a Flexible policy to align with the 36.7% market standard in Châtenay-Malabry.
- Regularly review your cancellation policy against competitors and market demand shifts in Châtenay-Malabry.
Châtenay-Malabry STR Booking Lead Time Analysis (2025)
Average Booking Lead Time by Month
Booking Lead Time Insights for Châtenay-Malabry
- The overall average booking lead time for vacation rentals in Châtenay-Malabry is 44 days.
- Guests book furthest in advance for stays during July (average 144 days), likely coinciding with peak travel demand or local events.
- The shortest booking windows occur for stays in October (average 28 days), indicating more last-minute travel plans during this time.
- Seasonally, Summer (101 days avg.) sees the longest lead times, while Winter (33 days avg.) has the shortest, reflecting typical travel planning cycles.
Recommendations for Hosts
- Use the overall average lead time (44 days) as a baseline for your pricing and availability strategy in Châtenay-Malabry.
- For July stays, consider implementing length-of-stay discounts or slightly higher rates for bookings made less than 144 days out to capitalize on advance planning.
- Target marketing efforts for the Summer season well in advance (at least 101 days) to capture early planners.
- Monitor your own booking lead times against these Châtenay-Malabry averages to identify opportunities for dynamic pricing adjustments.
Popular & Essential Airbnb Amenities in Châtenay-Malabry (2025)
Amenity Prevalence
Amenity Insights for Châtenay-Malabry
- Essential amenities in Châtenay-Malabry that guests expect include: Heating, Wifi, Smoke alarm, Kitchen, Washer. Lacking these (any) could significantly impact bookings.
- Popular amenities like Essentials, TV, Hot water are common but not universal. Offering these can provide a competitive edge.
Recommendations for Hosts
- Ensure your listing includes all essential amenities for Châtenay-Malabry: Heating, Wifi, Smoke alarm, Kitchen, Washer.
- Prioritize adding missing essentials: Heating, Wifi, Smoke alarm, Kitchen, Washer.
- Consider adding popular differentiators like Essentials or TV to increase appeal.
- Highlight unique or less common amenities you offer (e.g., hot tub, dedicated workspace, EV charger) in your listing description and photos.
- Regularly check competitor amenities in Châtenay-Malabry to stay competitive.
Châtenay-Malabry Airbnb Guest Demographics & Profile Analysis (2025)
Guest Profile Summary for Châtenay-Malabry
- The typical guest profile for Airbnb in Châtenay-Malabry consists of primarily domestic travelers (67%), often arriving from nearby Paris, typically belonging to the Post-2000s (Gen Z/Alpha) group (50%), primarily speaking English or French.
- Domestic travelers account for 66.7% of guests.
- Key international markets include France (66.7%) and Germany (5.2%).
- Top languages spoken are English (34.4%) followed by French (31.5%).
- A significant demographic segment is the Post-2000s (Gen Z/Alpha) group, representing 50% of guests.
Recommendations for Hosts
- Target domestic marketing efforts towards travelers from Paris and Châtenay-Malabry.
- Tailor amenities and listing descriptions to appeal to the dominant Post-2000s (Gen Z/Alpha) demographic (e.g., highlight fast WiFi, smart home features, local guides).
- Highlight unique local experiences or amenities relevant to the primary guest profile.
- Consider seasonal promotions aligned with peak travel times for key origin markets.
Nearby Short-Term Rental Market Comparison
How does the Châtenay-Malabry Airbnb market stack up against its neighbors? Compare key performance metrics like average monthly revenue, ADR, and occupancy rates in surrounding areas to understand the broader regional STR landscape.
| Market | Active Properties | Monthly Revenue | Daily Rate | Avg. Occupancy |
|---|---|---|---|---|
| Morienval | 10 | $5,794 | $400.84 | 32% |
| Verdelot | 13 | $3,885 | $300.79 | 46% |
| Trigny | 10 | $3,775 | $248.19 | 46% |
| La Couture-Boussey | 12 | $3,620 | $378.08 | 28% |
| Dourdan | 15 | $3,576 | $223.06 | 52% |
| Rosoy-en-Multien | 15 | $3,558 | $367.61 | 51% |
| Millançay | 11 | $3,476 | $370.42 | 39% |
| Chaintreaux | 11 | $3,136 | $278.28 | 34% |
| Langon-sur-Cher | 12 | $3,127 | $400.27 | 35% |
| Mesnils-sur-Iton | 22 | $3,028 | $309.05 | 40% |