Chalifert Airbnb Market Analysis 2025: Short Term Rental Data & Vacation Rental Statistics in Ile-de-France, France
Is Airbnb profitable in Chalifert in 2025? Explore comprehensive Airbnb analytics for Chalifert, Ile-de-France, France to uncover income potential. This 2025 STR market report for Chalifert, based on AirROI data from April 2024 to March 2025, reveals key trends in the niche market of 35 active listings.
Whether you're considering an Airbnb investment in Chalifert, optimizing your existing vacation rental, or exploring rental arbitrage opportunities, understanding the Chalifert Airbnb data is crucial. Leveraging the low regulation environment is key to maximizing your short term rental income potential. Let's dive into the specifics.
Key Chalifert Airbnb Performance Metrics Overview
Monthly Airbnb Revenue Variations & Income Potential in Chalifert (2025)
Understanding the monthly revenue variations for Airbnb listings in Chalifert is key to maximizing your short term rental income potential. Seasonality significantly impacts earnings. Our analysis, based on data from the past 12 months, shows that the peak revenue month for STRs in Chalifert is typically June, while March often presents the lowest earnings, highlighting opportunities for strategic pricing adjustments during shoulder and low seasons. Explore the typical Airbnb income in Chalifert across different performance tiers:
- Best-in-class properties (Top 10%) achieve $5,729+ monthly, often utilizing dynamic pricing and superior guest experiences.
- Strong performing properties (Top 25%) earn $3,232 or more, indicating effective management and desirable locations/amenities.
- Typical properties (Median) generate around $1,977 per month, representing the average market performance.
- Entry-level properties (Bottom 25%) see earnings around $1,156, often with potential for optimization.
Average Monthly Airbnb Earnings Trend in Chalifert
Chalifert Airbnb Occupancy Rate Trends (2025)
Maximize your bookings by understanding the Chalifert STR occupancy trends. Seasonal demand shifts significantly influence how often properties are booked. Typically, Octobersees the highest demand (peak season occupancy), while March experiences the lowest (low season). Effective strategies, like adjusting minimum stays or offering promotions, can boost occupancy during slower periods. Here's how different property tiers perform in Chalifert:
- Best-in-class properties (Top 10%) achieve 84%+ occupancy, indicating high desirability and potentially optimized availability.
- Strong performing properties (Top 25%) maintain 66% or higher occupancy, suggesting good market fit and guest satisfaction.
- Typical properties (Median) have an occupancy rate around 42%.
- Entry-level properties (Bottom 25%) average 26% occupancy, potentially facing higher vacancy.
Average Monthly Occupancy Rate Trend in Chalifert
Average Daily Rate (ADR) Airbnb Trends in Chalifert (2025)
Effective short term rental pricing strategy in Chalifert involves understanding monthly ADR fluctuations. The Average Daily Rate (ADR) for Airbnb in Chalifert typically peaks in August and dips lowest during February. Leveraging Airbnb dynamic pricing tools or strategies based on this seasonality can significantly boost revenue. Here's a look at the typical nightly rates achieved:
- Best-in-class properties (Top 10%) command rates of $409+ per night, often due to premium features or locations.
- Strong performing properties (Top 25%) achieve nightly rates of $221 or more.
- Typical properties (Median) charge around $125 per night.
- Entry-level properties (Bottom 25%) earn around $80 per night.
Average Daily Rate (ADR) Trend by Month in Chalifert
Get Live Chalifert Market Intelligence 👇

Explore Real-time Analytics
Airbnb Seasonality Analysis & Trends in Chalifert (2025)
Peak Season (June, August, May)
- Revenue averages $3,462 per month
- Occupancy rates average 49.0%
- Daily rates average $209
Shoulder Season
- Revenue averages $2,654 per month
- Occupancy maintains around 47.5%
- Daily rates hold near $186
Low Season (January, March, November)
- Revenue drops to average $1,577 per month
- Occupancy decreases to average 40.8%
- Daily rates adjust to average $156
Seasonality Insights for Chalifert
- The Airbnb seasonality in Chalifert shows highly seasonal trends requiring careful strategy. While the sections above show seasonal averages, it's also insightful to look at the extremes:
- During the high season, the absolute peak month showcases Chalifert's highest earning potential, with monthly revenues capable of climbing to $3,612, occupancy reaching a high of 53.8%, and ADRs peaking at $232.
- Conversely, the slowest single month of the year, typically falling within the low season, marks the market's lowest point. In this month, revenue might dip to $1,482, occupancy could drop to 39.2%, and ADRs may adjust down to $151.
- Understanding both the seasonal averages and these monthly peaks and troughs in revenue, occupancy, and ADR is crucial for maximizing your Airbnb profit potential in Chalifert.
Seasonal Strategies for Maximizing Profit
- Peak Season: Maximize revenue through premium pricing and potentially longer minimum stays. Ensure high availability.
- Low Season: Offer competitive pricing, special promotions (e.g., extended stay discounts), and flexible cancellation policies. Target off-season travelers like remote workers or budget-conscious guests.
- Shoulder Seasons: Implement dynamic pricing that balances peak and low rates. Target weekend travelers or specific events. Offer slightly more flexible terms than peak season.
- Regularly analyze your own performance against these Chalifert seasonality benchmarks and adjust your pricing and availability strategy accordingly.
Best Areas for Airbnb Investment in Chalifert (2025)
Exploring the top neighborhoods for short-term rentals in Chalifert? This section highlights key areas, outlining why they are attractive for hosts and guests, along with notable local attractions. Consider these locations based on your target guest profile and investment strategy.
| Neighborhood / Area | Why Host Here? (Target Guests & Appeal) | Key Attractions & Landmarks |
|---|---|---|
| Château de Ferrières | A historic château that attracts visitors interested in French history and architecture. Ideal for hosting guests looking for a unique and luxurious experience near Chalifert. | Château de Ferrières, Parc de Ferrières, Seine-et-Marne countryside |
| Disneyland Paris | One of the most visited tourist destinations in the world, Disneyland Paris is located very close to Chalifert. A prime spot for hosting families visiting the theme park. | Disneyland Park, Walt Disney Studios Park, Disney Village |
| Val d'Europe | A large shopping and entertainment area that includes a shopping mall and aquarium, attracting both tourists and locals. Offers a vibrant atmosphere. | Val d'Europe Shopping Center, Sea Life Paris, La Vallée Village Shopping Outlet |
| Lagny-sur-Marne | A charming town nearby with its own attractions and proximity to nature, making it attractive for guests who want a more relaxed stay close to the city. | Historic town center, Museums of Lagny, Parc de la Haute-Île |
| Bussy-Saint-Georges | A vibrant suburban area known for its parks and proximity to Disneyland. Popular among families and visitors looking for convenient accommodations. | Les Terrasses de Bussy, Bussy-Saint-Georges Park |
| Cesson | A quiet town that acts as a nice retreat for travelers looking for peace and the possibility of easy access to the vibrancy of Paris and Disneyland. | Cesson Park, Local markets, Historical buildings |
| Meaux | A historical city known for its cathedral and Brie cheese, Meaux attracts visitors who want to experience French culture away from the bustling tourist spots. | Meaux Cathedral, Museum of the Great War, Parc Naturel de la Haute Vallée de la Marne |
| Saint-Thibault-des-Vignes | A suburban area that provides a peaceful environment while being close to urban amenities and attractions, appealing to families and short-term visitors. | Local parks, Nearby shopping districts, Convenient public transport to Paris |
Understanding Airbnb License Requirements & STR Laws in Chalifert (2025)
While Chalifert, Ile-de-France, France currently shows low STR regulations, specific Airbnb license requirements might still exist or change. Always verify the latest short term rental regulations and Airbnb license requirements directly with local government authorities for Chalifert to ensure full compliance before hosting.
(Source: AirROI data, 2025, based on 9% licensed listings)
Top Performing Airbnb Properties in Chalifert (2025)
Benchmark your potential! Explore examples of top-performing Airbnb properties in Chalifertbased on Trailing Twelve Month (TTM) revenue. Analyze their characteristics, revenue, occupancy rate, and ADR to understand what drives success in this market.
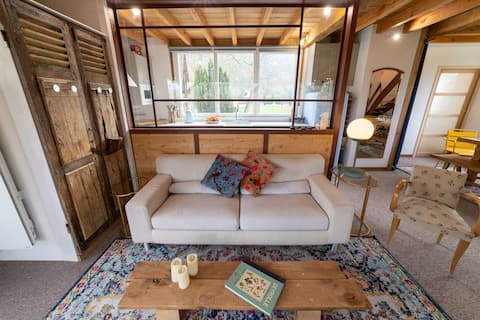
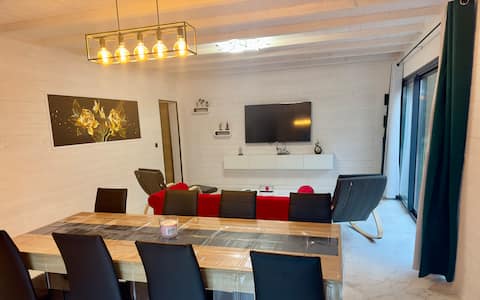
The River 10min from Disneyland Paris
Entire Place • 2 bedrooms
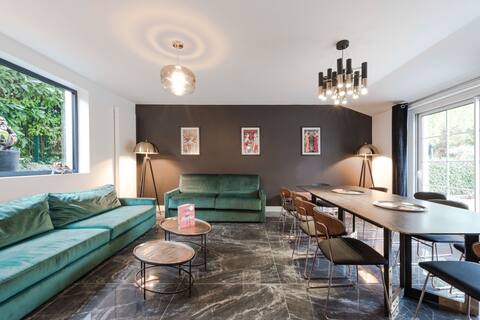
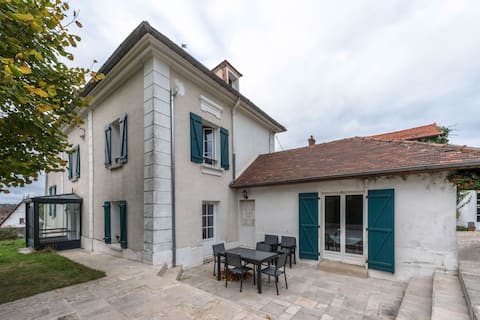
Luxury brand new art déco Disneyland
Entire Place • 5 bedrooms
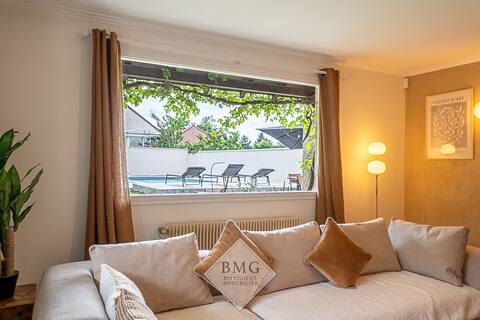
Villa Solaris Disneyland
Entire Place • 5 bedrooms
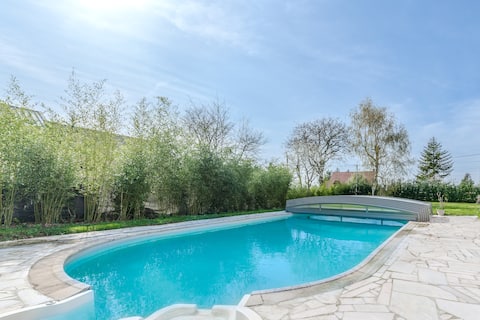
Large house with pool 10 minutes from Disneyland
Entire Place • 5 bedrooms
Maison vacances Disneyland JO2024
Entire Place • 5 bedrooms
64 Cottage near Disneyland Bmyguest
Entire Place • 5 bedrooms
Note: Performance varies based on location, size, amenities, seasonality, and management quality. Data reflects the past 12 months.
Top Performing Airbnb Hosts in Chalifert (2025)
Learn from the best! This table showcases top-performing Airbnb hosts in Chalifert based on the number of properties managed and estimated total revenue over the past year. Analyze their scale and performance metrics.
| Host Name | Properties | Grossing Revenue | Stay Reviews | Avg Rating |
|---|---|---|---|---|
| Josiane | 6 | $164,800 | 424 | 4.93/5.0 |
| Cécile Et Vanina | 2 | $129,730 | 32 | 4.74/5.0 |
| Bmyguest | 2 | $86,326 | 9 | 4.58/5.0 |
| Romain | 1 | $54,758 | 5 | 5.00/5.0 |
| Host #98583340 | 1 | $49,204 | 1 | 0.00/5.0 |
| Maxime | 2 | $47,765 | 113 | 4.83/5.0 |
| Marie Et Michel | 2 | $38,479 | 45 | 4.98/5.0 |
| Fabrice Et Sylvia | 1 | $28,366 | 69 | 4.90/5.0 |
| Izzie | 1 | $26,178 | 142 | 4.60/5.0 |
| Mégane | 1 | $25,771 | 42 | 4.88/5.0 |
Analyzing the strategies of top hosts, such as their property selection, pricing, and guest communication, can offer valuable lessons for optimizing your own Airbnb operations in Chalifert.
Dive Deeper: Advanced Chalifert STR Market Data (2025)
Ready to unlock more insights? AirROI provides access to advanced metrics and comprehensive Airbnb data for Chalifert. Explore detailed analytics beyond this report to refine your investment strategy, optimize pricing, and maximize your vacation rental profits.
Explore Advanced MetricsChalifert Short-Term Rental Market Composition (2025): Property & Room Types
Room Type Distribution
Property Type Distribution
Market Composition Insights for Chalifert
- The Chalifert Airbnb market composition is heavily skewed towards Entire Home/Apt listings, which make up 88.6% of the 35 active rentals. This indicates strong guest preference for privacy and space.
- Looking at the property type distribution in Chalifert, House properties are the most common (65.7%), reflecting the local real estate landscape.
- Houses represent a significant 65.7% portion, catering likely to families or larger groups.
Chalifert Airbnb Room Capacity Analysis (2025): Bedroom Distribution
Distribution of Listings by Number of Bedrooms
Room Capacity Insights for Chalifert
- The dominant room capacity in Chalifert is 2 bedrooms listings, making up 28.6% of the market. This suggests a strong demand for properties suitable for couples or solo travelers.
- Together, 2 bedrooms and 1 bedroom properties represent 54.3% of the active Airbnb listings in Chalifert, indicating a high concentration in these sizes.
Chalifert Vacation Rental Guest Capacity Trends (2025)
Distribution of Listings by Guest Capacity
Guest Capacity Insights for Chalifert
- The most common guest capacity trend in Chalifert vacation rentals is listings accommodating 4 guests (37.1%). This suggests the primary traveler segment is likely small families or groups.
- Properties designed for 4 guests and 8+ guests dominate the Chalifert STR market, accounting for 54.2% of listings.
- 28.5% of properties accommodate 6+ guests, serving the market segment for larger families or group travel in Chalifert.
- On average, properties in Chalifert are equipped to host 4.4 guests.
Chalifert Airbnb Booking Patterns (2025): Available vs. Booked Days
Available Days Distribution
Booked Days Distribution
Booking Pattern Insights for Chalifert
- The most common availability pattern in Chalifert falls within the 181-270 days range, representing 48.6% of listings. This suggests many properties have significant open periods on their calendars.
- Approximately 74.3% of listings show high availability (181+ days open annually), indicating potential for increased bookings or specific owner usage patterns.
- For booked days, the 91-180 days range is most frequent in Chalifert (42.9%), reflecting common guest stay durations or potential owner blocking patterns.
- A notable 31.5% of properties secure long booking periods (181+ days booked per year), highlighting successful long-term rental strategies or significant owner usage.
Chalifert Airbnb Minimum Stay Requirements Analysis
Distribution of Listings by Minimum Night Requirement
1 Night
14 listings
40% of total
2 Nights
13 listings
37.1% of total
3 Nights
4 listings
11.4% of total
4-6 Nights
1 listings
2.9% of total
30+ Nights
3 listings
8.6% of total
Key Insights
- The most prevalent minimum stay requirement in Chalifert is 1 Night, adopted by 40% of listings. This highlights the market's preference for shorter, flexible bookings.
- A strong majority (77.1%) of the Chalifert Airbnb data shows acceptance of very short stays (1-2 nights), indicating a dynamic, high-turnover market.
Recommendations
- Align with the market by considering a 1 Night minimum stay, as 40% of Chalifert hosts use this setting.
- Explore offering discounts for stays of 30+ nights to attract the 8.6% of the market seeking extended stays.
- Adjust minimum nights based on seasonality – potentially shorter during low season and longer during peak demand periods in Chalifert.
Chalifert Airbnb Cancellation Policy Trends Analysis (2025)
Flexible
11 listings
33.3% of total
Moderate
16 listings
48.5% of total
Firm
2 listings
6.1% of total
Strict
4 listings
12.1% of total
Cancellation Policy Insights for Chalifert
- The prevailing Airbnb cancellation policy trend in Chalifert is Moderate, used by 48.5% of listings.
- The market strongly favors guest-friendly terms, with 81.8% of listings offering Flexible or Moderate policies. This suggests guests in Chalifert may expect booking flexibility.
Recommendations for Hosts
- Consider adopting a Moderate policy to align with the 48.5% market standard in Chalifert.
- Using a Strict policy might deter some guests, as only 12.1% of listings use it. Evaluate if potential revenue protection outweighs possible lower booking rates.
- Regularly review your cancellation policy against competitors and market demand shifts in Chalifert.
Chalifert STR Booking Lead Time Analysis (2025)
Average Booking Lead Time by Month
Booking Lead Time Insights for Chalifert
- The overall average booking lead time for vacation rentals in Chalifert is 55 days.
- Guests book furthest in advance for stays during July (average 139 days), likely coinciding with peak travel demand or local events.
- The shortest booking windows occur for stays in November (average 30 days), indicating more last-minute travel plans during this time.
- Seasonally, Summer (117 days avg.) sees the longest lead times, while Winter (34 days avg.) has the shortest, reflecting typical travel planning cycles.
Recommendations for Hosts
- Use the overall average lead time (55 days) as a baseline for your pricing and availability strategy in Chalifert.
- For July stays, consider implementing length-of-stay discounts or slightly higher rates for bookings made less than 139 days out to capitalize on advance planning.
- Target marketing efforts for the Summer season well in advance (at least 117 days) to capture early planners.
- Monitor your own booking lead times against these Chalifert averages to identify opportunities for dynamic pricing adjustments.
Popular & Essential Airbnb Amenities in Chalifert (2025)
Amenity Prevalence
Amenity Insights for Chalifert
- Essential amenities in Chalifert that guests expect include: Wifi, Free parking on premises. Lacking these (any) could significantly impact bookings.
- Popular amenities like TV, Heating, Kitchen are common but not universal. Offering these can provide a competitive edge.
Recommendations for Hosts
- Ensure your listing includes all essential amenities for Chalifert: Wifi, Free parking on premises.
- Prioritize adding missing essentials: Free parking on premises.
- Consider adding popular differentiators like TV or Heating to increase appeal.
- Highlight unique or less common amenities you offer (e.g., hot tub, dedicated workspace, EV charger) in your listing description and photos.
- Regularly check competitor amenities in Chalifert to stay competitive.
Chalifert Airbnb Guest Demographics & Profile Analysis (2025)
Guest Profile Summary for Chalifert
- The typical guest profile for Airbnb in Chalifert consists of a mix of domestic (55%) and international guests, often arriving from nearby England, typically belonging to the Post-2000s (Gen Z/Alpha) group (50%), primarily speaking English or French.
- Domestic travelers account for 54.5% of guests.
- Key international markets include France (54.5%) and United Kingdom (10.5%).
- Top languages spoken are English (33%) followed by French (31.2%).
- A significant demographic segment is the Post-2000s (Gen Z/Alpha) group, representing 50% of guests.
Recommendations for Hosts
- Balance marketing efforts between domestic and international channels based on the guest mix.
- Tailor amenities and listing descriptions to appeal to the dominant Post-2000s (Gen Z/Alpha) demographic (e.g., highlight fast WiFi, smart home features, local guides).
- Highlight unique local experiences or amenities relevant to the primary guest profile.
- Consider seasonal promotions aligned with peak travel times for key origin markets.
Nearby Short-Term Rental Market Comparison
How does the Chalifert Airbnb market stack up against its neighbors? Compare key performance metrics like average monthly revenue, ADR, and occupancy rates in surrounding areas to understand the broader regional STR landscape.
| Market | Active Properties | Monthly Revenue | Daily Rate | Avg. Occupancy |
|---|---|---|---|---|
| Morienval | 10 | $5,794 | $400.84 | 32% |
| Verdelot | 13 | $3,885 | $300.79 | 46% |
| Trigny | 10 | $3,775 | $248.19 | 46% |
| La Couture-Boussey | 12 | $3,620 | $378.08 | 28% |
| Dourdan | 15 | $3,576 | $223.06 | 52% |
| Rosoy-en-Multien | 15 | $3,558 | $367.61 | 51% |
| Millançay | 11 | $3,476 | $370.42 | 39% |
| Chaintreaux | 11 | $3,136 | $278.28 | 34% |
| Langon-sur-Cher | 12 | $3,127 | $400.27 | 35% |
| Mesnils-sur-Iton | 22 | $3,028 | $309.05 | 40% |