Chailly-en-Bière Airbnb Market Analysis 2025: Short Term Rental Data & Vacation Rental Statistics in Ile-de-France, France
Is Airbnb profitable in Chailly-en-Bière in 2025? Explore comprehensive Airbnb analytics for Chailly-en-Bière, Ile-de-France, France to uncover income potential. This 2025 STR market report for Chailly-en-Bière, based on AirROI data from April 2024 to March 2025, reveals key trends in the niche market of 17 active listings.
Whether you're considering an Airbnb investment in Chailly-en-Bière, optimizing your existing vacation rental, or exploring rental arbitrage opportunities, understanding the Chailly-en-Bière Airbnb data is crucial. Understanding the local regulations is key to maximizing your short term rental income potential. Let's dive into the specifics.
Key Chailly-en-Bière Airbnb Performance Metrics Overview
Monthly Airbnb Revenue Variations & Income Potential in Chailly-en-Bière (2025)
Understanding the monthly revenue variations for Airbnb listings in Chailly-en-Bière is key to maximizing your short term rental income potential. Seasonality significantly impacts earnings. Our analysis, based on data from the past 12 months, shows that the peak revenue month for STRs in Chailly-en-Bière is typically June, while February often presents the lowest earnings, highlighting opportunities for strategic pricing adjustments during shoulder and low seasons. Explore the typical Airbnb income in Chailly-en-Bière across different performance tiers:
- Best-in-class properties (Top 10%) achieve $4,408+ monthly, often utilizing dynamic pricing and superior guest experiences.
- Strong performing properties (Top 25%) earn $2,483 or more, indicating effective management and desirable locations/amenities.
- Typical properties (Median) generate around $1,521 per month, representing the average market performance.
- Entry-level properties (Bottom 25%) see earnings around $877, often with potential for optimization.
Average Monthly Airbnb Earnings Trend in Chailly-en-Bière
Chailly-en-Bière Airbnb Occupancy Rate Trends (2025)
Maximize your bookings by understanding the Chailly-en-Bière STR occupancy trends. Seasonal demand shifts significantly influence how often properties are booked. Typically, Maysees the highest demand (peak season occupancy), while January experiences the lowest (low season). Effective strategies, like adjusting minimum stays or offering promotions, can boost occupancy during slower periods. Here's how different property tiers perform in Chailly-en-Bière:
- Best-in-class properties (Top 10%) achieve 78%+ occupancy, indicating high desirability and potentially optimized availability.
- Strong performing properties (Top 25%) maintain 65% or higher occupancy, suggesting good market fit and guest satisfaction.
- Typical properties (Median) have an occupancy rate around 42%.
- Entry-level properties (Bottom 25%) average 23% occupancy, potentially facing higher vacancy.
Average Monthly Occupancy Rate Trend in Chailly-en-Bière
Average Daily Rate (ADR) Airbnb Trends in Chailly-en-Bière (2025)
Effective short term rental pricing strategy in Chailly-en-Bière involves understanding monthly ADR fluctuations. The Average Daily Rate (ADR) for Airbnb in Chailly-en-Bière typically peaks in December and dips lowest during October. Leveraging Airbnb dynamic pricing tools or strategies based on this seasonality can significantly boost revenue. Here's a look at the typical nightly rates achieved:
- Best-in-class properties (Top 10%) command rates of $413+ per night, often due to premium features or locations.
- Strong performing properties (Top 25%) achieve nightly rates of $235 or more.
- Typical properties (Median) charge around $99 per night.
- Entry-level properties (Bottom 25%) earn around $75 per night.
Average Daily Rate (ADR) Trend by Month in Chailly-en-Bière
Get Live Chailly-en-Bière Market Intelligence 👇

Explore Real-time Analytics
Airbnb Seasonality Analysis & Trends in Chailly-en-Bière (2025)
Peak Season (June, August, July)
- Revenue averages $3,328 per month
- Occupancy rates average 49.6%
- Daily rates average $191
Shoulder Season
- Revenue averages $2,091 per month
- Occupancy maintains around 48.3%
- Daily rates hold near $184
Low Season (January, February, March)
- Revenue drops to average $1,156 per month
- Occupancy decreases to average 33.4%
- Daily rates adjust to average $197
Seasonality Insights for Chailly-en-Bière
- The Airbnb seasonality in Chailly-en-Bière shows highly seasonal trends requiring careful strategy. While the sections above show seasonal averages, it's also insightful to look at the extremes:
- During the high season, the absolute peak month showcases Chailly-en-Bière's highest earning potential, with monthly revenues capable of climbing to $3,889, occupancy reaching a high of 57.4%, and ADRs peaking at $203.
- Conversely, the slowest single month of the year, typically falling within the low season, marks the market's lowest point. In this month, revenue might dip to $871, occupancy could drop to 29.7%, and ADRs may adjust down to $172.
- Understanding both the seasonal averages and these monthly peaks and troughs in revenue, occupancy, and ADR is crucial for maximizing your Airbnb profit potential in Chailly-en-Bière.
Seasonal Strategies for Maximizing Profit
- Peak Season: Maximize revenue through premium pricing and potentially longer minimum stays. Ensure high availability.
- Low Season: Offer competitive pricing, special promotions (e.g., extended stay discounts), and flexible cancellation policies. Target off-season travelers like remote workers or budget-conscious guests.
- Shoulder Seasons: Implement dynamic pricing that balances peak and low rates. Target weekend travelers or specific events. Offer slightly more flexible terms than peak season.
- Regularly analyze your own performance against these Chailly-en-Bière seasonality benchmarks and adjust your pricing and availability strategy accordingly.
Best Areas for Airbnb Investment in Chailly-en-Bière (2025)
Exploring the top neighborhoods for short-term rentals in Chailly-en-Bière? This section highlights key areas, outlining why they are attractive for hosts and guests, along with notable local attractions. Consider these locations based on your target guest profile and investment strategy.
| Neighborhood / Area | Why Host Here? (Target Guests & Appeal) | Key Attractions & Landmarks |
|---|---|---|
| Château de Fontainebleau | Historic château surrounded by expansive gardens, attracting visitors interested in French royal history and architecture. Ideal for guests looking for scenic retreats and cultural experiences. | Château de Fontainebleau, Fontainebleau Forest, Hôtel de Ville, Grand Parterre, Barbizon Village |
| Vincennes | Charming suburban town known for its castle and green spaces. Popular with families and tourists seeking a quieter, residential feel while still being close to Paris. | Château de Vincennes, Parc Floral de Paris, Bois de Vincennes, Vincennes Zoo |
| Montargis | Known as the 'Venice of the Gatinais', this picturesque town offers a serene ambiance with beautiful canals, perfect for travelers looking for a quaint, romantic getaway. | Canals of Montargis, Château de Montargis, Parc des Moulins, Église Saint-Pierre |
| Moret-sur-Loing | A historic 12th-century town beside the Loing River, praised for its beauty and artistic heritage. Attracts visitors interested in art and history. | Historic city center, Gustave Courbet Museum, Loing River, Mills and gardens |
| Meaux | A town steeped in history with notable culinary attractions, especially known for Brie cheese. Ideal for guests who are food enthusiasts and history buffs. | Musée de la Grande Guerre, Meaux Cathedral, Brie de Meaux, Place Charles de Gaulle |
| Provins | A UNESCO World Heritage site renowned for its medieval architecture and history, making it a popular destination for those interested in exploring France's past. | Provins Medieval City, The Caesar Tower, Grange aux Dîmes, The Tithe Barn |
| Évry | Modern urban center with evolving cultural scenes. Attractive to business travelers and families looking for accommodations near Paris and its suburbs. | Évry Cathedral, L'Agora, Parc des Coquibus |
| Cesson | A small suburban town with great connectivity to Paris and green spaces, perfect for families and those seeking a tranquil retreat close to the capital. | Parc des Moulins, Lac de la Varenne, Local markets |
Understanding Airbnb License Requirements & STR Laws in Chailly-en-Bière (2025)
With 12% of listings showing registration in 2025, understanding potential Airbnb license requirements is crucial in Chailly-en-Bière. Always verify the latest short term rental regulations and Airbnb license requirements directly with local government authorities for Chailly-en-Bière to ensure full compliance before hosting.
(Source: AirROI data, 2025, based on 12% licensed listings)
Top Performing Airbnb Properties in Chailly-en-Bière (2025)
Benchmark your potential! Explore examples of top-performing Airbnb properties in Chailly-en-Bièrebased on Trailing Twelve Month (TTM) revenue. Analyze their characteristics, revenue, occupancy rate, and ADR to understand what drives success in this market.

Entire House/Forest/Barbizon
Entire Place • 5 bedrooms
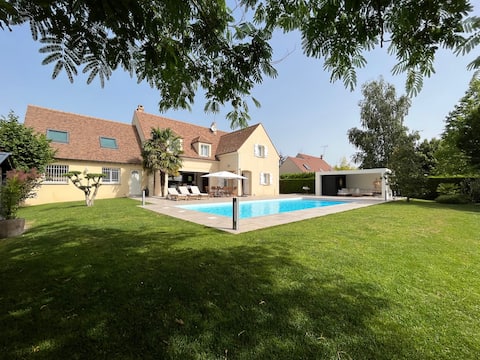
Beautiful Villa with Heated Pool
Entire Place • 4 bedrooms
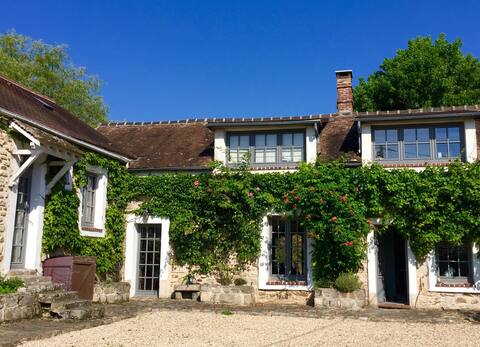
Barbizon, Fontainebleau, Charming country house
Entire Place • 5 bedrooms

Maison en pierre Forêt de Fontainebleau
Entire Place • 3 bedrooms
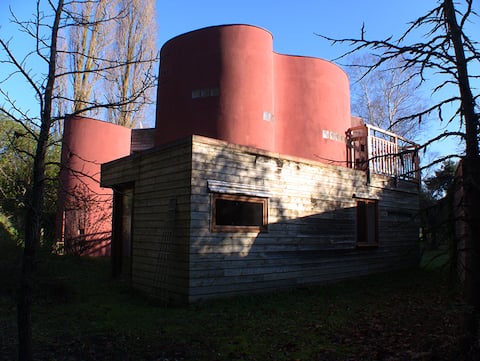
The shelters of the forest
Entire Place • 1 bedroom
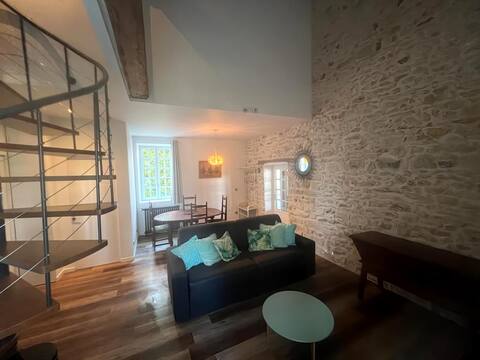
2 chambres*Foret*Barbizon
Entire Place • 2 bedrooms
Note: Performance varies based on location, size, amenities, seasonality, and management quality. Data reflects the past 12 months.
Top Performing Airbnb Hosts in Chailly-en-Bière (2025)
Learn from the best! This table showcases top-performing Airbnb hosts in Chailly-en-Bière based on the number of properties managed and estimated total revenue over the past year. Analyze their scale and performance metrics.
| Host Name | Properties | Grossing Revenue | Stay Reviews | Avg Rating |
|---|---|---|---|---|
| Yannick | 2 | $69,400 | 76 | 4.84/5.0 |
| Deborah & Romain | 1 | $46,923 | 7 | 5.00/5.0 |
| Marie | 1 | $39,510 | 34 | 4.97/5.0 |
| Samuel | 1 | $29,727 | 29 | 4.90/5.0 |
| Olivier Et Valerie | 1 | $24,378 | 100 | 4.95/5.0 |
| François Et Brigitte | 1 | $19,636 | 53 | 4.77/5.0 |
| Host #467919125 | 1 | $18,509 | 67 | 4.88/5.0 |
| Host #198896862 | 1 | $17,264 | 0 | 0.00/5.0 |
| Yannick | 1 | $17,007 | 103 | 4.91/5.0 |
| Damien | 1 | $12,509 | 21 | 4.90/5.0 |
Analyzing the strategies of top hosts, such as their property selection, pricing, and guest communication, can offer valuable lessons for optimizing your own Airbnb operations in Chailly-en-Bière.
Dive Deeper: Advanced Chailly-en-Bière STR Market Data (2025)
Ready to unlock more insights? AirROI provides access to advanced metrics and comprehensive Airbnb data for Chailly-en-Bière. Explore detailed analytics beyond this report to refine your investment strategy, optimize pricing, and maximize your vacation rental profits.
Explore Advanced MetricsChailly-en-Bière Short-Term Rental Market Composition (2025): Property & Room Types
Room Type Distribution
Property Type Distribution
Market Composition Insights for Chailly-en-Bière
- The Chailly-en-Bière Airbnb market composition is heavily skewed towards Entire Home/Apt listings, which make up 94.1% of the 17 active rentals. This indicates strong guest preference for privacy and space.
- Looking at the property type distribution in Chailly-en-Bière, House properties are the most common (58.8%), reflecting the local real estate landscape.
- Houses represent a significant 58.8% portion, catering likely to families or larger groups.
- The presence of 11.8% Hotel/Boutique listings indicates integration with traditional hospitality.
Chailly-en-Bière Airbnb Room Capacity Analysis (2025): Bedroom Distribution
Distribution of Listings by Number of Bedrooms
Room Capacity Insights for Chailly-en-Bière
- The dominant room capacity in Chailly-en-Bière is 1 bedroom listings, making up 29.4% of the market. This suggests a strong demand for properties suitable for couples or solo travelers.
- Together, 1 bedroom and 2 bedrooms properties represent 52.9% of the active Airbnb listings in Chailly-en-Bière, indicating a high concentration in these sizes.
- A significant 35.3% of listings offer 3+ bedrooms, catering to larger groups and families seeking more space in Chailly-en-Bière.
Chailly-en-Bière Vacation Rental Guest Capacity Trends (2025)
Distribution of Listings by Guest Capacity
Guest Capacity Insights for Chailly-en-Bière
- The most common guest capacity trend in Chailly-en-Bière vacation rentals is listings accommodating 8+ guests (29.4%). This suggests the primary traveler segment is likely larger groups.
- Properties designed for 8+ guests and 6 guests dominate the Chailly-en-Bière STR market, accounting for 52.9% of listings.
- 58.8% of properties accommodate 6+ guests, serving the market segment for larger families or group travel in Chailly-en-Bière.
- On average, properties in Chailly-en-Bière are equipped to host 5.4 guests.
Chailly-en-Bière Airbnb Booking Patterns (2025): Available vs. Booked Days
Available Days Distribution
Booked Days Distribution
Booking Pattern Insights for Chailly-en-Bière
- The most common availability pattern in Chailly-en-Bière falls within the 181-270 days range, representing 47.1% of listings. This suggests many properties have significant open periods on their calendars.
- Approximately 76.5% of listings show high availability (181+ days open annually), indicating potential for increased bookings or specific owner usage patterns.
- For booked days, the 91-180 days range is most frequent in Chailly-en-Bière (47.1%), reflecting common guest stay durations or potential owner blocking patterns.
- A notable 23.6% of properties secure long booking periods (181+ days booked per year), highlighting successful long-term rental strategies or significant owner usage.
Chailly-en-Bière Airbnb Minimum Stay Requirements Analysis
Distribution of Listings by Minimum Night Requirement
1 Night
3 listings
18.8% of total
2 Nights
9 listings
56.3% of total
3 Nights
1 listings
6.3% of total
4-6 Nights
1 listings
6.3% of total
7-29 Nights
2 listings
12.5% of total
Key Insights
- The most prevalent minimum stay requirement in Chailly-en-Bière is 2 Nights, adopted by 56.3% of listings. This highlights the market's preference for shorter, flexible bookings.
- A strong majority (75.1%) of the Chailly-en-Bière Airbnb data shows acceptance of very short stays (1-2 nights), indicating a dynamic, high-turnover market.
Recommendations
- Align with the market by considering a 2 Nights minimum stay, as 56.3% of Chailly-en-Bière hosts use this setting.
- If feasible, allowing 1-night stays, especially midweek or during low season, could capture last-minute bookings, as only 18.8% currently do.
- A 2-night minimum appears standard (56.3%). Consider this for weekends or peak periods.
- Adjust minimum nights based on seasonality – potentially shorter during low season and longer during peak demand periods in Chailly-en-Bière.
Chailly-en-Bière Airbnb Cancellation Policy Trends Analysis (2025)
Flexible
3 listings
21.4% of total
Moderate
2 listings
14.3% of total
Firm
5 listings
35.7% of total
Strict
4 listings
28.6% of total
Cancellation Policy Insights for Chailly-en-Bière
- The prevailing Airbnb cancellation policy trend in Chailly-en-Bière is Firm, used by 35.7% of listings.
- A majority (64.3%) of hosts in Chailly-en-Bière utilize Firm or Strict policies, indicating a market where hosts prioritize booking security.
Recommendations for Hosts
- Consider adopting a Firm policy to align with the 35.7% market standard in Chailly-en-Bière.
- Regularly review your cancellation policy against competitors and market demand shifts in Chailly-en-Bière.
Chailly-en-Bière STR Booking Lead Time Analysis (2025)
Average Booking Lead Time by Month
Booking Lead Time Insights for Chailly-en-Bière
- The overall average booking lead time for vacation rentals in Chailly-en-Bière is 66 days.
- Guests book furthest in advance for stays during July (average 127 days), likely coinciding with peak travel demand or local events.
- The shortest booking windows occur for stays in February (average 21 days), indicating more last-minute travel plans during this time.
- Seasonally, Summer (102 days avg.) sees the longest lead times, while Winter (33 days avg.) has the shortest, reflecting typical travel planning cycles.
Recommendations for Hosts
- Use the overall average lead time (66 days) as a baseline for your pricing and availability strategy in Chailly-en-Bière.
- For July stays, consider implementing length-of-stay discounts or slightly higher rates for bookings made less than 127 days out to capitalize on advance planning.
- Target marketing efforts for the Summer season well in advance (at least 102 days) to capture early planners.
- Monitor your own booking lead times against these Chailly-en-Bière averages to identify opportunities for dynamic pricing adjustments.
Popular & Essential Airbnb Amenities in Chailly-en-Bière (2025)
Amenity Prevalence
Amenity Insights for Chailly-en-Bière
- Essential amenities in Chailly-en-Bière that guests expect include: Heating, Wifi, Essentials. Lacking these (any) could significantly impact bookings.
- Popular amenities like Hot water, Free parking on premises, Kitchen are common but not universal. Offering these can provide a competitive edge.
Recommendations for Hosts
- Ensure your listing includes all essential amenities for Chailly-en-Bière: Heating, Wifi, Essentials.
- Consider adding popular differentiators like Hot water or Free parking on premises to increase appeal.
- Highlight unique or less common amenities you offer (e.g., hot tub, dedicated workspace, EV charger) in your listing description and photos.
- Regularly check competitor amenities in Chailly-en-Bière to stay competitive.
Chailly-en-Bière Airbnb Guest Demographics & Profile Analysis (2025)
Guest Profile Summary for Chailly-en-Bière
- The typical guest profile for Airbnb in Chailly-en-Bière consists of primarily domestic travelers (67%), often arriving from nearby Paris, typically belonging to the Post-2000s (Gen Z/Alpha) group (50%), primarily speaking English or French.
- Domestic travelers account for 67.4% of guests.
- Key international markets include France (67.4%) and United Kingdom (7.5%).
- Top languages spoken are English (38%) followed by French (35.8%).
- A significant demographic segment is the Post-2000s (Gen Z/Alpha) group, representing 50% of guests.
Recommendations for Hosts
- Target domestic marketing efforts towards travelers from Paris and England.
- Tailor amenities and listing descriptions to appeal to the dominant Post-2000s (Gen Z/Alpha) demographic (e.g., highlight fast WiFi, smart home features, local guides).
- Highlight unique local experiences or amenities relevant to the primary guest profile.
- Consider seasonal promotions aligned with peak travel times for key origin markets.
Nearby Short-Term Rental Market Comparison
How does the Chailly-en-Bière Airbnb market stack up against its neighbors? Compare key performance metrics like average monthly revenue, ADR, and occupancy rates in surrounding areas to understand the broader regional STR landscape.
| Market | Active Properties | Monthly Revenue | Daily Rate | Avg. Occupancy |
|---|---|---|---|---|
| Morienval | 10 | $5,794 | $400.84 | 32% |
| Verdelot | 13 | $3,885 | $300.79 | 46% |
| Trigny | 10 | $3,775 | $248.19 | 46% |
| La Couture-Boussey | 12 | $3,620 | $378.08 | 28% |
| Dourdan | 15 | $3,576 | $223.06 | 52% |
| Rosoy-en-Multien | 15 | $3,558 | $367.61 | 51% |
| Millançay | 11 | $3,476 | $370.42 | 39% |
| Chaintreaux | 11 | $3,136 | $278.28 | 34% |
| Langon-sur-Cher | 12 | $3,127 | $400.27 | 35% |
| Mesnils-sur-Iton | 22 | $3,028 | $309.05 | 40% |