Bures-sur-Yvette Airbnb Market Analysis 2025: Short Term Rental Data & Vacation Rental Statistics in Ile-de-France, France
Is Airbnb profitable in Bures-sur-Yvette in 2025? Explore comprehensive Airbnb analytics for Bures-sur-Yvette, Ile-de-France, France to uncover income potential. This 2025 STR market report for Bures-sur-Yvette, based on AirROI data from April 2024 to March 2025, reveals key trends in the niche market of 36 active listings.
Whether you're considering an Airbnb investment in Bures-sur-Yvette, optimizing your existing vacation rental, or exploring rental arbitrage opportunities, understanding the Bures-sur-Yvette Airbnb data is crucial. Leveraging the low regulation environment is key to maximizing your short term rental income potential. Let's dive into the specifics.
Key Bures-sur-Yvette Airbnb Performance Metrics Overview
Monthly Airbnb Revenue Variations & Income Potential in Bures-sur-Yvette (2025)
Understanding the monthly revenue variations for Airbnb listings in Bures-sur-Yvette is key to maximizing your short term rental income potential. Seasonality significantly impacts earnings. Our analysis, based on data from the past 12 months, shows that the peak revenue month for STRs in Bures-sur-Yvette is typically May, while March often presents the lowest earnings, highlighting opportunities for strategic pricing adjustments during shoulder and low seasons. Explore the typical Airbnb income in Bures-sur-Yvette across different performance tiers:
- Best-in-class properties (Top 10%) achieve $2,254+ monthly, often utilizing dynamic pricing and superior guest experiences.
- Strong performing properties (Top 25%) earn $1,391 or more, indicating effective management and desirable locations/amenities.
- Typical properties (Median) generate around $905 per month, representing the average market performance.
- Entry-level properties (Bottom 25%) see earnings around $465, often with potential for optimization.
Average Monthly Airbnb Earnings Trend in Bures-sur-Yvette
Bures-sur-Yvette Airbnb Occupancy Rate Trends (2025)
Maximize your bookings by understanding the Bures-sur-Yvette STR occupancy trends. Seasonal demand shifts significantly influence how often properties are booked. Typically, Maysees the highest demand (peak season occupancy), while March experiences the lowest (low season). Effective strategies, like adjusting minimum stays or offering promotions, can boost occupancy during slower periods. Here's how different property tiers perform in Bures-sur-Yvette:
- Best-in-class properties (Top 10%) achieve 75%+ occupancy, indicating high desirability and potentially optimized availability.
- Strong performing properties (Top 25%) maintain 56% or higher occupancy, suggesting good market fit and guest satisfaction.
- Typical properties (Median) have an occupancy rate around 31%.
- Entry-level properties (Bottom 25%) average 13% occupancy, potentially facing higher vacancy.
Average Monthly Occupancy Rate Trend in Bures-sur-Yvette
Average Daily Rate (ADR) Airbnb Trends in Bures-sur-Yvette (2025)
Effective short term rental pricing strategy in Bures-sur-Yvette involves understanding monthly ADR fluctuations. The Average Daily Rate (ADR) for Airbnb in Bures-sur-Yvette typically peaks in July and dips lowest during April. Leveraging Airbnb dynamic pricing tools or strategies based on this seasonality can significantly boost revenue. Here's a look at the typical nightly rates achieved:
- Best-in-class properties (Top 10%) command rates of $171+ per night, often due to premium features or locations.
- Strong performing properties (Top 25%) achieve nightly rates of $110 or more.
- Typical properties (Median) charge around $73 per night.
- Entry-level properties (Bottom 25%) earn around $55 per night.
Average Daily Rate (ADR) Trend by Month in Bures-sur-Yvette
Get Live Bures-sur-Yvette Market Intelligence 👇

Explore Real-time Analytics
Airbnb Seasonality Analysis & Trends in Bures-sur-Yvette (2025)
Peak Season (May, June, April)
- Revenue averages $1,912 per month
- Occupancy rates average 36.1%
- Daily rates average $111
Shoulder Season
- Revenue averages $1,113 per month
- Occupancy maintains around 38.3%
- Daily rates hold near $118
Low Season (January, February, March)
- Revenue drops to average $579 per month
- Occupancy decreases to average 34.9%
- Daily rates adjust to average $112
Seasonality Insights for Bures-sur-Yvette
- The Airbnb seasonality in Bures-sur-Yvette shows highly seasonal trends requiring careful strategy. While the sections above show seasonal averages, it's also insightful to look at the extremes:
- During the high season, the absolute peak month showcases Bures-sur-Yvette's highest earning potential, with monthly revenues capable of climbing to $2,151, occupancy reaching a high of 43.7%, and ADRs peaking at $124.
- Conversely, the slowest single month of the year, typically falling within the low season, marks the market's lowest point. In this month, revenue might dip to $514, occupancy could drop to 28.7%, and ADRs may adjust down to $109.
- Understanding both the seasonal averages and these monthly peaks and troughs in revenue, occupancy, and ADR is crucial for maximizing your Airbnb profit potential in Bures-sur-Yvette.
Seasonal Strategies for Maximizing Profit
- Peak Season: Maximize revenue through premium pricing and potentially longer minimum stays. Ensure high availability.
- Low Season: Offer competitive pricing, special promotions (e.g., extended stay discounts), and flexible cancellation policies. Target off-season travelers like remote workers or budget-conscious guests.
- Shoulder Seasons: Implement dynamic pricing that balances peak and low rates. Target weekend travelers or specific events. Offer slightly more flexible terms than peak season.
- Regularly analyze your own performance against these Bures-sur-Yvette seasonality benchmarks and adjust your pricing and availability strategy accordingly.
Best Areas for Airbnb Investment in Bures-sur-Yvette (2025)
Exploring the top neighborhoods for short-term rentals in Bures-sur-Yvette? This section highlights key areas, outlining why they are attractive for hosts and guests, along with notable local attractions. Consider these locations based on your target guest profile and investment strategy.
| Neighborhood / Area | Why Host Here? (Target Guests & Appeal) | Key Attractions & Landmarks |
|---|---|---|
| Bures Centre | The charming heart of Bures-sur-Yvette, featuring quaint shops, local cafes, and a strong community vibe. Attractive for travelers wanting an authentic village experience with easy access to nature. | Parc de la Vallée aux Loups, Nearby creeks, Local markets |
| Yvette Riverbank | Scenic riverside location known for its tranquil environment, perfect for nature lovers and those seeking a peaceful retreat. Ideal for guests who enjoy outdoor activities and exploring nature. | Yvette River, Hiking trails, Picnic areas, Nature walks, Fishing opportunities |
| Nearby Orsay | Just a short drive from Bures, Orsay is a larger town that offers more amenities and cultural attractions. It draws visitors interested in a broader range of activities. | Orsay Museum, Local restaurants, Shopping areas, Cultural festivals, Parks and recreation areas |
| Sceaux | Sceaux is known for its beautiful park and historic chateau, attracting history buffs and families. Its spacious areas provide a perfect backdrop for outdoor activities. | Château de Sceaux, Parc de Sceaux, Local shops, Art exhibitions, Events in the park |
| Competitive Saclay | Home to a major tech hub and key educational institutions, Saclay attracts business travelers and academics, making it ideal for short-term rentals. | Saclay Tech Campus, Nearby research centers, Restaurants and cafes, Public transport accessibility, Business events |
| Saint-Rémy-lès-Chevreuse | A picturesque town in the Chevreuse Valley known for its natural beauty and hiking routes, suitable for guests seeking adventure and outdoor experiences. | Chevreuse Valley, Hiking trails, Historic sites, Nature parks, Village markets |
| Gif-sur-Yvette | Close to Bures, this area offers a blend of urban and rural living, ideal for those wanting to experience both city life and nature. | Local parks, Shopping districts, Cafes and restaurants, Community events, Public transport connections |
| Clamart | A bit further out, Clamart is an attractive suburb of Paris, providing easy access to the city while maintaining a suburban feel, attractive for both tourists and families. | Clamart parks, Shopping areas, Cultural venues, Public transport to Paris, Community events |
Understanding Airbnb License Requirements & STR Laws in Bures-sur-Yvette (2025)
While Bures-sur-Yvette, Ile-de-France, France currently shows low STR regulations, specific Airbnb license requirements might still exist or change. Always verify the latest short term rental regulations and Airbnb license requirements directly with local government authorities for Bures-sur-Yvette to ensure full compliance before hosting.
(Source: AirROI data, 2025, finding no licensed listings among those analyzed)
Top Performing Airbnb Properties in Bures-sur-Yvette (2025)
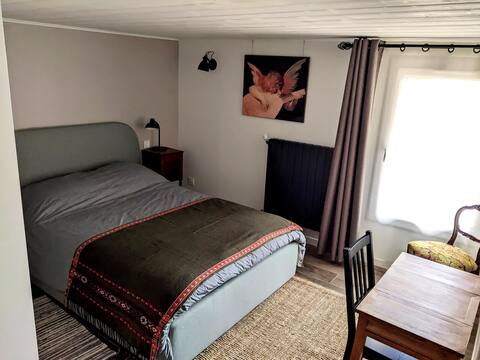
Benchmark your potential! Explore examples of top-performing Airbnb properties in Bures-sur-Yvettebased on Trailing Twelve Month (TTM) revenue. Analyze their characteristics, revenue, occupancy rate, and ADR to understand what drives success in this market.
Ideal for visiting Paris/Versailles
Entire Place • 4 bedrooms
Harmonie : design contemporain et nature préservée
Entire Place • 4 bedrooms
Accommodation near RER B station
Private Room • 2 bedrooms
Seminar and relaxing, RER B 7 minutes away (450m)
Entire Place • 6 bedrooms
Bed & Breakfast The Quiet Room
Private Room • N/A
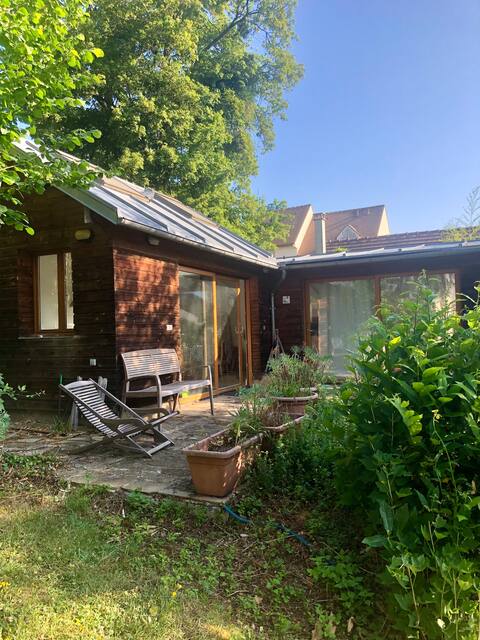
Small independent house in garden
Entire Place • 1 bedroom
Note: Performance varies based on location, size, amenities, seasonality, and management quality. Data reflects the past 12 months.
Top Performing Airbnb Hosts in Bures-sur-Yvette (2025)
Learn from the best! This table showcases top-performing Airbnb hosts in Bures-sur-Yvette based on the number of properties managed and estimated total revenue over the past year. Analyze their scale and performance metrics.
| Host Name | Properties | Grossing Revenue | Stay Reviews | Avg Rating |
|---|---|---|---|---|
| Karine | 5 | $64,087 | 65 | 5.00/5.0 |
| Lien | 3 | $34,301 | 42 | 4.75/5.0 |
| Host #51436260 | 1 | $19,496 | 3 | 5.00/5.0 |
| Lotfi | 1 | $16,364 | 19 | 5.00/5.0 |
| Residhome Bures | 2 | $15,983 | 137 | 4.58/5.0 |
| Kevin | 1 | $15,341 | 55 | 4.96/5.0 |
| Eliane | 1 | $14,725 | 5 | 5.00/5.0 |
| Arnaud | 1 | $14,265 | 100 | 4.85/5.0 |
| Nathalie | 1 | $12,002 | 22 | 5.00/5.0 |
| Madouri | 1 | $10,894 | 74 | 4.70/5.0 |
Analyzing the strategies of top hosts, such as their property selection, pricing, and guest communication, can offer valuable lessons for optimizing your own Airbnb operations in Bures-sur-Yvette.
Dive Deeper: Advanced Bures-sur-Yvette STR Market Data (2025)
Ready to unlock more insights? AirROI provides access to advanced metrics and comprehensive Airbnb data for Bures-sur-Yvette. Explore detailed analytics beyond this report to refine your investment strategy, optimize pricing, and maximize your vacation rental profits.
Explore Advanced MetricsBures-sur-Yvette Short-Term Rental Market Composition (2025): Property & Room Types
Room Type Distribution
Property Type Distribution
Market Composition Insights for Bures-sur-Yvette
- The Bures-sur-Yvette Airbnb market composition is heavily skewed towards Entire Home/Apt listings, which make up 52.8% of the 36 active rentals. This indicates strong guest preference for privacy and space.
- However, a notable 47.2% share for Private Rooms suggests opportunities for budget-conscious travelers or hosts renting out spare rooms.
- Looking at the property type distribution in Bures-sur-Yvette, Apartment/Condo properties are the most common (47.2%), reflecting the local real estate landscape.
- Houses represent a significant 38.9% portion, catering likely to families or larger groups.
- The presence of 13.9% Hotel/Boutique listings indicates integration with traditional hospitality.
Bures-sur-Yvette Airbnb Room Capacity Analysis (2025): Bedroom Distribution
Distribution of Listings by Number of Bedrooms
Room Capacity Insights for Bures-sur-Yvette
- The dominant room capacity in Bures-sur-Yvette is 1 bedroom listings, making up 38.9% of the market. This suggests a strong demand for properties suitable for couples or solo travelers.
- Together, 1 bedroom and 2 bedrooms properties represent 52.8% of the active Airbnb listings in Bures-sur-Yvette, indicating a high concentration in these sizes.
Bures-sur-Yvette Vacation Rental Guest Capacity Trends (2025)
Distribution of Listings by Guest Capacity
Guest Capacity Insights for Bures-sur-Yvette
- The most common guest capacity trend in Bures-sur-Yvette vacation rentals is listings accommodating 2 guests (22.2%). This suggests the primary traveler segment is likely couples or solo travelers.
- Properties designed for 2 guests and 8+ guests dominate the Bures-sur-Yvette STR market, accounting for 33.3% of listings.
- 16.7% of properties accommodate 6+ guests, serving the market segment for larger families or group travel in Bures-sur-Yvette.
- On average, properties in Bures-sur-Yvette are equipped to host 2.3 guests.
Bures-sur-Yvette Airbnb Booking Patterns (2025): Available vs. Booked Days
Available Days Distribution
Booked Days Distribution
Booking Pattern Insights for Bures-sur-Yvette
- The most common availability pattern in Bures-sur-Yvette falls within the 271-366 days range, representing 61.1% of listings. This suggests many properties have significant open periods on their calendars.
- Approximately 88.9% of listings show high availability (181+ days open annually), indicating potential for increased bookings or specific owner usage patterns.
- For booked days, the 1-30 days range is most frequent in Bures-sur-Yvette (33.3%), reflecting common guest stay durations or potential owner blocking patterns.
- A notable 13.9% of properties secure long booking periods (181+ days booked per year), highlighting successful long-term rental strategies or significant owner usage.
Bures-sur-Yvette Airbnb Minimum Stay Requirements Analysis
Distribution of Listings by Minimum Night Requirement
1 Night
16 listings
50% of total
2 Nights
4 listings
12.5% of total
3 Nights
8 listings
25% of total
7-29 Nights
1 listings
3.1% of total
30+ Nights
3 listings
9.4% of total
Key Insights
- The most prevalent minimum stay requirement in Bures-sur-Yvette is 1 Night, adopted by 50% of listings. This highlights the market's preference for shorter, flexible bookings.
- A strong majority (62.5%) of the Bures-sur-Yvette Airbnb data shows acceptance of very short stays (1-2 nights), indicating a dynamic, high-turnover market.
Recommendations
- Align with the market by considering a 1 Night minimum stay, as 50% of Bures-sur-Yvette hosts use this setting.
- Explore offering discounts for stays of 30+ nights to attract the 9.4% of the market seeking extended stays.
- Adjust minimum nights based on seasonality – potentially shorter during low season and longer during peak demand periods in Bures-sur-Yvette.
Bures-sur-Yvette Airbnb Cancellation Policy Trends Analysis (2025)
Flexible
9 listings
33.3% of total
Moderate
11 listings
40.7% of total
Firm
3 listings
11.1% of total
Strict
4 listings
14.8% of total
Cancellation Policy Insights for Bures-sur-Yvette
- The prevailing Airbnb cancellation policy trend in Bures-sur-Yvette is Moderate, used by 40.7% of listings.
- The market strongly favors guest-friendly terms, with 74.0% of listings offering Flexible or Moderate policies. This suggests guests in Bures-sur-Yvette may expect booking flexibility.
Recommendations for Hosts
- Consider adopting a Moderate policy to align with the 40.7% market standard in Bures-sur-Yvette.
- Using a Strict policy might deter some guests, as only 14.8% of listings use it. Evaluate if potential revenue protection outweighs possible lower booking rates.
- Regularly review your cancellation policy against competitors and market demand shifts in Bures-sur-Yvette.
Bures-sur-Yvette STR Booking Lead Time Analysis (2025)
Average Booking Lead Time by Month
Booking Lead Time Insights for Bures-sur-Yvette
- The overall average booking lead time for vacation rentals in Bures-sur-Yvette is 61 days.
- Guests book furthest in advance for stays during August (average 116 days), likely coinciding with peak travel demand or local events.
- The shortest booking windows occur for stays in February (average 22 days), indicating more last-minute travel plans during this time.
- Seasonally, Summer (109 days avg.) sees the longest lead times, while Winter (48 days avg.) has the shortest, reflecting typical travel planning cycles.
Recommendations for Hosts
- Use the overall average lead time (61 days) as a baseline for your pricing and availability strategy in Bures-sur-Yvette.
- For August stays, consider implementing length-of-stay discounts or slightly higher rates for bookings made less than 116 days out to capitalize on advance planning.
- Target marketing efforts for the Summer season well in advance (at least 109 days) to capture early planners.
- Monitor your own booking lead times against these Bures-sur-Yvette averages to identify opportunities for dynamic pricing adjustments.
Popular & Essential Airbnb Amenities in Bures-sur-Yvette (2025)
Amenity Prevalence
Amenity Insights for Bures-sur-Yvette
- Essential amenities in Bures-sur-Yvette that guests expect include: Wifi. Lacking these (this) could significantly impact bookings.
- Popular amenities like Smoke alarm, Hot water, Kitchen are common but not universal. Offering these can provide a competitive edge.
Recommendations for Hosts
- Ensure your listing includes all essential amenities for Bures-sur-Yvette: Wifi.
- Consider adding popular differentiators like Smoke alarm or Hot water to increase appeal.
- Highlight unique or less common amenities you offer (e.g., hot tub, dedicated workspace, EV charger) in your listing description and photos.
- Regularly check competitor amenities in Bures-sur-Yvette to stay competitive.
Bures-sur-Yvette Airbnb Guest Demographics & Profile Analysis (2025)
Guest Profile Summary for Bures-sur-Yvette
- The typical guest profile for Airbnb in Bures-sur-Yvette consists of primarily domestic travelers (76%), often arriving from nearby Paris, typically belonging to the Post-2000s (Gen Z/Alpha) group (50%), primarily speaking English or French.
- Domestic travelers account for 76.1% of guests.
- Key international markets include France (76.1%) and United States (3.4%).
- Top languages spoken are English (34.6%) followed by French (32.3%).
- A significant demographic segment is the Post-2000s (Gen Z/Alpha) group, representing 50% of guests.
Recommendations for Hosts
- Target domestic marketing efforts towards travelers from Paris and Authezat.
- Tailor amenities and listing descriptions to appeal to the dominant Post-2000s (Gen Z/Alpha) demographic (e.g., highlight fast WiFi, smart home features, local guides).
- Highlight unique local experiences or amenities relevant to the primary guest profile.
- Consider seasonal promotions aligned with peak travel times for key origin markets.
Nearby Short-Term Rental Market Comparison
How does the Bures-sur-Yvette Airbnb market stack up against its neighbors? Compare key performance metrics like average monthly revenue, ADR, and occupancy rates in surrounding areas to understand the broader regional STR landscape.
| Market | Active Properties | Monthly Revenue | Daily Rate | Avg. Occupancy |
|---|---|---|---|---|
| Morienval | 10 | $5,794 | $400.84 | 32% |
| Verdelot | 13 | $3,885 | $300.79 | 46% |
| Trigny | 10 | $3,775 | $248.19 | 46% |
| La Couture-Boussey | 12 | $3,620 | $378.08 | 28% |
| Dourdan | 15 | $3,576 | $223.06 | 52% |
| Rosoy-en-Multien | 15 | $3,558 | $367.61 | 51% |
| Millançay | 11 | $3,476 | $370.42 | 39% |
| Chaintreaux | 11 | $3,136 | $278.28 | 34% |
| Langon-sur-Cher | 12 | $3,127 | $400.27 | 35% |
| Mesnils-sur-Iton | 22 | $3,028 | $309.05 | 40% |