Bry-sur-Marne Airbnb Market Analysis 2025: Short Term Rental Data & Vacation Rental Statistics in Ile-de-France, France
Is Airbnb profitable in Bry-sur-Marne in 2025? Explore comprehensive Airbnb analytics for Bry-sur-Marne, Ile-de-France, France to uncover income potential. This 2025 STR market report for Bry-sur-Marne, based on AirROI data from April 2024 to March 2025, reveals key trends in the niche market of 68 active listings.
Whether you're considering an Airbnb investment in Bry-sur-Marne, optimizing your existing vacation rental, or exploring rental arbitrage opportunities, understanding the Bry-sur-Marne Airbnb data is crucial. Leveraging the low regulation environment is key to maximizing your short term rental income potential. Let's dive into the specifics.
Key Bry-sur-Marne Airbnb Performance Metrics Overview
Monthly Airbnb Revenue Variations & Income Potential in Bry-sur-Marne (2025)
Understanding the monthly revenue variations for Airbnb listings in Bry-sur-Marne is key to maximizing your short term rental income potential. Seasonality significantly impacts earnings. Our analysis, based on data from the past 12 months, shows that the peak revenue month for STRs in Bry-sur-Marne is typically July, while February often presents the lowest earnings, highlighting opportunities for strategic pricing adjustments during shoulder and low seasons. Explore the typical Airbnb income in Bry-sur-Marne across different performance tiers:
- Best-in-class properties (Top 10%) achieve $4,058+ monthly, often utilizing dynamic pricing and superior guest experiences.
- Strong performing properties (Top 25%) earn $2,376 or more, indicating effective management and desirable locations/amenities.
- Typical properties (Median) generate around $1,312 per month, representing the average market performance.
- Entry-level properties (Bottom 25%) see earnings around $668, often with potential for optimization.
Average Monthly Airbnb Earnings Trend in Bry-sur-Marne
Bry-sur-Marne Airbnb Occupancy Rate Trends (2025)
Maximize your bookings by understanding the Bry-sur-Marne STR occupancy trends. Seasonal demand shifts significantly influence how often properties are booked. Typically, Octobersees the highest demand (peak season occupancy), while September experiences the lowest (low season). Effective strategies, like adjusting minimum stays or offering promotions, can boost occupancy during slower periods. Here's how different property tiers perform in Bry-sur-Marne:
- Best-in-class properties (Top 10%) achieve 86%+ occupancy, indicating high desirability and potentially optimized availability.
- Strong performing properties (Top 25%) maintain 67% or higher occupancy, suggesting good market fit and guest satisfaction.
- Typical properties (Median) have an occupancy rate around 39%.
- Entry-level properties (Bottom 25%) average 18% occupancy, potentially facing higher vacancy.
Average Monthly Occupancy Rate Trend in Bry-sur-Marne
Average Daily Rate (ADR) Airbnb Trends in Bry-sur-Marne (2025)
Effective short term rental pricing strategy in Bry-sur-Marne involves understanding monthly ADR fluctuations. The Average Daily Rate (ADR) for Airbnb in Bry-sur-Marne typically peaks in August and dips lowest during March. Leveraging Airbnb dynamic pricing tools or strategies based on this seasonality can significantly boost revenue. Here's a look at the typical nightly rates achieved:
- Best-in-class properties (Top 10%) command rates of $373+ per night, often due to premium features or locations.
- Strong performing properties (Top 25%) achieve nightly rates of $192 or more.
- Typical properties (Median) charge around $106 per night.
- Entry-level properties (Bottom 25%) earn around $71 per night.
Average Daily Rate (ADR) Trend by Month in Bry-sur-Marne
Get Live Bry-sur-Marne Market Intelligence 👇

Explore Real-time Analytics
Airbnb Seasonality Analysis & Trends in Bry-sur-Marne (2025)
Peak Season (July, August, May)
- Revenue averages $2,540 per month
- Occupancy rates average 46.3%
- Daily rates average $191
Shoulder Season
- Revenue averages $1,825 per month
- Occupancy maintains around 44.3%
- Daily rates hold near $177
Low Season (January, February, March)
- Revenue drops to average $1,124 per month
- Occupancy decreases to average 38.8%
- Daily rates adjust to average $159
Seasonality Insights for Bry-sur-Marne
- The Airbnb seasonality in Bry-sur-Marne shows highly seasonal trends requiring careful strategy. While the sections above show seasonal averages, it's also insightful to look at the extremes:
- During the high season, the absolute peak month showcases Bry-sur-Marne's highest earning potential, with monthly revenues capable of climbing to $2,696, occupancy reaching a high of 55.5%, and ADRs peaking at $195.
- Conversely, the slowest single month of the year, typically falling within the low season, marks the market's lowest point. In this month, revenue might dip to $970, occupancy could drop to 35.6%, and ADRs may adjust down to $158.
- Understanding both the seasonal averages and these monthly peaks and troughs in revenue, occupancy, and ADR is crucial for maximizing your Airbnb profit potential in Bry-sur-Marne.
Seasonal Strategies for Maximizing Profit
- Peak Season: Maximize revenue through premium pricing and potentially longer minimum stays. Ensure high availability.
- Low Season: Offer competitive pricing, special promotions (e.g., extended stay discounts), and flexible cancellation policies. Target off-season travelers like remote workers or budget-conscious guests.
- Shoulder Seasons: Implement dynamic pricing that balances peak and low rates. Target weekend travelers or specific events. Offer slightly more flexible terms than peak season.
- Regularly analyze your own performance against these Bry-sur-Marne seasonality benchmarks and adjust your pricing and availability strategy accordingly.
Best Areas for Airbnb Investment in Bry-sur-Marne (2025)
Exploring the top neighborhoods for short-term rentals in Bry-sur-Marne? This section highlights key areas, outlining why they are attractive for hosts and guests, along with notable local attractions. Consider these locations based on your target guest profile and investment strategy.
| Neighborhood / Area | Why Host Here? (Target Guests & Appeal) | Key Attractions & Landmarks |
|---|---|---|
| Bry-sur-Marne Centre | The heart of Bry-sur-Marne with charming streets, local shops, and a lively atmosphere. Ideal for guests wanting to experience local culture and convenience to amenities. | Parc de Noisiel, Église Saint-Georges, local bakeries and cafés, shopping areas, nearby public transportation to Paris |
| Parc des Capucins | A family-friendly neighborhood with parks and recreational areas. Great location for families and travelers who enjoy outdoor activities and a peaceful environment. | Parc des Capucins, children's playgrounds, walking trails, picnic areas, proximity to La Marne river |
| Le Bois de Vincennes | A large urban park that's ideal for nature lovers. Offers a tranquil escape from the city with various outdoor activities, making it appealing for guests looking to relax and unwind. | Bois de Vincennes Park, Château de Vincennes, Lac de Minimes, zoo and botanical gardens, running and cycling paths |
| Rue de Paris | A bustling street filled with cafes, shops, and restaurants. Popular among guests looking for a vibrant local experience and easy access to dining and nightlife. | local restaurants and bistros, boutique shops, cultural events, public transport links |
| Bords de Marne | Picturesque riverside area perfect for leisurely walks and outdoor activities. Attracts those looking for a scenic view and a relaxing atmosphere. | walking paths along the Marne, picnic spots, boating activities, scenic views, seasonal events by the river |
| Cité Descartes | An innovative development area known for its modern architecture and proximity to technology and educational institutions. Attracts business travelers and academics. | Université Gustave Eiffel, technological exhibitions, modern parks, business centers |
| Villiers-sur-Marne | Adjacent suburb with a variety of amenities and easy access to Bry-sur-Marne. Good for budget travelers looking for affordable options close to attractions. | shopping centers, local markets, restaurants, train station |
| Champs-sur-Marne | Known for its historical sites and peaceful residential areas. Ideal for guests interested in history and suburban life while being close to Paris. | Château de Champs-sur-Marne, gardens and grounds, local restaurants, historical sites |
Understanding Airbnb License Requirements & STR Laws in Bry-sur-Marne (2025)
While Bry-sur-Marne, Ile-de-France, France currently shows low STR regulations, specific Airbnb license requirements might still exist or change. Always verify the latest short term rental regulations and Airbnb license requirements directly with local government authorities for Bry-sur-Marne to ensure full compliance before hosting.
(Source: AirROI data, 2025, based on 1% licensed listings)
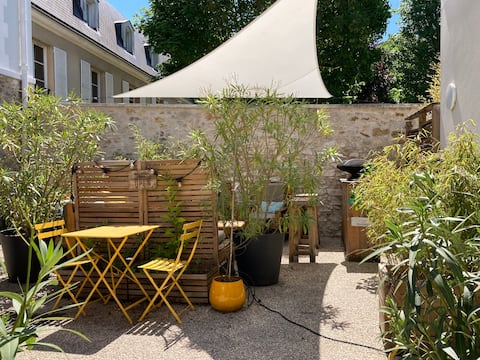
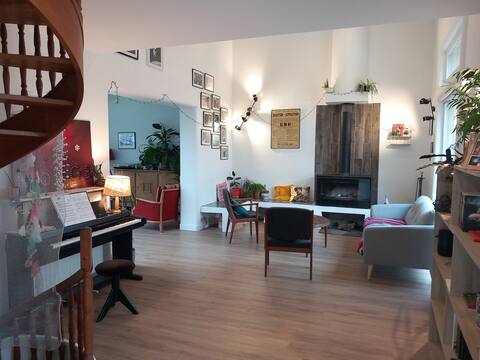
Top Performing Airbnb Properties in Bry-sur-Marne (2025)
Benchmark your potential! Explore examples of top-performing Airbnb properties in Bry-sur-Marnebased on Trailing Twelve Month (TTM) revenue. Analyze their characteristics, revenue, occupancy rate, and ADR to understand what drives success in this market.
Splendid apartment between Paris and Disney
Entire Place • 4 bedrooms
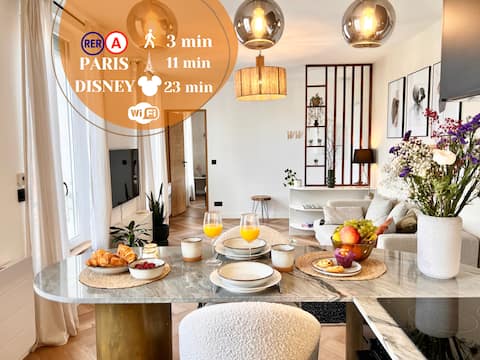
Le Van Gogh Appart • 3'RER • 11'Paris • 23'Disney
Entire Place • 1 bedroom
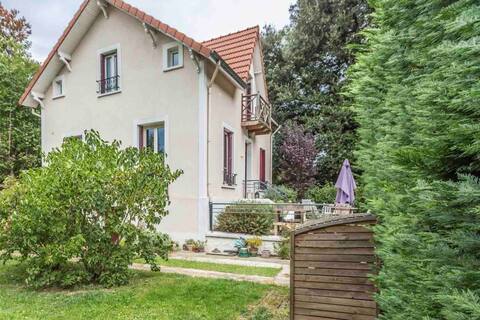
House near Paris/Disneyland
Entire Place • 4 bedrooms
Maison 4 chambres avec jardin proche Paris
Entire Place • 4 bedrooms
Luxurious High Standing Apartment
Entire Place • 1 bedroom

Between Paris and Disneyland metro direct RER A
Entire Place • 2 bedrooms
Note: Performance varies based on location, size, amenities, seasonality, and management quality. Data reflects the past 12 months.
Top Performing Airbnb Hosts in Bry-sur-Marne (2025)
Learn from the best! This table showcases top-performing Airbnb hosts in Bry-sur-Marne based on the number of properties managed and estimated total revenue over the past year. Analyze their scale and performance metrics.
| Host Name | Properties | Grossing Revenue | Stay Reviews | Avg Rating |
|---|---|---|---|---|
| Nathalie | 2 | $92,521 | 91 | 4.95/5.0 |
| Ornella | 1 | $44,267 | 67 | 4.91/5.0 |
| Adrien | 1 | $43,059 | 20 | 4.85/5.0 |
| Host #87020738 | 1 | $38,717 | 0 | 0.00/5.0 |
| Sophie | 1 | $33,084 | 23 | 4.96/5.0 |
| Aurélie Et Christophe | 1 | $30,434 | 96 | 4.81/5.0 |
| Host #12343750 | 1 | $25,020 | 0 | 0.00/5.0 |
| Host #5745484 | 2 | $23,725 | 2 | 0.00/5.0 |
| Host #283132578 | 1 | $23,053 | 26 | 4.77/5.0 |
| Host #83714765 | 2 | $22,027 | 1 | 0.00/5.0 |
Analyzing the strategies of top hosts, such as their property selection, pricing, and guest communication, can offer valuable lessons for optimizing your own Airbnb operations in Bry-sur-Marne.
Dive Deeper: Advanced Bry-sur-Marne STR Market Data (2025)
Ready to unlock more insights? AirROI provides access to advanced metrics and comprehensive Airbnb data for Bry-sur-Marne. Explore detailed analytics beyond this report to refine your investment strategy, optimize pricing, and maximize your vacation rental profits.
Explore Advanced MetricsBry-sur-Marne Short-Term Rental Market Composition (2025): Property & Room Types
Room Type Distribution
Property Type Distribution
Market Composition Insights for Bry-sur-Marne
- The Bry-sur-Marne Airbnb market composition is heavily skewed towards Entire Home/Apt listings, which make up 85.3% of the 68 active rentals. This indicates strong guest preference for privacy and space.
- Looking at the property type distribution in Bry-sur-Marne, Apartment/Condo properties are the most common (63.2%), reflecting the local real estate landscape.
- Houses represent a significant 30.9% portion, catering likely to families or larger groups.
- Smaller segments like hotel/boutique, others (combined 5.8%) offer potential for unique stay experiences.
Bry-sur-Marne Airbnb Room Capacity Analysis (2025): Bedroom Distribution
Distribution of Listings by Number of Bedrooms
Room Capacity Insights for Bry-sur-Marne
- The dominant room capacity in Bry-sur-Marne is 1 bedroom listings, making up 45.6% of the market. This suggests a strong demand for properties suitable for couples or solo travelers.
- Together, 1 bedroom and 2 bedrooms properties represent 67.7% of the active Airbnb listings in Bry-sur-Marne, indicating a high concentration in these sizes.
- A significant 20.5% of listings offer 3+ bedrooms, catering to larger groups and families seeking more space in Bry-sur-Marne.
Bry-sur-Marne Vacation Rental Guest Capacity Trends (2025)
Distribution of Listings by Guest Capacity
Guest Capacity Insights for Bry-sur-Marne
- The most common guest capacity trend in Bry-sur-Marne vacation rentals is listings accommodating 2 guests (26.5%). This suggests the primary traveler segment is likely couples or solo travelers.
- Properties designed for 2 guests and 4 guests dominate the Bry-sur-Marne STR market, accounting for 50.0% of listings.
- 26.5% of properties accommodate 6+ guests, serving the market segment for larger families or group travel in Bry-sur-Marne.
- On average, properties in Bry-sur-Marne are equipped to host 3.9 guests.
Bry-sur-Marne Airbnb Booking Patterns (2025): Available vs. Booked Days
Available Days Distribution
Booked Days Distribution
Booking Pattern Insights for Bry-sur-Marne
- The most common availability pattern in Bry-sur-Marne falls within the 271-366 days range, representing 60.3% of listings. This suggests many properties have significant open periods on their calendars.
- Approximately 77.9% of listings show high availability (181+ days open annually), indicating potential for increased bookings or specific owner usage patterns.
- For booked days, the 1-30 days range is most frequent in Bry-sur-Marne (36.8%), reflecting common guest stay durations or potential owner blocking patterns.
- A notable 22.1% of properties secure long booking periods (181+ days booked per year), highlighting successful long-term rental strategies or significant owner usage.
Bry-sur-Marne Airbnb Minimum Stay Requirements Analysis
Distribution of Listings by Minimum Night Requirement
1 Night
8 listings
15.1% of total
2 Nights
19 listings
35.8% of total
3 Nights
9 listings
17% of total
4-6 Nights
9 listings
17% of total
7-29 Nights
4 listings
7.5% of total
30+ Nights
4 listings
7.5% of total
Key Insights
- The most prevalent minimum stay requirement in Bry-sur-Marne is 2 Nights, adopted by 35.8% of listings. This highlights the market's preference for shorter, flexible bookings.
Recommendations
- Align with the market by considering a 2 Nights minimum stay, as 35.8% of Bry-sur-Marne hosts use this setting.
- If feasible, allowing 1-night stays, especially midweek or during low season, could capture last-minute bookings, as only 15.1% currently do.
- A 2-night minimum appears standard (35.8%). Consider this for weekends or peak periods.
- Explore offering discounts for stays of 30+ nights to attract the 7.5% of the market seeking extended stays.
- Adjust minimum nights based on seasonality – potentially shorter during low season and longer during peak demand periods in Bry-sur-Marne.
Bry-sur-Marne Airbnb Cancellation Policy Trends Analysis (2025)
Super Strict 60 Days
1 listings
2.6% of total
Flexible
6 listings
15.8% of total
Moderate
16 listings
42.1% of total
Firm
8 listings
21.1% of total
Strict
7 listings
18.4% of total
Cancellation Policy Insights for Bry-sur-Marne
- The prevailing Airbnb cancellation policy trend in Bry-sur-Marne is Moderate, used by 42.1% of listings.
- There's a relatively balanced mix between guest-friendly (57.9%) and stricter (39.5%) policies, offering choices for different guest needs.
Recommendations for Hosts
- Consider adopting a Moderate policy to align with the 42.1% market standard in Bry-sur-Marne.
- Regularly review your cancellation policy against competitors and market demand shifts in Bry-sur-Marne.
Bry-sur-Marne STR Booking Lead Time Analysis (2025)
Average Booking Lead Time by Month
Booking Lead Time Insights for Bry-sur-Marne
- The overall average booking lead time for vacation rentals in Bry-sur-Marne is 53 days.
- Guests book furthest in advance for stays during July (average 120 days), likely coinciding with peak travel demand or local events.
- The shortest booking windows occur for stays in March (average 39 days), indicating more last-minute travel plans during this time.
- Seasonally, Summer (100 days avg.) sees the longest lead times, while Winter (43 days avg.) has the shortest, reflecting typical travel planning cycles.
Recommendations for Hosts
- Use the overall average lead time (53 days) as a baseline for your pricing and availability strategy in Bry-sur-Marne.
- For July stays, consider implementing length-of-stay discounts or slightly higher rates for bookings made less than 120 days out to capitalize on advance planning.
- Target marketing efforts for the Summer season well in advance (at least 100 days) to capture early planners.
- Monitor your own booking lead times against these Bry-sur-Marne averages to identify opportunities for dynamic pricing adjustments.
Popular & Essential Airbnb Amenities in Bry-sur-Marne (2025)
Amenity Prevalence
Amenity Insights for Bry-sur-Marne
- Essential amenities in Bry-sur-Marne that guests expect include: Wifi, Kitchen, Heating. Lacking these (any) could significantly impact bookings.
- Popular amenities like Hot water, Smoke alarm, TV are common but not universal. Offering these can provide a competitive edge.
Recommendations for Hosts
- Ensure your listing includes all essential amenities for Bry-sur-Marne: Wifi, Kitchen, Heating.
- Prioritize adding missing essentials: Kitchen, Heating.
- Consider adding popular differentiators like Hot water or Smoke alarm to increase appeal.
- Highlight unique or less common amenities you offer (e.g., hot tub, dedicated workspace, EV charger) in your listing description and photos.
- Regularly check competitor amenities in Bry-sur-Marne to stay competitive.
Bry-sur-Marne Airbnb Guest Demographics & Profile Analysis (2025)
Guest Profile Summary for Bry-sur-Marne
- The typical guest profile for Airbnb in Bry-sur-Marne consists of a mix of domestic (45%) and international guests, with top international origins including United Kingdom, typically belonging to the Post-2000s (Gen Z/Alpha) group (50%), primarily speaking English or French.
- Domestic travelers account for 45.2% of guests.
- Key international markets include France (45.2%) and United Kingdom (8.2%).
- Top languages spoken are English (40.3%) followed by French (24.7%).
- A significant demographic segment is the Post-2000s (Gen Z/Alpha) group, representing 50% of guests.
Recommendations for Hosts
- Balance marketing efforts between domestic and international channels based on the guest mix.
- Tailor amenities and listing descriptions to appeal to the dominant Post-2000s (Gen Z/Alpha) demographic (e.g., highlight fast WiFi, smart home features, local guides).
- Highlight unique local experiences or amenities relevant to the primary guest profile.
- Consider seasonal promotions aligned with peak travel times for key origin markets.
Nearby Short-Term Rental Market Comparison
How does the Bry-sur-Marne Airbnb market stack up against its neighbors? Compare key performance metrics like average monthly revenue, ADR, and occupancy rates in surrounding areas to understand the broader regional STR landscape.
| Market | Active Properties | Monthly Revenue | Daily Rate | Avg. Occupancy |
|---|---|---|---|---|
| Morienval | 10 | $5,794 | $400.84 | 32% |
| Verdelot | 13 | $3,885 | $300.79 | 46% |
| Trigny | 10 | $3,775 | $248.19 | 46% |
| La Couture-Boussey | 12 | $3,620 | $378.08 | 28% |
| Dourdan | 15 | $3,576 | $223.06 | 52% |
| Rosoy-en-Multien | 15 | $3,558 | $367.61 | 51% |
| Millançay | 11 | $3,476 | $370.42 | 39% |
| Chaintreaux | 11 | $3,136 | $278.28 | 34% |
| Langon-sur-Cher | 12 | $3,127 | $400.27 | 35% |
| Mesnils-sur-Iton | 22 | $3,028 | $309.05 | 40% |