Bailly Airbnb Market Analysis 2025: Short Term Rental Data & Vacation Rental Statistics in Ile-de-France, France
Is Airbnb profitable in Bailly in 2025? Explore comprehensive Airbnb analytics for Bailly, Ile-de-France, France to uncover income potential. This 2025 STR market report for Bailly, based on AirROI data from April 2024 to March 2025, reveals key trends in the niche market of 24 active listings.
Whether you're considering an Airbnb investment in Bailly, optimizing your existing vacation rental, or exploring rental arbitrage opportunities, understanding the Bailly Airbnb data is crucial. Leveraging the low regulation environment is key to maximizing your short term rental income potential. Let's dive into the specifics.
Key Bailly Airbnb Performance Metrics Overview
Monthly Airbnb Revenue Variations & Income Potential in Bailly (2025)
Understanding the monthly revenue variations for Airbnb listings in Bailly is key to maximizing your short term rental income potential. Seasonality significantly impacts earnings. Our analysis, based on data from the past 12 months, shows that the peak revenue month for STRs in Bailly is typically June, while December often presents the lowest earnings, highlighting opportunities for strategic pricing adjustments during shoulder and low seasons. Explore the typical Airbnb income in Bailly across different performance tiers:
- Best-in-class properties (Top 10%) achieve $7,925+ monthly, often utilizing dynamic pricing and superior guest experiences.
- Strong performing properties (Top 25%) earn $4,957 or more, indicating effective management and desirable locations/amenities.
- Typical properties (Median) generate around $1,698 per month, representing the average market performance.
- Entry-level properties (Bottom 25%) see earnings around $909, often with potential for optimization.
Average Monthly Airbnb Earnings Trend in Bailly
Bailly Airbnb Occupancy Rate Trends (2025)
Maximize your bookings by understanding the Bailly STR occupancy trends. Seasonal demand shifts significantly influence how often properties are booked. Typically, Octobersees the highest demand (peak season occupancy), while December experiences the lowest (low season). Effective strategies, like adjusting minimum stays or offering promotions, can boost occupancy during slower periods. Here's how different property tiers perform in Bailly:
- Best-in-class properties (Top 10%) achieve 81%+ occupancy, indicating high desirability and potentially optimized availability.
- Strong performing properties (Top 25%) maintain 48% or higher occupancy, suggesting good market fit and guest satisfaction.
- Typical properties (Median) have an occupancy rate around 28%.
- Entry-level properties (Bottom 25%) average 18% occupancy, potentially facing higher vacancy.
Average Monthly Occupancy Rate Trend in Bailly
Average Daily Rate (ADR) Airbnb Trends in Bailly (2025)
Effective short term rental pricing strategy in Bailly involves understanding monthly ADR fluctuations. The Average Daily Rate (ADR) for Airbnb in Bailly typically peaks in July and dips lowest during October. Leveraging Airbnb dynamic pricing tools or strategies based on this seasonality can significantly boost revenue. Here's a look at the typical nightly rates achieved:
- Best-in-class properties (Top 10%) command rates of $791+ per night, often due to premium features or locations.
- Strong performing properties (Top 25%) achieve nightly rates of $408 or more.
- Typical properties (Median) charge around $176 per night.
- Entry-level properties (Bottom 25%) earn around $73 per night.
Average Daily Rate (ADR) Trend by Month in Bailly
Get Live Bailly Market Intelligence 👇

Explore Real-time Analytics
Airbnb Seasonality Analysis & Trends in Bailly (2025)
Peak Season (June, May, January)
- Revenue averages $4,493 per month
- Occupancy rates average 40.6%
- Daily rates average $293
Shoulder Season
- Revenue averages $3,169 per month
- Occupancy maintains around 36.1%
- Daily rates hold near $291
Low Season (March, September, December)
- Revenue drops to average $2,309 per month
- Occupancy decreases to average 32.5%
- Daily rates adjust to average $275
Seasonality Insights for Bailly
- The Airbnb seasonality in Bailly shows highly seasonal trends requiring careful strategy. While the sections above show seasonal averages, it's also insightful to look at the extremes:
- During the high season, the absolute peak month showcases Bailly's highest earning potential, with monthly revenues capable of climbing to $5,572, occupancy reaching a high of 49.0%, and ADRs peaking at $329.
- Conversely, the slowest single month of the year, typically falling within the low season, marks the market's lowest point. In this month, revenue might dip to $2,108, occupancy could drop to 24.5%, and ADRs may adjust down to $264.
- Understanding both the seasonal averages and these monthly peaks and troughs in revenue, occupancy, and ADR is crucial for maximizing your Airbnb profit potential in Bailly.
Seasonal Strategies for Maximizing Profit
- Peak Season: Maximize revenue through premium pricing and potentially longer minimum stays. Ensure high availability.
- Low Season: Offer competitive pricing, special promotions (e.g., extended stay discounts), and flexible cancellation policies. Target off-season travelers like remote workers or budget-conscious guests.
- Shoulder Seasons: Implement dynamic pricing that balances peak and low rates. Target weekend travelers or specific events. Offer slightly more flexible terms than peak season.
- Regularly analyze your own performance against these Bailly seasonality benchmarks and adjust your pricing and availability strategy accordingly.
Best Areas for Airbnb Investment in Bailly (2025)
Exploring the top neighborhoods for short-term rentals in Bailly? This section highlights key areas, outlining why they are attractive for hosts and guests, along with notable local attractions. Consider these locations based on your target guest profile and investment strategy.
| Neighborhood / Area | Why Host Here? (Target Guests & Appeal) | Key Attractions & Landmarks |
|---|---|---|
| Bailly | A charming and quiet suburb in the western suburbs of Paris, offering a family-friendly atmosphere and proximity to major attractions. Perfect for travelers seeking a peaceful stay while being close to the hustle and bustle of Paris. | Château de Bailly, Parc de la Vallée aux Loups, La Ferme de Gally, Proximité de Versailles, Espace Richaud |
| Versailles | Famous for its stunning palace and gardens, Versailles attracts millions of visitors each year. An ideal location for hosting Airbnb as guests come to explore the rich history and grandeur of France. | Palace of Versailles, Gardens of Versailles, Grand Trianon, Petit Trianon, France Miniature |
| Saint-Germain-en-Laye | A picturesque historic town known for its beautiful architecture and parks. It's a great escape from Paris with easy access to the city via public transport. Perfect for families and tourists who want a quieter stay. | Château de Saint-Germain-en-Laye, Parc du Château, Musée d'Archéologie, Carrières de la Lumière, Saint-Germain-en-Laye Forest |
| Rueil-Malmaison | Known for its historical connections to Napoleon and Josephine, Rueil-Malmaison offers a unique mix of history and modernity, making it attractive for visitors looking for an alternative to central Paris. | Château de Malmaison, Parc de Bois-Préau, Musée des Impressionnismes, La Seine, Les Quais de Seine |
| Sèvres | A charming town located near the Seine River, Sèvres is known for its porcelain craftsmanship and is close to Paris but offers a serene environment. A great choice for those looking for a more relaxed experience. | Sèvres – Cité de la céramique, Parc de Saint Cloud, Musee de la Ceramique, Parc de la Croûte, Seine River |
| Chatou | Located close to the Seine and a short train ride to Paris, Chatou has a friendly atmosphere and scenic views, making it popular among local tourists and Parisians alike. | Ile des Impressionnistes, Parc de la Charmeraie, Painters' Island, Seine River walks, Chatou Market |
| Le Chesnay | A suburban area that offers peace and proximity to the lively city life of Versailles, Le Chesnay is perfect for families and those wanting a homey stay with easy access to entertainment and culture. | Centre Commercial Parly 2, Versailles Forest, Les Terrasses de l'Yvelines, Château de Versailles nearby, Local parks |
| Meudon | A residential area with great views over Paris, Meudon is known for its green spaces and is ideal for visitors looking to experience a local suburban life while being close to the city’s main attractions. | Meudon Forest, Observatory of Meudon, Museum of the History of Medicine, Château de Meudon, Parc de l'Observatoire |
Understanding Airbnb License Requirements & STR Laws in Bailly (2025)
While Bailly, Ile-de-France, France currently shows low STR regulations, specific Airbnb license requirements might still exist or change. Always verify the latest short term rental regulations and Airbnb license requirements directly with local government authorities for Bailly to ensure full compliance before hosting.
(Source: AirROI data, 2025, finding no licensed listings among those analyzed)
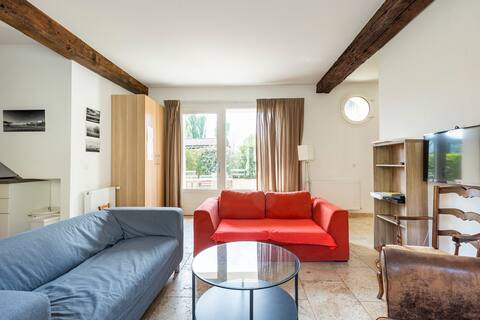
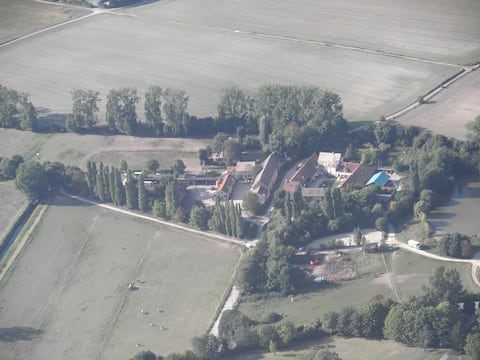
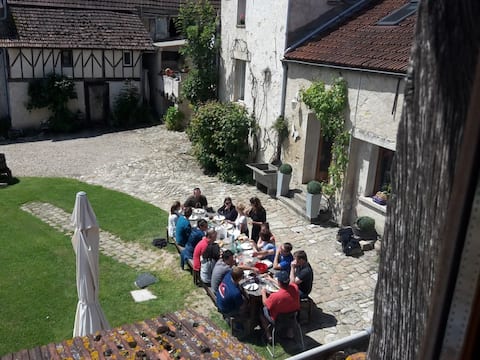
Top Performing Airbnb Properties in Bailly (2025)
Benchmark your potential! Explore examples of top-performing Airbnb properties in Baillybased on Trailing Twelve Month (TTM) revenue. Analyze their characteristics, revenue, occupancy rate, and ADR to understand what drives success in this market.
Ferme de Pontaly - Paris 20 minutes away
Entire Place • 3 bedrooms

4 bedrooms sunny family home
Entire Place • 4 bedrooms

Maison d’architecte splendide
Entire Place • 4 bedrooms
Ferme de Pontaly -Versailles à 10 min
Entire Place • 2 bedrooms
La Ferme des Moulineaux - Fleurs
Entire Place • 4 bedrooms

3 bedroom Apartment
Entire Place • 3 bedrooms
Note: Performance varies based on location, size, amenities, seasonality, and management quality. Data reflects the past 12 months.
Top Performing Airbnb Hosts in Bailly (2025)
Learn from the best! This table showcases top-performing Airbnb hosts in Bailly based on the number of properties managed and estimated total revenue over the past year. Analyze their scale and performance metrics.
| Host Name | Properties | Grossing Revenue | Stay Reviews | Avg Rating |
|---|---|---|---|---|
| Cécile Et Alexandre | 3 | $161,174 | 283 | 4.90/5.0 |
| Host #22486895 | 1 | $63,046 | 0 | 0.00/5.0 |
| Nicolas | 4 | $61,226 | 39 | 4.49/5.0 |
| Host #23238079 | 1 | $45,274 | 0 | 0.00/5.0 |
| Jean-Claude | 1 | $27,142 | 14 | 5.00/5.0 |
| Host #19331500 | 1 | $21,208 | 1 | 0.00/5.0 |
| Host #60373287 | 1 | $14,578 | 0 | 0.00/5.0 |
| Host #95898627 | 1 | $11,603 | 0 | 0.00/5.0 |
| Laurence | 1 | $8,817 | 5 | 5.00/5.0 |
| Guillaume | 2 | $6,697 | 13 | 2.13/5.0 |
Analyzing the strategies of top hosts, such as their property selection, pricing, and guest communication, can offer valuable lessons for optimizing your own Airbnb operations in Bailly.
Dive Deeper: Advanced Bailly STR Market Data (2025)
Ready to unlock more insights? AirROI provides access to advanced metrics and comprehensive Airbnb data for Bailly. Explore detailed analytics beyond this report to refine your investment strategy, optimize pricing, and maximize your vacation rental profits.
Explore Advanced MetricsBailly Short-Term Rental Market Composition (2025): Property & Room Types
Room Type Distribution
Property Type Distribution
Market Composition Insights for Bailly
- The Bailly Airbnb market composition is heavily skewed towards Entire Home/Apt listings, which make up 58.3% of the 24 active rentals. This indicates strong guest preference for privacy and space.
- However, a notable 37.5% share for Private Rooms suggests opportunities for budget-conscious travelers or hosts renting out spare rooms.
- Looking at the property type distribution in Bailly, Apartment/Condo properties are the most common (50%), reflecting the local real estate landscape.
- Houses represent a significant 25% portion, catering likely to families or larger groups.
- The presence of 12.5% Hotel/Boutique listings indicates integration with traditional hospitality.
Bailly Airbnb Room Capacity Analysis (2025): Bedroom Distribution
Distribution of Listings by Number of Bedrooms
Room Capacity Insights for Bailly
- The dominant room capacity in Bailly is 2 bedrooms listings, making up 33.3% of the market. This suggests a strong demand for properties suitable for couples or solo travelers.
- Together, 2 bedrooms and 4 bedrooms properties represent 58.3% of the active Airbnb listings in Bailly, indicating a high concentration in these sizes.
- A significant 45.8% of listings offer 3+ bedrooms, catering to larger groups and families seeking more space in Bailly.
Bailly Vacation Rental Guest Capacity Trends (2025)
Distribution of Listings by Guest Capacity
Guest Capacity Insights for Bailly
- The most common guest capacity trend in Bailly vacation rentals is listings accommodating 8+ guests (37.5%). This suggests the primary traveler segment is likely larger groups.
- Properties designed for 8+ guests and 4 guests dominate the Bailly STR market, accounting for 50.0% of listings.
- 45.9% of properties accommodate 6+ guests, serving the market segment for larger families or group travel in Bailly.
- On average, properties in Bailly are equipped to host 4.6 guests.
Bailly Airbnb Booking Patterns (2025): Available vs. Booked Days
Available Days Distribution
Booked Days Distribution
Booking Pattern Insights for Bailly
- The most common availability pattern in Bailly falls within the 271-366 days range, representing 83.3% of listings. This suggests many properties have significant open periods on their calendars.
- Approximately 91.6% of listings show high availability (181+ days open annually), indicating potential for increased bookings or specific owner usage patterns.
- For booked days, the 31-90 days range is most frequent in Bailly (45.8%), reflecting common guest stay durations or potential owner blocking patterns.
- A notable 8.4% of properties secure long booking periods (181+ days booked per year), highlighting successful long-term rental strategies or significant owner usage.
Bailly Airbnb Minimum Stay Requirements Analysis
Distribution of Listings by Minimum Night Requirement
1 Night
9 listings
42.9% of total
2 Nights
3 listings
14.3% of total
3 Nights
5 listings
23.8% of total
4-6 Nights
1 listings
4.8% of total
7-29 Nights
2 listings
9.5% of total
30+ Nights
1 listings
4.8% of total
Key Insights
- The most prevalent minimum stay requirement in Bailly is 1 Night, adopted by 42.9% of listings. This highlights the market's preference for shorter, flexible bookings.
Recommendations
- Align with the market by considering a 1 Night minimum stay, as 42.9% of Bailly hosts use this setting.
- Adjust minimum nights based on seasonality – potentially shorter during low season and longer during peak demand periods in Bailly.
Bailly Airbnb Cancellation Policy Trends Analysis (2025)
Flexible
3 listings
25% of total
Moderate
2 listings
16.7% of total
Firm
3 listings
25% of total
Strict
4 listings
33.3% of total
Cancellation Policy Insights for Bailly
- The prevailing Airbnb cancellation policy trend in Bailly is Strict, used by 33.3% of listings.
- A majority (58.3%) of hosts in Bailly utilize Firm or Strict policies, indicating a market where hosts prioritize booking security.
Recommendations for Hosts
- Consider adopting a Strict policy to align with the 33.3% market standard in Bailly.
- With 33.3% using Strict terms, this is a viable option in Bailly, particularly for high-value properties or during peak demand periods.
- Regularly review your cancellation policy against competitors and market demand shifts in Bailly.
Bailly STR Booking Lead Time Analysis (2025)
Average Booking Lead Time by Month
Booking Lead Time Insights for Bailly
- The overall average booking lead time for vacation rentals in Bailly is 50 days.
- Guests book furthest in advance for stays during June (average 137 days), likely coinciding with peak travel demand or local events.
- The shortest booking windows occur for stays in November (average 22 days), indicating more last-minute travel plans during this time.
- Seasonally, Summer (84 days avg.) sees the longest lead times, while Spring (40 days avg.) has the shortest, reflecting typical travel planning cycles.
Recommendations for Hosts
- Use the overall average lead time (50 days) as a baseline for your pricing and availability strategy in Bailly.
- For June stays, consider implementing length-of-stay discounts or slightly higher rates for bookings made less than 137 days out to capitalize on advance planning.
- Target marketing efforts for the Summer season well in advance (at least 84 days) to capture early planners.
- Monitor your own booking lead times against these Bailly averages to identify opportunities for dynamic pricing adjustments.
Popular & Essential Airbnb Amenities in Bailly (2025)
Amenity Prevalence
Amenity Insights for Bailly
- Essential amenities in Bailly that guests expect include: Wifi, Kitchen. Lacking these (any) could significantly impact bookings.
- Popular amenities like TV, Essentials, Smoke alarm are common but not universal. Offering these can provide a competitive edge.
Recommendations for Hosts
- Ensure your listing includes all essential amenities for Bailly: Wifi, Kitchen.
- Prioritize adding missing essentials: Kitchen.
- Consider adding popular differentiators like TV or Essentials to increase appeal.
- Highlight unique or less common amenities you offer (e.g., hot tub, dedicated workspace, EV charger) in your listing description and photos.
- Regularly check competitor amenities in Bailly to stay competitive.
Bailly Airbnb Guest Demographics & Profile Analysis (2025)
Guest Profile Summary for Bailly
- The typical guest profile for Airbnb in Bailly consists of a mix of domestic (49%) and international guests, with top international origins including Germany, typically belonging to the Post-2000s (Gen Z/Alpha) group (50%), primarily speaking English or French.
- Domestic travelers account for 48.6% of guests.
- Key international markets include France (48.6%) and Germany (13.5%).
- Top languages spoken are English (39%) followed by French (31.7%).
- A significant demographic segment is the Post-2000s (Gen Z/Alpha) group, representing 50% of guests.
Recommendations for Hosts
- Balance marketing efforts between domestic and international channels based on the guest mix.
- Tailor amenities and listing descriptions to appeal to the dominant Post-2000s (Gen Z/Alpha) demographic (e.g., highlight fast WiFi, smart home features, local guides).
- Highlight unique local experiences or amenities relevant to the primary guest profile.
- Consider seasonal promotions aligned with peak travel times for key origin markets.
Nearby Short-Term Rental Market Comparison
How does the Bailly Airbnb market stack up against its neighbors? Compare key performance metrics like average monthly revenue, ADR, and occupancy rates in surrounding areas to understand the broader regional STR landscape.
| Market | Active Properties | Monthly Revenue | Daily Rate | Avg. Occupancy |
|---|---|---|---|---|
| Morienval | 10 | $5,794 | $400.84 | 32% |
| Verdelot | 13 | $3,885 | $300.79 | 46% |
| Trigny | 10 | $3,775 | $248.19 | 46% |
| La Couture-Boussey | 12 | $3,620 | $378.08 | 28% |
| Dourdan | 15 | $3,576 | $223.06 | 52% |
| Rosoy-en-Multien | 15 | $3,558 | $367.61 | 51% |
| Millançay | 11 | $3,476 | $370.42 | 39% |
| Chaintreaux | 11 | $3,136 | $278.28 | 34% |
| Langon-sur-Cher | 12 | $3,127 | $400.27 | 35% |
| Mesnils-sur-Iton | 22 | $3,028 | $309.05 | 40% |