Avon Airbnb Market Analysis 2025: Short Term Rental Data & Vacation Rental Statistics in Ile-de-France, France
Is Airbnb profitable in Avon in 2025? Explore comprehensive Airbnb analytics for Avon, Ile-de-France, France to uncover income potential. This 2025 STR market report for Avon, based on AirROI data from April 2024 to March 2025, reveals key trends in the niche market of 78 active listings.
Whether you're considering an Airbnb investment in Avon, optimizing your existing vacation rental, or exploring rental arbitrage opportunities, understanding the Avon Airbnb data is crucial. Leveraging the low regulation environment is key to maximizing your short term rental income potential. Let's dive into the specifics.
Key Avon Airbnb Performance Metrics Overview
Monthly Airbnb Revenue Variations & Income Potential in Avon (2025)
Understanding the monthly revenue variations for Airbnb listings in Avon is key to maximizing your short term rental income potential. Seasonality significantly impacts earnings. Our analysis, based on data from the past 12 months, shows that the peak revenue month for STRs in Avon is typically May, while February often presents the lowest earnings, highlighting opportunities for strategic pricing adjustments during shoulder and low seasons. Explore the typical Airbnb income in Avon across different performance tiers:
- Best-in-class properties (Top 10%) achieve $3,491+ monthly, often utilizing dynamic pricing and superior guest experiences.
- Strong performing properties (Top 25%) earn $2,099 or more, indicating effective management and desirable locations/amenities.
- Typical properties (Median) generate around $1,158 per month, representing the average market performance.
- Entry-level properties (Bottom 25%) see earnings around $522, often with potential for optimization.
Average Monthly Airbnb Earnings Trend in Avon
Avon Airbnb Occupancy Rate Trends (2025)
Maximize your bookings by understanding the Avon STR occupancy trends. Seasonal demand shifts significantly influence how often properties are booked. Typically, Octobersees the highest demand (peak season occupancy), while March experiences the lowest (low season). Effective strategies, like adjusting minimum stays or offering promotions, can boost occupancy during slower periods. Here's how different property tiers perform in Avon:
- Best-in-class properties (Top 10%) achieve 82%+ occupancy, indicating high desirability and potentially optimized availability.
- Strong performing properties (Top 25%) maintain 67% or higher occupancy, suggesting good market fit and guest satisfaction.
- Typical properties (Median) have an occupancy rate around 43%.
- Entry-level properties (Bottom 25%) average 22% occupancy, potentially facing higher vacancy.
Average Monthly Occupancy Rate Trend in Avon
Average Daily Rate (ADR) Airbnb Trends in Avon (2025)
Effective short term rental pricing strategy in Avon involves understanding monthly ADR fluctuations. The Average Daily Rate (ADR) for Airbnb in Avon typically peaks in December and dips lowest during September. Leveraging Airbnb dynamic pricing tools or strategies based on this seasonality can significantly boost revenue. Here's a look at the typical nightly rates achieved:
- Best-in-class properties (Top 10%) command rates of $164+ per night, often due to premium features or locations.
- Strong performing properties (Top 25%) achieve nightly rates of $101 or more.
- Typical properties (Median) charge around $67 per night.
- Entry-level properties (Bottom 25%) earn around $46 per night.
Average Daily Rate (ADR) Trend by Month in Avon
Get Live Avon Market Intelligence 👇

Explore Real-time Analytics
Airbnb Seasonality Analysis & Trends in Avon (2025)
Peak Season (May, April, August)
- Revenue averages $2,278 per month
- Occupancy rates average 53.6%
- Daily rates average $92
Shoulder Season
- Revenue averages $1,626 per month
- Occupancy maintains around 46.5%
- Daily rates hold near $95
Low Season (January, February, March)
- Revenue drops to average $1,145 per month
- Occupancy decreases to average 35.6%
- Daily rates adjust to average $96
Seasonality Insights for Avon
- The Airbnb seasonality in Avon shows highly seasonal trends requiring careful strategy. While the sections above show seasonal averages, it's also insightful to look at the extremes:
- During the high season, the absolute peak month showcases Avon's highest earning potential, with monthly revenues capable of climbing to $2,320, occupancy reaching a high of 55.2%, and ADRs peaking at $103.
- Conversely, the slowest single month of the year, typically falling within the low season, marks the market's lowest point. In this month, revenue might dip to $1,030, occupancy could drop to 34.4%, and ADRs may adjust down to $90.
- Understanding both the seasonal averages and these monthly peaks and troughs in revenue, occupancy, and ADR is crucial for maximizing your Airbnb profit potential in Avon.
Seasonal Strategies for Maximizing Profit
- Peak Season: Maximize revenue through premium pricing and potentially longer minimum stays. Ensure high availability.
- Low Season: Offer competitive pricing, special promotions (e.g., extended stay discounts), and flexible cancellation policies. Target off-season travelers like remote workers or budget-conscious guests.
- Shoulder Seasons: Implement dynamic pricing that balances peak and low rates. Target weekend travelers or specific events. Offer slightly more flexible terms than peak season.
- Regularly analyze your own performance against these Avon seasonality benchmarks and adjust your pricing and availability strategy accordingly.
Best Areas for Airbnb Investment in Avon (2025)
Exploring the top neighborhoods for short-term rentals in Avon? This section highlights key areas, outlining why they are attractive for hosts and guests, along with notable local attractions. Consider these locations based on your target guest profile and investment strategy.
| Neighborhood / Area | Why Host Here? (Target Guests & Appeal) | Key Attractions & Landmarks |
|---|---|---|
| Versailles | Famous for its palace and gardens, Versailles attracts tourists visiting the historic site as well as those interested in French history and culture. Proximity to Paris makes it a desirable location for travelers. | Palace of Versailles, Gardens of Versailles, Grand Trianon, Marie Antoinette's Estate, Versailles Cathedral |
| Saint-Germain-des-Prés | A historic and artistic neighborhood in Paris, known for its cafes, galleries, and literary history. Appeals to those seeking a quintessential Parisian experience with charm and culture. | Café de Flore, Les Deux Magots, Saint-Germain-des-Prés Church, Luxembourg Gardens, Musee d'Orsay |
| Le Marais | A trendy and vibrant district in Paris, known for its boutiques, art galleries, and nightlife. Very popular with tourists looking for a lively urban experience. | Place des Vosges, Picasso Museum, Carré des Antiquaires, The Jewish Quarter, Shopping on Rue des Francs-Bourgeois |
| Montmartre | Famous for its artistic history and the Sacré-Cœur Basilica, Montmartre offers stunning views of Paris and attracts many visitors for its bohemian atmosphere. | Sacré-Cœur Basilica, Place du Tertre, Dalí Paris Museum, Montmartre Vineyards, Moulin Rouge |
| La Défense | The modern business district of Paris, attracting business travelers and tourists interested in contemporary architecture. Offers a different view of Paris compared to historic neighborhoods. | La Grande Arche, Les Quatre Temps shopping center, CNIT, Esplanade of La Défense, Sculptures on the Esplanade |
| Fontainebleau | Known for its beautiful château and forest, Fontainebleau is a historic town that draws in visitors for its natural beauty and rich culture. | Château de Fontainebleau, Fontainebleau Forest, Court of Honor, The Renaissance Garden, Napoleon's Museum |
| Chantilly | A beautiful town known for its stunning château and horse racing heritage. A quieter alternative for those seeking history and natural landscapes near Paris. | Château de Chantilly, Chantilly Horse Museum, Great Stables, Condé Museum, Chantilly Forest |
| Disneyland Paris | A world-famous theme park that attracts families and tourists from around the globe. High demand for accommodations year-round due to its popularity. | Disneyland Park, Walt Disney Studios Park, Disney Village, Sequoia Lodge, Newport Bay Club |
Understanding Airbnb License Requirements & STR Laws in Avon (2025)
While Avon, Ile-de-France, France currently shows low STR regulations, specific Airbnb license requirements might still exist or change. Always verify the latest short term rental regulations and Airbnb license requirements directly with local government authorities for Avon to ensure full compliance before hosting.
(Source: AirROI data, 2025, based on 6% licensed listings)
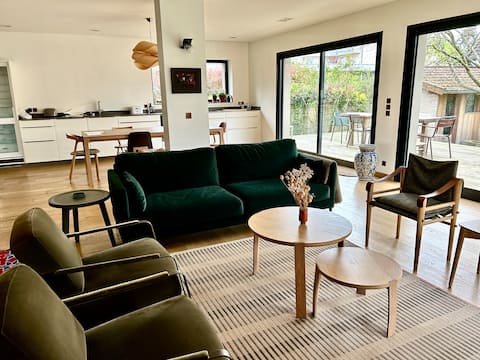
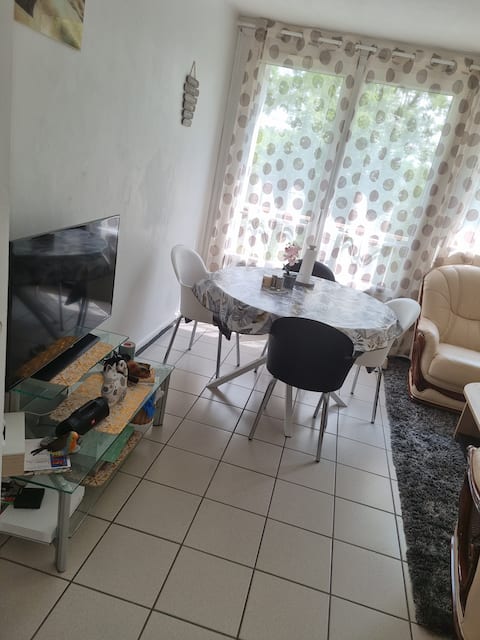
Top Performing Airbnb Properties in Avon (2025)
Benchmark your potential! Explore examples of top-performing Airbnb properties in Avonbased on Trailing Twelve Month (TTM) revenue. Analyze their characteristics, revenue, occupancy rate, and ADR to understand what drives success in this market.

Bleautiful Joséphine - town house with garden
Entire Place • 4 bedrooms

Imperial House 1850 Balnéo - Parking
Entire Place • N/A
Beautiful detached house.
Entire Place • 3 bedrooms
Appartement 2 chambres
Entire Place • 2 bedrooms

Imperial House Confort - 5 min Gare - Parking
Entire Place • N/A

Villa close to Chateau de Fontainebleau
Entire Place • 8 bedrooms
Note: Performance varies based on location, size, amenities, seasonality, and management quality. Data reflects the past 12 months.
Top Performing Airbnb Hosts in Avon (2025)
Learn from the best! This table showcases top-performing Airbnb hosts in Avon based on the number of properties managed and estimated total revenue over the past year. Analyze their scale and performance metrics.
| Host Name | Properties | Grossing Revenue | Stay Reviews | Avg Rating |
|---|---|---|---|---|
| Christelle | 1 | $105,529 | 18 | 5.00/5.0 |
| Pascal | 2 | $101,812 | 310 | 4.87/5.0 |
| Francisca | 1 | $46,171 | 7 | 4.86/5.0 |
| Host #273771020 | 1 | $43,398 | 0 | 0.00/5.0 |
| Thierry | 3 | $39,320 | 149 | 4.86/5.0 |
| Host #90936193 | 1 | $38,346 | 0 | 0.00/5.0 |
| Maison Chardonneret | 2 | $36,083 | 66 | 4.43/5.0 |
| Sylvie | 1 | $33,256 | 75 | 4.93/5.0 |
| Manu | 1 | $33,114 | 67 | 5.00/5.0 |
| Océane | 1 | $32,825 | 40 | 4.88/5.0 |
Analyzing the strategies of top hosts, such as their property selection, pricing, and guest communication, can offer valuable lessons for optimizing your own Airbnb operations in Avon.
Dive Deeper: Advanced Avon STR Market Data (2025)
Ready to unlock more insights? AirROI provides access to advanced metrics and comprehensive Airbnb data for Avon. Explore detailed analytics beyond this report to refine your investment strategy, optimize pricing, and maximize your vacation rental profits.
Explore Advanced MetricsAvon Short-Term Rental Market Composition (2025): Property & Room Types
Room Type Distribution
Property Type Distribution
Market Composition Insights for Avon
- The Avon Airbnb market composition is heavily skewed towards Entire Home/Apt listings, which make up 70.5% of the 78 active rentals. This indicates strong guest preference for privacy and space.
- Looking at the property type distribution in Avon, Apartment/Condo properties are the most common (56.4%), reflecting the local real estate landscape.
- Houses represent a significant 37.2% portion, catering likely to families or larger groups.
- The presence of 6.4% Hotel/Boutique listings indicates integration with traditional hospitality.
Avon Airbnb Room Capacity Analysis (2025): Bedroom Distribution
Distribution of Listings by Number of Bedrooms
Room Capacity Insights for Avon
- The dominant room capacity in Avon is 1 bedroom listings, making up 38.5% of the market. This suggests a strong demand for properties suitable for couples or solo travelers.
- Together, 1 bedroom and 2 bedrooms properties represent 69.3% of the active Airbnb listings in Avon, indicating a high concentration in these sizes.
- Listings with 3+ bedrooms (8.9%) represent a smaller niche, potentially indicating an underserved market for larger group accommodations in Avon.
Avon Vacation Rental Guest Capacity Trends (2025)
Distribution of Listings by Guest Capacity
Guest Capacity Insights for Avon
- The most common guest capacity trend in Avon vacation rentals is listings accommodating 2 guests (26.9%). This suggests the primary traveler segment is likely couples or solo travelers.
- Properties designed for 2 guests and 4 guests dominate the Avon STR market, accounting for 50.0% of listings.
- 14.1% of properties accommodate 6+ guests, serving the market segment for larger families or group travel in Avon.
- On average, properties in Avon are equipped to host 3.1 guests.
Avon Airbnb Booking Patterns (2025): Available vs. Booked Days
Available Days Distribution
Booked Days Distribution
Booking Pattern Insights for Avon
- The most common availability pattern in Avon falls within the 271-366 days range, representing 46.2% of listings. This suggests many properties have significant open periods on their calendars.
- Approximately 69.3% of listings show high availability (181+ days open annually), indicating potential for increased bookings or specific owner usage patterns.
- For booked days, the 181-270 days range is most frequent in Avon (30.8%), reflecting common guest stay durations or potential owner blocking patterns.
- A notable 34.6% of properties secure long booking periods (181+ days booked per year), highlighting successful long-term rental strategies or significant owner usage.
Avon Airbnb Minimum Stay Requirements Analysis
Distribution of Listings by Minimum Night Requirement
1 Night
26 listings
35.6% of total
2 Nights
29 listings
39.7% of total
3 Nights
3 listings
4.1% of total
4-6 Nights
9 listings
12.3% of total
7-29 Nights
5 listings
6.8% of total
30+ Nights
1 listings
1.4% of total
Key Insights
- The most prevalent minimum stay requirement in Avon is 2 Nights, adopted by 39.7% of listings. This highlights the market's preference for shorter, flexible bookings.
- A strong majority (75.3%) of the Avon Airbnb data shows acceptance of very short stays (1-2 nights), indicating a dynamic, high-turnover market.
- Dedicated monthly rentals (30+ nights) represent a small niche (1.4%), possibly an untapped area for hosts.
Recommendations
- Align with the market by considering a 2 Nights minimum stay, as 39.7% of Avon hosts use this setting.
- Adjust minimum nights based on seasonality – potentially shorter during low season and longer during peak demand periods in Avon.
Avon Airbnb Cancellation Policy Trends Analysis (2025)
Non-refundable
1 listings
1.6% of total
Flexible
18 listings
29% of total
Moderate
23 listings
37.1% of total
Firm
12 listings
19.4% of total
Strict
8 listings
12.9% of total
Cancellation Policy Insights for Avon
- The prevailing Airbnb cancellation policy trend in Avon is Moderate, used by 37.1% of listings.
- There's a relatively balanced mix between guest-friendly (66.1%) and stricter (32.3%) policies, offering choices for different guest needs.
Recommendations for Hosts
- Consider adopting a Moderate policy to align with the 37.1% market standard in Avon.
- Using a Strict policy might deter some guests, as only 12.9% of listings use it. Evaluate if potential revenue protection outweighs possible lower booking rates.
- Regularly review your cancellation policy against competitors and market demand shifts in Avon.
Avon STR Booking Lead Time Analysis (2025)
Average Booking Lead Time by Month
Booking Lead Time Insights for Avon
- The overall average booking lead time for vacation rentals in Avon is 44 days.
- Guests book furthest in advance for stays during June (average 79 days), likely coinciding with peak travel demand or local events.
- The shortest booking windows occur for stays in February (average 28 days), indicating more last-minute travel plans during this time.
- Seasonally, Summer (69 days avg.) sees the longest lead times, while Winter (39 days avg.) has the shortest, reflecting typical travel planning cycles.
Recommendations for Hosts
- Use the overall average lead time (44 days) as a baseline for your pricing and availability strategy in Avon.
- For June stays, consider implementing length-of-stay discounts or slightly higher rates for bookings made less than 79 days out to capitalize on advance planning.
- Target marketing efforts for the Summer season well in advance (at least 69 days) to capture early planners.
- Monitor your own booking lead times against these Avon averages to identify opportunities for dynamic pricing adjustments.
Popular & Essential Airbnb Amenities in Avon (2025)
Amenity Prevalence
Amenity Insights for Avon
- Essential amenities in Avon that guests expect include: Heating. Lacking these (this) could significantly impact bookings.
- Popular amenities like Wifi, Hot water, Kitchen are common but not universal. Offering these can provide a competitive edge.
- Warning: Wifi is not universally provided but is considered essential globally. Ensure reliable Wifi is offered.
Recommendations for Hosts
- Ensure your listing includes all essential amenities for Avon: Heating.
- Prioritize adding missing essentials: Heating.
- Consider adding popular differentiators like Wifi or Hot water to increase appeal.
- Highlight unique or less common amenities you offer (e.g., hot tub, dedicated workspace, EV charger) in your listing description and photos.
- Regularly check competitor amenities in Avon to stay competitive.
Avon Airbnb Guest Demographics & Profile Analysis (2025)
Guest Profile Summary for Avon
- The typical guest profile for Airbnb in Avon consists of primarily domestic travelers (72%), often arriving from nearby Paris, typically belonging to the Post-2000s (Gen Z/Alpha) group (50%), primarily speaking French or English.
- Domestic travelers account for 71.5% of guests.
- Key international markets include France (71.5%) and United Kingdom (4.8%).
- Top languages spoken are French (37.5%) followed by English (34.5%).
- A significant demographic segment is the Post-2000s (Gen Z/Alpha) group, representing 50% of guests.
Recommendations for Hosts
- Target domestic marketing efforts towards travelers from Paris and London.
- Tailor amenities and listing descriptions to appeal to the dominant Post-2000s (Gen Z/Alpha) demographic (e.g., highlight fast WiFi, smart home features, local guides).
- Highlight unique local experiences or amenities relevant to the primary guest profile.
- Consider seasonal promotions aligned with peak travel times for key origin markets.
Nearby Short-Term Rental Market Comparison
How does the Avon Airbnb market stack up against its neighbors? Compare key performance metrics like average monthly revenue, ADR, and occupancy rates in surrounding areas to understand the broader regional STR landscape.
| Market | Active Properties | Monthly Revenue | Daily Rate | Avg. Occupancy |
|---|---|---|---|---|
| Morienval | 10 | $5,794 | $400.84 | 32% |
| Verdelot | 13 | $3,885 | $300.79 | 46% |
| Trigny | 10 | $3,775 | $248.19 | 46% |
| La Couture-Boussey | 12 | $3,620 | $378.08 | 28% |
| Dourdan | 15 | $3,576 | $223.06 | 52% |
| Rosoy-en-Multien | 15 | $3,558 | $367.61 | 51% |
| Millançay | 11 | $3,476 | $370.42 | 39% |
| Chaintreaux | 11 | $3,136 | $278.28 | 34% |
| Langon-sur-Cher | 12 | $3,127 | $400.27 | 35% |
| Mesnils-sur-Iton | 22 | $3,028 | $309.05 | 40% |